|
|
市場調査レポート
商品コード
1074759
放射線検出・モニタリング・安全技術の世界市場(2022年~2026年)Global Radiation Detection Monitoring and Safety Market 2022-2026 |
||||||
|
|
|||||||
|
● お客様のご希望に応じて、既存データの加工や未掲載情報(例:国別セグメント)の追加などの対応が可能です。 詳細はお問い合わせください。 |
|||||||


| 放射線検出・モニタリング・安全技術の世界市場(2022年~2026年) |
|
出版日: 2022年05月06日
発行: TechNavio
ページ情報: 英文 120 Pages
納期: 即納可能
|
- 全表示
- 概要
- 図表
- 目次
世界の放射線検出・モニタリング・安全技術の市場規模は、2022年~2026年の間に14億8,000万米ドルの増加が見込まれ、予測期間中のCAGRで7.21%の成長が予測されています。
市場を牽引しているのは、軍事費の増加、医療業界における需要の増加、放射線検出・モニタリング・安全技術を利用するよう義務付ける規制です。
当レポートでは、世界の放射線検出・モニタリング・安全技術市場について調査分析し、全体分析、市場規模・予測、動向、成長促進要因、課題、および約25社を網羅したベンダー分析を提供しています。
目次
第1章 エグゼクティブサマリー
- 市場概要
第2章 市場情勢
- 市場のエコシステム
第3章 市場規模
- 市場の定義
- 市場セグメント分析
- 市場規模:2021年
- 市場の見通し:2021年~2026年の予測
第4章 ファイブフォース分析
- ファイブフォースの要約
- 買い手の交渉力
- 供給企業の交渉力
- 新規参入業者がもたらす脅威
- 代替品がもたらす脅威
- ライバル業者がもたらす脅威
- 市況
第5章 市場セグメンテーション:用途別
- 市場セグメント
- 比較:用途別
- 医療 - 市場規模と予測(2021年~2026年)
- 原子力発電所 - 市場規模と予測(2021年~2026年)
- 国土安全保障・防衛 - 市場規模と予測(2021年~2026年)
- 産業用 - 市場規模と予測(2021年~2026年)
- 市場機会:用途別 - 市場規模と予測(2021年~2026年)
第6章 顧客情勢
- 概要
第7章 地域別情勢
- 地域セグメンテーション
- 地域比較
- 北米 - 市場規模と予測(2021年~2026年)
- 欧州 - 市場規模と予測(2021年~2026年)
- アジア太平洋地域 - 市場規模と予測(2021年~2026年)
- 中東とアフリカ - 市場規模と予測(2021年~2026年)
- 南米 - 市場規模と予測(2021年~2026年)
- 米国 - 市場規模と予測(2021年~2026年)
- 中国 - 市場規模と予測(2021年~2026年)
- ドイツ - 市場規模と予測(2021年~2026年)
- 日本 - 市場規模と予測(2021年~2026年)
- フランス - 市場規模と予測(2021年~2026年)
- 市場機会:地域情勢別
第8章 促進要因、課題、および動向
- 市場促進要因
- 市場の課題
- 促進要因と課題の影響
- 市場動向
第9章 ベンダー情勢
- 概要
- ベンダー情勢
- 混乱の状況
- 業界のリスク
第10章 ベンダー分析
- 対象ベンダー
- ベンダーの市場ポジショニング
- Amray Medical
- Fuji Electric Co. Ltd.
- Honeywell International Inc.
- LANDAUER
- Ludlum Measurements Inc.
- Mirion Technologies Inc.
- Polimaster LLC
- S.E. International Inc.
- Teledyne FLIR LLC
- Thermo Fisher Scientific Inc.
第11章 付録
Exhibits:
- Exhibits1: Executive Summary - Chart on Market Overview
- Exhibits2: Executive Summary - Data Table on Market Overview
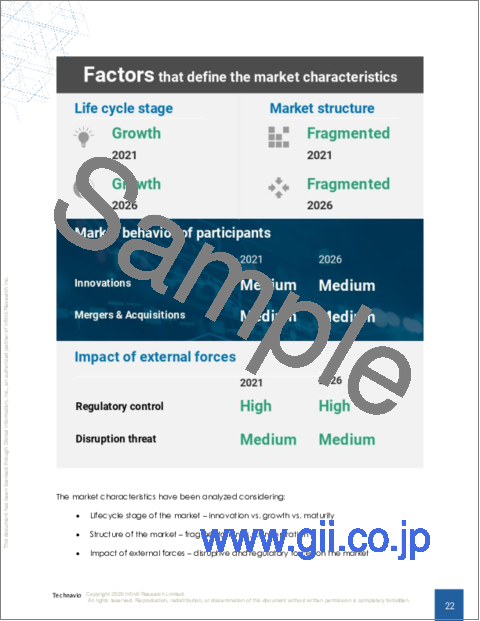
- Exhibits3: Executive Summary - Chart on Global Market Characteristics
- Exhibits4: Executive Summary - Chart on Market By Geographical Landscape
- Exhibits5: Executive Summary - Chart on Market Segmentation by Application
- Exhibits6: Executive Summary - Chart on Incremental Growth
- Exhibits7: Executive Summary - Data Table on Incremental Growth
- Exhibits8: Executive Summary - Chart on Vendor Market Positioning
- Exhibits9: Parent market
- Exhibits10: Market Characteristics
- Exhibits11: Offerings of vendors included in the market definition
- Exhibits12: Market segments
- Exhibits13: Chart on Global - Market size and forecast 2021-2026 ($ million)
- Exhibits14: Data Table on Global - Market size and forecast 2021-2026 ($ million)
- Exhibits15: Chart on Global Market: Year-over-year growth 2021-2026 (%)
- Exhibits16: Data Table on Global Market: Year-over-year growth 2021-2026 (%)
- Exhibits17: Five forces analysis - Comparison between2021 and 2026
- Exhibits18: Chart on Bargaining power of buyers - Impact of key factors 2021 and 2026
- Exhibits19: Bargaining power of suppliers - Impact of key factors in 2021 and 2026
- Exhibits20: Threat of new entrants - Impact of key factors in 2021 and 2026
- Exhibits21: Threat of substitutes - Impact of key factors in 2021 and 2026
- Exhibits22: Threat of rivalry - Impact of key factors in 2021 and 2026
- Exhibits23: Chart on Market condition - Five forces 2021 and 2026
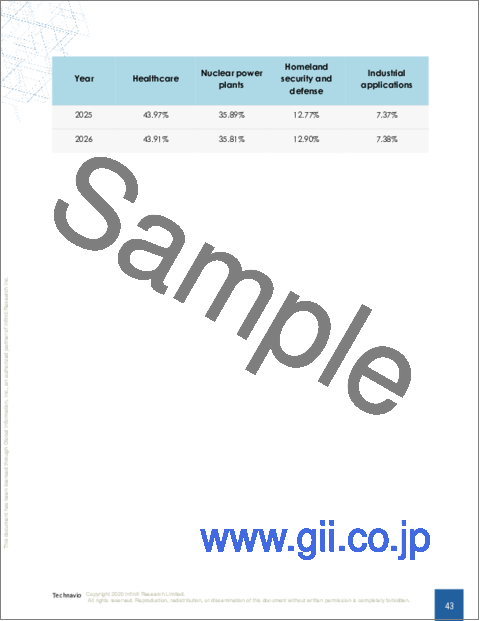
- Exhibits24: Chart on Application - Market share 2021-2026 (%)
- Exhibits25: Data Table on Application - Market share 2021-2026 (%)
- Exhibits26: Chart on Comparison by Application
- Exhibits27: Data Table on Comparison by Application
- Exhibits28: Chart on Healthcare - Market size and forecast 2021-2026 ($ million)
- Exhibits29: Data Table on Healthcare - Market size and forecast 2021-2026 ($ million)
- Exhibits30: Chart on Healthcare - Year-over-year growth 2021-2026 (%)
- Exhibits31: Data Table on Healthcare - Year-over-year growth 2021-2026 (%)
- Exhibits32: Chart on Nuclear power plants - Market size and forecast 2021-2026 ($ million)
- Exhibits33: Data Table on Nuclear power plants - Market size and forecast 2021-2026 ($ million)
- Exhibits34: Chart on Nuclear power plants - Year-over-year growth 2021-2026 (%)
- Exhibits35: Data Table on Nuclear power plants - Year-over-year growth 2021-2026 (%)
- Exhibits36: Chart on Homeland security and defense - Market size and forecast 2021-2026 ($ million)
- Exhibits37: Data Table on Homeland security and defense - Market size and forecast 2021-2026 ($ million)
- Exhibits38: Chart on Homeland security and defense - Year-over-year growth 2021-2026 (%)
- Exhibits39: Data Table on Homeland security and defense - Year-over-year growth 2021-2026 (%)
- Exhibits40: Chart on Industrial applications - Market size and forecast 2021-2026 ($ million)
- Exhibits41: Data Table on Industrial applications - Market size and forecast 2021-2026 ($ million)
- Exhibits42: Chart on Industrial applications - Year-over-year growth 2021-2026 (%)
- Exhibits43: Data Table on Industrial applications - Year-over-year growth 2021-2026 (%)
- Exhibits44: Market opportunity by Application ($ million)
- Exhibits45: Analysis of price sensitivity, lifecycle, customer purchase basket, adoption rates, and purchase criteria
- Exhibits46: Chart on Market share By Geographical Landscape 2021-2026 (%)
- Exhibits47: Data Table on Market share By Geographical Landscape 2021-2026 (%)
- Exhibits48: Chart on Geographic comparison
- Exhibits49: Data Table on Geographic comparison
- Exhibits50: Chart on North America - Market size and forecast 2021-2026 ($ million)
- Exhibits51: Data Table on North America - Market size and forecast 2021-2026 ($ million)
- Exhibits52: Chart on North America - Year-over-year growth 2021-2026 (%)
- Exhibits53: Data Table on North America - Year-over-year growth 2021-2026 (%)
- Exhibits54: Chart on Europe - Market size and forecast 2021-2026 ($ million)
- Exhibits55: Data Table on Europe - Market size and forecast 2021-2026 ($ million)
- Exhibits56: Chart on Europe - Year-over-year growth 2021-2026 (%)
- Exhibits57: Data Table on Europe - Year-over-year growth 2021-2026 (%)
- Exhibits58: Chart on APAC - Market size and forecast 2021-2026 ($ million)
- Exhibits59: Data Table on APAC - Market size and forecast 2021-2026 ($ million)
- Exhibits60: Chart on APAC - Year-over-year growth 2021-2026 (%)
- Exhibits61: Data Table on APAC - Year-over-year growth 2021-2026 (%)
- Exhibits62: Chart on Middle East and Africa - Market size and forecast 2021-2026 ($ million)
- Exhibits63: Data Table on Middle East and Africa - Market size and forecast 2021-2026 ($ million)
- Exhibits64: Chart on Middle East and Africa - Year-over-year growth 2021-2026 (%)
- Exhibits65: Data Table on Middle East and Africa - Year-over-year growth 2021-2026 (%)
- Exhibits66: Chart on South America - Market size and forecast 2021-2026 ($ million)
- Exhibits67: Data Table on South America - Market size and forecast 2021-2026 ($ million)
- Exhibits68: Chart on South America - Year-over-year growth 2021-2026 (%)
- Exhibits69: Data Table on South America - Year-over-year growth 2021-2026 (%)
- Exhibits70: Chart on US - Market size and forecast 2021-2026 ($ million)
- Exhibits71: Data Table on US - Market size and forecast 2021-2026 ($ million)
- Exhibits72: Chart on US - Year-over-year growth 2021-2026 (%)
- Exhibits73: Data Table on US - Year-over-year growth 2021-2026 (%)
- Exhibits74: Chart on China - Market size and forecast 2021-2026 ($ million)
- Exhibits75: Data Table on China - Market size and forecast 2021-2026 ($ million)
- Exhibits76: Chart on China - Year-over-year growth 2021-2026 (%)
- Exhibits77: Data Table on China - Year-over-year growth 2021-2026 (%)
- Exhibits78: Chart on Germany - Market size and forecast 2021-2026 ($ million)
- Exhibits79: Data Table on Germany - Market size and forecast 2021-2026 ($ million)
- Exhibits80: Chart on Germany - Year-over-year growth 2021-2026 (%)
- Exhibits81: Data Table on Germany - Year-over-year growth 2021-2026 (%)
- Exhibits82: Chart on Japan - Market size and forecast 2021-2026 ($ million)
- Exhibits83: Data Table on Japan - Market size and forecast 2021-2026 ($ million)
- Exhibits84: Chart on Japan - Year-over-year growth 2021-2026 (%)
- Exhibits85: Data Table on Japan - Year-over-year growth 2021-2026 (%)
- Exhibits86: Chart on France - Market size and forecast 2021-2026 ($ million)
- Exhibits87: Data Table on France - Market size and forecast 2021-2026 ($ million)
- Exhibits88: Chart on France - Year-over-year growth 2021-2026 (%)
- Exhibits89: Data Table on France - Year-over-year growth 2021-2026 (%)
- Exhibits90: Market opportunity By Geographical Landscape ($ million)
- Exhibits91: Impact of drivers and challenges in 2021 and 2026
- Exhibits92: Overview on Criticality of inputs and Factors of differentiation
- Exhibits93: Overview on factors of disruption
- Exhibits94: Impact of key risks on business
- Exhibits95: Vendors covered
- Exhibits96: Matrix on vendor position and classification
- Exhibits97: Amray Medical - Overview
- Exhibits98: Amray Medical - Product / Service
- Exhibits99: Amray Medical - Key offerings
- Exhibits100: Fuji Electric Co. Ltd. - Overview
- Exhibits101: Fuji Electric Co. Ltd. - Business segments
- Exhibits102: Fuji Electric Co. Ltd. - Key offerings
- Exhibits103: Fuji Electric Co. Ltd. - Segment focus
- Exhibits104: Honeywell International Inc. - Overview
- Exhibits105: Honeywell International Inc. - Business segments
- Exhibits106: Honeywell International Inc. - Key news
- Exhibits107: Honeywell International Inc. - Key offerings
- Exhibits108: Honeywell International Inc. - Segment focus
- Exhibits109: LANDAUER - Overview
- Exhibits110: LANDAUER - Product / Service
- Exhibits111: LANDAUER - Key offerings
- Exhibits112: Ludlum Measurements Inc. - Overview
- Exhibits113: Ludlum Measurements Inc. - Product / Service
- Exhibits114: Ludlum Measurements Inc. - Key offerings
- Exhibits115: Mirion Technologies Inc. - Overview
- Exhibits116: Mirion Technologies Inc. - Product / Service
- Exhibits117: Mirion Technologies Inc. - Key offerings
- Exhibits118: Polimaster LLC - Overview
- Exhibits119: Polimaster LLC - Product / Service
- Exhibits120: Polimaster LLC - Key news
- Exhibits121: Polimaster LLC - Key offerings
- Exhibits122: S.E. International Inc. - Overview
- Exhibits123: S.E. International Inc. - Product / Service
- Exhibits124: S.E. International Inc. - Key offerings
- Exhibits125: Teledyne FLIR LLC - Overview
- Exhibits126: Teledyne FLIR LLC - Business segments
- Exhibits127: Teledyne FLIR LLC - Key offerings
- Exhibits128: Teledyne FLIR LLC - Segment focus
- Exhibits129: Thermo Fisher Scientific Inc. - Overview
- Exhibits130: Thermo Fisher Scientific Inc. - Business segments
- Exhibits131: Thermo Fisher Scientific Inc. - Key news
- Exhibits132: Thermo Fisher Scientific Inc. - Key offerings
- Exhibits133: Thermo Fisher Scientific Inc. - Segment focus
- Exhibits134: Inclusions checklist
- Exhibits135: Exclusions checklist
- Exhibits136: Currency conversion rates for US$
- Exhibits137: Research methodology
- Exhibits138: Validation techniques employed for market sizing
- Exhibits139: Information sources
- Exhibits140: List of abbreviations
Technavio has been monitoring the radiation detection monitoring and safety market and it is poised to grow by $ 1.48 bn during 2022-2026, accelerating at a CAGR of 7.21% during the forecast period. Our report on the radiation detection monitoring and safety market provides a holistic analysis, of market size and forecast, trends, growth drivers, and challenges, as well as vendor analysis covering around 25 vendors.
The report offers an up-to-date analysis of the current global market scenario, the latest trends and drivers, and the overall market environment. The market is driven by increasing military expenditure, increasing demand from the healthcare industry, and regulations mandating the usage of radiation detection, monitoring, and safety.
The radiation detection monitoring and safety market analysis include application segment and geographic landscape.
Technavio's radiation detection monitoring and safety market is segmented as below:
By Application
- Healthcare
- Nuclear power plants
- Homeland security and defense
- Industrial applications
By Geographical Landscape
- North America
- Europe
- APAC
- The Middle East and Africa
- South America
This study identifies the technological advancements in radiation detection as one of the prime reasons driving the radiation detection monitoring and safety market growth during the next few years. Also, technological advancement and increasing investment in smart housing will lead to sizable demand in the market.
- Radiation detection monitoring and safety market sizing
- Radiation detection monitoring and safety market forecast
- Radiation detection monitoring and safety market industry analysis
Technavio's robust vendor analysis is designed to help clients improve their market position, and in line with this, this report provides a detailed analysis of several leading radiation detection monitoring and safety market vendors that include Baker Hughes Co., ECOTEST, Fuji Electric Co. Ltd., Honeywell International Inc., International Medcom Inc., Mirion Technologies Inc., Polimaster LLC, Rapiscan Systems Inc., Teledyne FLIR LLC, Thermo Fisher Scientific Inc., AMETEK Inc, Amray Medical, Arktis Radiation Detectors Ltd, Bar Ray Products Inc., Centronic Ltd, John Caunt Scientific Ltd., LANDAUER, Ludlum Measurements Inc., S.E. International Inc., and Unfors RaySafe AB. Also, the radiation detection monitoring and safety market analysis report includes information on upcoming trends and challenges that will influence market growth. This is to help companies strategize and leverage all future growth opportunities.
The study was conducted using an objective combination of primary and secondary information including inputs from key participants in the industry. The report contains a comprehensive market and vendor landscape in addition to an analysis of the key vendors.
Table of Contents
1 Executive Summary
- 1.1 Market overview
- Exhibit 01: Executive Summary - Chart on Market Overview
- Exhibit 02: Executive Summary - Data Table on Market Overview
- Exhibit 03: Executive Summary - Chart on Global Market Characteristics
- Exhibit 04: Executive Summary - Chart on Market By Geographical Landscape
- Exhibit 05: Executive Summary - Chart on Market Segmentation by Application
- Exhibit 06: Executive Summary - Chart on Incremental Growth
- Exhibit 07: Executive Summary - Data Table on Incremental Growth
- Exhibit 08: Executive Summary - Chart on Vendor Market Positioning
2 Market Landscape
- 2.1 Market ecosystem
- Exhibit 09: Parent market
- Exhibit 10: Market Characteristics
3 Market Sizing
- 3.1 Market definition
- Exhibit 11: Offerings of vendors included in the market definition
- 3.2 Market segment analysis
- Exhibit 12: Market segments
- 3.3 Market size 2021
- 3.4 Market outlook: Forecast for 2021-2026
- Exhibit 13: Chart on Global - Market size and forecast 2021-2026 ($ million)
- Exhibit 14: Data Table on Global - Market size and forecast 2021-2026 ($ million)
- Exhibit 15: Chart on Global Market: Year-over-year growth 2021-2026 (%)
- Exhibit 16: Data Table on Global Market: Year-over-year growth 2021-2026 (%)
4 Five Forces Analysis
- 4.1 Five forces summary
- Exhibit 17: Five forces analysis - Comparison between2021 and 2026
- 4.2 Bargaining power of buyers
- Exhibit 18: Chart on Bargaining power of buyers - Impact of key factors 2021 and 2026
- 4.3 Bargaining power of suppliers
- Exhibit 19: Bargaining power of suppliers - Impact of key factors in 2021 and 2026
- 4.4 Threat of new entrants
- Exhibit 20: Threat of new entrants - Impact of key factors in 2021 and 2026
- 4.5 Threat of substitutes
- Exhibit 21: Threat of substitutes - Impact of key factors in 2021 and 2026
- 4.6 Threat of rivalry
- Exhibit 22: Threat of rivalry - Impact of key factors in 2021 and 2026
- 4.7 Market condition
- Exhibit 23: Chart on Market condition - Five forces 2021 and 2026
5 Market Segmentation by Application
- 5.1 Market segments
- Exhibit 24: Chart on Application - Market share 2021-2026 (%)
- Exhibit 25: Data Table on Application - Market share 2021-2026 (%)
- 5.2 Comparison by Application
- Exhibit 26: Chart on Comparison by Application
- Exhibit 27: Data Table on Comparison by Application
- 5.3 Healthcare - Market size and forecast 2021-2026
- Exhibit 28: Chart on Healthcare - Market size and forecast 2021-2026 ($ million)
- Exhibit 29: Data Table on Healthcare - Market size and forecast 2021-2026 ($ million)
- Exhibit 30: Chart on Healthcare - Year-over-year growth 2021-2026 (%)
- Exhibit 31: Data Table on Healthcare - Year-over-year growth 2021-2026 (%)
- 5.4 Nuclear power plants - Market size and forecast 2021-2026
- Exhibit 32: Chart on Nuclear power plants - Market size and forecast 2021-2026 ($ million)
- Exhibit 33: Data Table on Nuclear power plants - Market size and forecast 2021-2026 ($ million)
- Exhibit 34: Chart on Nuclear power plants - Year-over-year growth 2021-2026 (%)
- Exhibit 35: Data Table on Nuclear power plants - Year-over-year growth 2021-2026 (%)
- 5.5 Homeland security and defense - Market size and forecast 2021-2026
- Exhibit 36: Chart on Homeland security and defense - Market size and forecast 2021-2026 ($ million)
- Exhibit 37: Data Table on Homeland security and defense - Market size and forecast 2021-2026 ($ million)
- Exhibit 38: Chart on Homeland security and defense - Year-over-year growth 2021-2026 (%)
- Exhibit 39: Data Table on Homeland security and defense - Year-over-year growth 2021-2026 (%)
- 5.6 Industrial applications - Market size and forecast 2021-2026
- Exhibit 40: Chart on Industrial applications - Market size and forecast 2021-2026 ($ million)
- Exhibit 41: Data Table on Industrial applications - Market size and forecast 2021-2026 ($ million)
- Exhibit 42: Chart on Industrial applications - Year-over-year growth 2021-2026 (%)
- Exhibit 43: Data Table on Industrial applications - Year-over-year growth 2021-2026 (%)
- 5.7 Market opportunity by Application
- Exhibit 44: Market opportunity by Application ($ million)
6 Customer Landscape
- 6.1 Customer landscape overview
- Exhibit 45: Analysis of price sensitivity, lifecycle, customer purchase basket, adoption rates, and purchase criteria
7 Geographic Landscape
- 7.1 Geographic segmentation
- Exhibit 46: Chart on Market share By Geographical Landscape 2021-2026 (%)
- Exhibit 47: Data Table on Market share By Geographical Landscape 2021-2026 (%)
- 7.2 Geographic comparison
- Exhibit 48: Chart on Geographic comparison
- Exhibit 49: Data Table on Geographic comparison
- 7.3 North America - Market size and forecast 2021-2026
- Exhibit 50: Chart on North America - Market size and forecast 2021-2026 ($ million)
- Exhibit 51: Data Table on North America - Market size and forecast 2021-2026 ($ million)
- Exhibit 52: Chart on North America - Year-over-year growth 2021-2026 (%)
- Exhibit 53: Data Table on North America - Year-over-year growth 2021-2026 (%)
- 7.4 Europe - Market size and forecast 2021-2026
- Exhibit 54: Chart on Europe - Market size and forecast 2021-2026 ($ million)
- Exhibit 55: Data Table on Europe - Market size and forecast 2021-2026 ($ million)
- Exhibit 56: Chart on Europe - Year-over-year growth 2021-2026 (%)
- Exhibit 57: Data Table on Europe - Year-over-year growth 2021-2026 (%)
- 7.5 APAC - Market size and forecast 2021-2026
- Exhibit 58: Chart on APAC - Market size and forecast 2021-2026 ($ million)
- Exhibit 59: Data Table on APAC - Market size and forecast 2021-2026 ($ million)
- Exhibit 60: Chart on APAC - Year-over-year growth 2021-2026 (%)
- Exhibit 61: Data Table on APAC - Year-over-year growth 2021-2026 (%)
- 7.6 Middle East and Africa - Market size and forecast 2021-2026
- Exhibit 62: Chart on Middle East and Africa - Market size and forecast 2021-2026 ($ million)
- Exhibit 63: Data Table on Middle East and Africa - Market size and forecast 2021-2026 ($ million)
- Exhibit 64: Chart on Middle East and Africa - Year-over-year growth 2021-2026 (%)
- Exhibit 65: Data Table on Middle East and Africa - Year-over-year growth 2021-2026 (%)
- 7.7 South America - Market size and forecast 2021-2026
- Exhibit 66: Chart on South America - Market size and forecast 2021-2026 ($ million)
- Exhibit 67: Data Table on South America - Market size and forecast 2021-2026 ($ million)
- Exhibit 68: Chart on South America - Year-over-year growth 2021-2026 (%)
- Exhibit 69: Data Table on South America - Year-over-year growth 2021-2026 (%)
- 7.8 US - Market size and forecast 2021-2026
- Exhibit 70: Chart on US - Market size and forecast 2021-2026 ($ million)
- Exhibit 71: Data Table on US - Market size and forecast 2021-2026 ($ million)
- Exhibit 72: Chart on US - Year-over-year growth 2021-2026 (%)
- Exhibit 73: Data Table on US - Year-over-year growth 2021-2026 (%)
- 7.9 China - Market size and forecast 2021-2026
- Exhibit 74: Chart on China - Market size and forecast 2021-2026 ($ million)
- Exhibit 75: Data Table on China - Market size and forecast 2021-2026 ($ million)
- Exhibit 76: Chart on China - Year-over-year growth 2021-2026 (%)
- Exhibit 77: Data Table on China - Year-over-year growth 2021-2026 (%)
- 7.10 Germany - Market size and forecast 2021-2026
- Exhibit 78: Chart on Germany - Market size and forecast 2021-2026 ($ million)
- Exhibit 79: Data Table on Germany - Market size and forecast 2021-2026 ($ million)
- Exhibit 80: Chart on Germany - Year-over-year growth 2021-2026 (%)
- Exhibit 81: Data Table on Germany - Year-over-year growth 2021-2026 (%)
- 7.11 Japan - Market size and forecast 2021-2026
- Exhibit 82: Chart on Japan - Market size and forecast 2021-2026 ($ million)
- Exhibit 83: Data Table on Japan - Market size and forecast 2021-2026 ($ million)
- Exhibit 84: Chart on Japan - Year-over-year growth 2021-2026 (%)
- Exhibit 85: Data Table on Japan - Year-over-year growth 2021-2026 (%)
- 7.12 France - Market size and forecast 2021-2026
- Exhibit 86: Chart on France - Market size and forecast 2021-2026 ($ million)
- Exhibit 87: Data Table on France - Market size and forecast 2021-2026 ($ million)
- Exhibit 88: Chart on France - Year-over-year growth 2021-2026 (%)
- Exhibit 89: Data Table on France - Year-over-year growth 2021-2026 (%)
- 7.13 Market opportunity By Geographical Landscape
- Exhibit 90: Market opportunity By Geographical Landscape ($ million)
8 Drivers, Challenges, and Trends
- 8.1 Market drivers
- 8.2 Market challenges
- 8.3 Impact of drivers and challenges
- Exhibit 91: Impact of drivers and challenges in 2021 and 2026
- 8.4 Market trends
9 Vendor Landscape
- 9.1 Overview
- 9.2 Vendor landscape
- Exhibit 92: Overview on Criticality of inputs and Factors of differentiation
- 9.3 Landscape disruption
- Exhibit 93: Overview on factors of disruption
- 9.4 Industry risks
- Exhibit 94: Impact of key risks on business
10 Vendor Analysis
- 10.1 Vendors covered
- Exhibit 95: Vendors covered
- 10.2 Market positioning of vendors
- Exhibit 96: Matrix on vendor position and classification
- 10.3 Amray Medical
- Exhibit 97: Amray Medical - Overview
- Exhibit 98: Amray Medical - Product / Service
- Exhibit 99: Amray Medical - Key offerings
- 10.4 Fuji Electric Co. Ltd.
- Exhibit 100: Fuji Electric Co. Ltd. - Overview
- Exhibit 101: Fuji Electric Co. Ltd. - Business segments
- Exhibit 102: Fuji Electric Co. Ltd. - Key offerings
- Exhibit 103: Fuji Electric Co. Ltd. - Segment focus
- 10.5 Honeywell International Inc.
- Exhibit 104: Honeywell International Inc. - Overview
- Exhibit 105: Honeywell International Inc. - Business segments
- Exhibit 106: Honeywell International Inc. - Key news
- Exhibit 107: Honeywell International Inc. - Key offerings
- Exhibit 108: Honeywell International Inc. - Segment focus
- 10.6 LANDAUER
- Exhibit 109: LANDAUER - Overview
- Exhibit 110: LANDAUER - Product / Service
- Exhibit 111: LANDAUER - Key offerings
- 10.7 Ludlum Measurements Inc.
- Exhibit 112: Ludlum Measurements Inc. - Overview
- Exhibit 113: Ludlum Measurements Inc. - Product / Service
- Exhibit 114: Ludlum Measurements Inc. - Key offerings
- 10.8 Mirion Technologies Inc.
- Exhibit 115: Mirion Technologies Inc. - Overview
- Exhibit 116: Mirion Technologies Inc. - Product / Service
- Exhibit 117: Mirion Technologies Inc. - Key offerings
- 10.9 Polimaster LLC
- Exhibit 118: Polimaster LLC - Overview
- Exhibit 119: Polimaster LLC - Product / Service
- Exhibit 120: Polimaster LLC - Key news
- Exhibit 121: Polimaster LLC - Key offerings
- 10.10 S.E. International Inc.
- Exhibit 122: S.E. International Inc. - Overview
- Exhibit 123: S.E. International Inc. - Product / Service
- Exhibit 124: S.E. International Inc. - Key offerings
- 10.11 Teledyne FLIR LLC
- Exhibit 125: Teledyne FLIR LLC - Overview
- Exhibit 126: Teledyne FLIR LLC - Business segments
- Exhibit 127: Teledyne FLIR LLC - Key offerings
- Exhibit 128: Teledyne FLIR LLC - Segment focus
- 10.12 Thermo Fisher Scientific Inc.
- Exhibit 129: Thermo Fisher Scientific Inc. - Overview
- Exhibit 130: Thermo Fisher Scientific Inc. - Business segments
- Exhibit 131: Thermo Fisher Scientific Inc. - Key news
- Exhibit 132: Thermo Fisher Scientific Inc. - Key offerings
- Exhibit 133: Thermo Fisher Scientific Inc. - Segment focus
11 Appendix
- 11.1 Scope of the report
- 11.2 Inclusions and exclusions checklist
- Exhibit 134: Inclusions checklist
- Exhibit 135: Exclusions checklist
- 11.3 Currency conversion rates for US$
- Exhibit 136: Currency conversion rates for US$
- 11.4 Research methodology
- Exhibit 137: Research methodology
- Exhibit 138: Validation techniques employed for market sizing
- Exhibit 139: Information sources
- 11.5 List of abbreviations
- Exhibit 140: List of abbreviations
- adoption of automation in manufacturing the process: The requirement of automation has evolved multifold in the industrial environment. The automation solutions have improved from the implementation of fixed automation to the current flexible and integrated automation, which enables end-users to integrate various processes into a single closed solution. The need to address optimization of processes, extend the level of autonomous processes, continuous monitoring and control of process parameters and safety concerns are driving the implementation of flexible automation solutions in the process and discrete industries.