|
|
市場調査レポート
商品コード
1072842
飼料用種子の英国市場(2022年~2026年)Forage Seed Market in UK 2022-2026 |
||||||
|
|
|||||||
|
● お客様のご希望に応じて、既存データの加工や未掲載情報(例:国別セグメント)の追加などの対応が可能です。 詳細はお問い合わせください。 |
|||||||


| 飼料用種子の英国市場(2022年~2026年) |
|
出版日: 2022年04月30日
発行: TechNavio
ページ情報: 英文 120 Pages
納期: 即納可能
|
- 全表示
- 概要
- 図表
- 目次
英国の飼料用種子の市場規模は、2022年~2026年の間に2億3,265万米ドルの増加が見込まれ、予測期間中に9.09%のCAGRで成長すると予測されています。
当レポートでは、英国の飼料用種子市場について調査分析し、市場規模、予測、動向、成長促進要因、課題、約25社のベンダーを網羅したベンダー分析など、体系的な情報を提供しています。
目次
第1章 エグゼクティブサマリー
- 市場概要
第2章 市場情勢
- 市場のエコシステム
第3章 市場規模
- 市場の定義
- 市場セグメント分析
- 市場規模:2021年
- 市場の見通し:2021年~2026年の予測
第4章 ファイブフォース分析
- ファイブフォースの要約
- 買い手の交渉力
- 供給企業の交渉力
- 新規参入業者の脅威
- 代替品の脅威
- 競合企業の脅威
- 市況
第5章 作物タイプ別の市場セグメンテーション
- 市場セグメント
- 作物タイプ別の比較
- 穀草類:市場規模と予測(2021年~2026年)
- マメ科植物:市場規模と予測(2021年~2026年)
- イネ科植物:市場規模と予測(2021年~2026年)
- 作物タイプ別の市場機会
第6章 製品別の市場セグメンテーション
- 市場セグメント
- 製品別の比較
- 無機:市場規模と予測(2021年~2026年)
- 有機:市場規模と予測(2021年~2026年)
- 製品別の市場機会
第7章 顧客情勢
- 顧客情勢の概要
第8章 促進要因・課題・動向
- 市場促進要因
- 市場の課題
- 促進要因と課題の影響
- 市場動向
第9章 ベンダー情勢
- 概要
- ベンダー情勢
- 混乱情勢
- 業界のリスク
第10章 ベンダー分析
- 対象ベンダー
- ベンダーの市場ポジショニング
- Allied Seed LLC
- Barenbrug UK Ltd.
- BrettYoung
- Central Garden and Pet Co.
- DLF Seeds AS
- Fosters Seed and Feed
- Golden Acre Seeds
- Limagrain UK Ltd.
- PURE SEED
- UPL Ltd.
第11章 付録
Exhibits:
- Exhibits1: Executive Summary - Chart on Market Overview
- Exhibits2: Executive Summary - Data Table on Market Overview
- Exhibits3: Executive Summary - Chart on Country Market Characteristics
- Exhibits4: Executive Summary - Chart on Market Segmentation by Crop Type
- Exhibits5: Executive Summary - Chart on Market Segmentation by Product
- Exhibits6: Executive Summary - Chart on Vendor Market Positioning
- Exhibits7: Parent market
- Exhibits8: Market Characteristics
- Exhibits9: Offerings of vendors included in the market definition
- Exhibits10: Market segments
- Exhibits11: Chart on UK - Market size and forecast 2021-2026 ($ million)
- Exhibits12: Data Table on UK - Market size and forecast 2021-2026 ($ million)
- Exhibits13: Chart on UK: Year-over-year growth 2021-2026 (%)
- Exhibits14: Data Table on UK: Year-over-year growth 2021-2026 (%)
- Exhibits15: Five forces analysis - Comparison between2021 and 2026
- Exhibits16: Chart on Bargaining power of buyers - Impact of key factors 2021 and 2026
- Exhibits17: Bargaining power of suppliers - Impact of key factors in 2021 and 2026
- Exhibits18: Threat of new entrants - Impact of key factors in 2021 and 2026
- Exhibits19: Threat of substitutes - Impact of key factors in 2021 and 2026
- Exhibits20: Threat of rivalry - Impact of key factors in 2021 and 2026
- Exhibits21: Chart on Market condition - Five forces 2021 and 2026
- Exhibits22: Chart on Crop Type - Market share 2021-2026 (%)
- Exhibits23: Data Table on Crop Type - Market share 2021-2026 (%)
- Exhibits24: Chart on Comparison by Crop Type
- Exhibits25: Data Table on Comparison by Crop Type
- Exhibits26: Chart on Cereals - Market size and forecast 2021-2026 ($ million)
- Exhibits27: Data Table on Cereals - Market size and forecast 2021-2026 ($ million)
- Exhibits28: Chart on Cereals - Year-over-year growth 2021-2026 (%)
- Exhibits29: Data Table on Cereals - Year-over-year growth 2021-2026 (%)
- Exhibits30: Chart on Legumes - Market size and forecast 2021-2026 ($ million)
- Exhibits31: Data Table on Legumes - Market size and forecast 2021-2026 ($ million)
- Exhibits32: Chart on Legumes - Year-over-year growth 2021-2026 (%)
- Exhibits33: Data Table on Legumes - Year-over-year growth 2021-2026 (%)
- Exhibits34: Chart on Grasses - Market size and forecast 2021-2026 ($ million)
- Exhibits35: Data Table on Grasses - Market size and forecast 2021-2026 ($ million)
- Exhibits36: Chart on Grasses - Year-over-year growth 2021-2026 (%)
- Exhibits37: Data Table on Grasses - Year-over-year growth 2021-2026 (%)
- Exhibits38: Market opportunity by Crop Type ($ million)
- Exhibits39: Chart on Product - Market share 2021-2026 (%)
- Exhibits40: Data Table on Product - Market share 2021-2026 (%)
- Exhibits41: Chart on Comparison by Product
- Exhibits42: Data Table on Comparison by Product
- Exhibits43: Chart on Inorganic - Market size and forecast 2021-2026 ($ million)
- Exhibits44: Data Table on Inorganic - Market size and forecast 2021-2026 ($ million)
- Exhibits45: Chart on Inorganic - Year-over-year growth 2021-2026 (%)
- Exhibits46: Data Table on Inorganic - Year-over-year growth 2021-2026 (%)
- Exhibits47: Chart on Organic - Market size and forecast 2021-2026 ($ million)
- Exhibits48: Data Table on Organic - Market size and forecast 2021-2026 ($ million)
- Exhibits49: Chart on Organic - Year-over-year growth 2021-2026 (%)
- Exhibits50: Data Table on Organic - Year-over-year growth 2021-2026 (%)
- Exhibits51: Market opportunity by Product ($ million)
- Exhibits52: Analysis of price sensitivity, lifecycle, customer purchase basket, adoption rates, and purchase criteria
- Exhibits53: Impact of drivers and challenges in 2021 and 2026
- Exhibits54: Overview on Criticality of inputs and Factors of differentiation
- Exhibits55: Overview on factors of disruption
- Exhibits56: Impact of key risks on business
- Exhibits57: Vendors covered
- Exhibits58: Matrix on vendor position and classification
- Exhibits59: Allied Seed LLC - Overview
- Exhibits60: Allied Seed LLC - Product / Service
- Exhibits61: Allied Seed LLC - Key offerings
- Exhibits62: Barenbrug UK Ltd. - Overview
- Exhibits63: Barenbrug UK Ltd. - Product / Service
- Exhibits64: Barenbrug UK Ltd. - Key offerings
- Exhibits65: BrettYoung - Overview
- Exhibits66: BrettYoung - Product / Service
- Exhibits67: BrettYoung - Key news
- Exhibits68: BrettYoung - Key offerings
- Exhibits69: Central Garden and Pet Co. - Overview
- Exhibits70: Central Garden and Pet Co. - Business segments
- Exhibits71: Central Garden and Pet Co. - Key offerings
- Exhibits72: Central Garden and Pet Co. - Segment focus
- Exhibits73: DLF Seeds AS - Overview
- Exhibits74: DLF Seeds AS - Business segments
- Exhibits75: DLF Seeds AS - Key offerings
- Exhibits76: DLF Seeds AS - Segment focus
- Exhibits77: Fosters Seed and Feed - Overview
- Exhibits78: Fosters Seed and Feed - Product / Service
- Exhibits79: Fosters Seed and Feed - Key offerings
- Exhibits80: Golden Acre Seeds - Overview
- Exhibits81: Golden Acre Seeds - Product / Service
- Exhibits82: Golden Acre Seeds - Key offerings
- Exhibits83: Limagrain UK Ltd. - Overview
- Exhibits84: Limagrain UK Ltd. - Product / Service
- Exhibits85: Limagrain UK Ltd. - Key offerings
- Exhibits86: PURE SEED - Overview
- Exhibits87: PURE SEED - Product / Service
- Exhibits88: PURE SEED - Key offerings
- Exhibits89: UPL Ltd. - Overview
- Exhibits90: UPL Ltd. - Business segments
- Exhibits91: UPL Ltd. - Key news
- Exhibits92: UPL Ltd. - Key offerings
- Exhibits93: UPL Ltd. - Segment focus
- Exhibits94: Inclusions checklist
- Exhibits95: Exclusions checklist
- Exhibits96: Currency conversion rates for US$
- Exhibits97: Research methodology
- Exhibits98: Validation techniques employed for market sizing
- Exhibits99: Information sources
- Exhibits100: List of abbreviations
Global Forage Seed Market In The UK 2022-2026
Technavio has been monitoring the forage seed market in the UK and it is poised to grow by $ 232.65 mn during 2022-2026, accelerating at a CAGR of 9.09% during the forecast period. Our report on the forage seed market in the UK provides a holistic analysis, market size and forecast, trends, growth drivers, and challenges, as well as vendor analysis covering around 25 vendors.
The report offers an up-to-date analysis of the current country market scenario, the latest trends and drivers, and the overall market environment. The market is driven by growing demand for meat and meat products, increasing demand for nutritional needs in farm animals, and growing consumption of dairy products.
The forage seed market in the UK analysis includes product segment and geographic landscape.
Technavio's forage seed market in the UK is segmented as below:
By Product
- Inorganic
- Organic
This study identifies the growth in popularity of self-propelled forage harvesters as one of the prime reasons driving the forage seed market in the UK growth during the next few years. Also, increasing demand for weed-less feedstock and advances in nutritional sciences for cattle will lead to sizable demand in the market.
Technavio presents a detailed picture of the market by the way of study, synthesis, and summation of data from multiple sources by an analysis of key parameters. Our report on the forage seed market in the UK covers the following areas:
- Forage seed market in the UK sizing
- Forage seed market in the UK forecast
- Forage seed market in the UK industry analysis
Technavio's robust vendor analysis is designed to help clients improve their market position, and in line with this, this report provides a detailed analysis of several leading forage seed market in the UK vendors that include Allied Seed LLC, Ampac Seed Co., Barenbrug UK Ltd., Blue River Organic Seed, BrettYoung, Central Garden and Pet Co., Corteva Inc., DLF Seeds AS, Fosters Seed and Feed, Golden Acre Seeds, Hancock Farm and Seed Co., Imperial Seed Ltd., Land O Lakes Inc., Limagrain UK Ltd., PURE SEED, S and W Seed Co. Australia Pty Ltd., Trevor Cope Seeds Ltd., and UPL Ltd. Also, the forage seed market in the UK analysis report includes information on upcoming trends and challenges that will influence market growth. This is to help companies strategize and leverage all forthcoming growth opportunities.
The study was conducted using an objective combination of primary and secondary information including inputs from key participants in the industry. The report contains a comprehensive market and vendor landscape in addition to an analysis of the key vendors.
Technavio presents a detailed picture of the market by the way of study, synthesis, and summation of data from multiple sources by an analysis of key parameters such as profit, pricing, competition, and promotions. It presents various market facets by identifying the key industry influencers. The data presented is comprehensive, reliable, and a result of extensive research - both primary and secondary. Technavio's market research reports provide a complete competitive landscape and an in-depth vendor selection methodology and analysis using qualitative and quantitative research to forecast accurate market growth.
Table of Contents
1 Executive Summary
- 1.1 Market overview
- Exhibit 01: Executive Summary - Chart on Market Overview
- Exhibit 02: Executive Summary - Data Table on Market Overview
- Exhibit 03: Executive Summary - Chart on Country Market Characteristics
- Exhibit 04: Executive Summary - Chart on Market Segmentation by Crop Type
- Exhibit 05: Executive Summary - Chart on Market Segmentation by Product
- Exhibit 06: Executive Summary - Chart on Vendor Market Positioning
2 Market Landscape
- 2.1 Market ecosystem
- Exhibit 07: Parent market
- Exhibit 08: Market Characteristics
3 Market Sizing
- 3.1 Market definition
- Exhibit 09: Offerings of vendors included in the market definition
- 3.2 Market segment analysis
- Exhibit 10: Market segments
- 3.3 Market size 2021
- 3.4 Market outlook: Forecast for 2021-2026
- Exhibit 11: Chart on UK - Market size and forecast 2021-2026 ($ million)
- Exhibit 12: Data Table on UK - Market size and forecast 2021-2026 ($ million)
- Exhibit 13: Chart on UK: Year-over-year growth 2021-2026 (%)
- Exhibit 14: Data Table on UK: Year-over-year growth 2021-2026 (%)
4 Five Forces Analysis
- 4.1 Five forces summary
- Exhibit 15: Five forces analysis - Comparison between2021 and 2026
- 4.2 Bargaining power of buyers
- Exhibit 16: Chart on Bargaining power of buyers - Impact of key factors 2021 and 2026
- 4.3 Bargaining power of suppliers
- Exhibit 17: Bargaining power of suppliers - Impact of key factors in 2021 and 2026
- 4.4 Threat of new entrants
- Exhibit 18: Threat of new entrants - Impact of key factors in 2021 and 2026
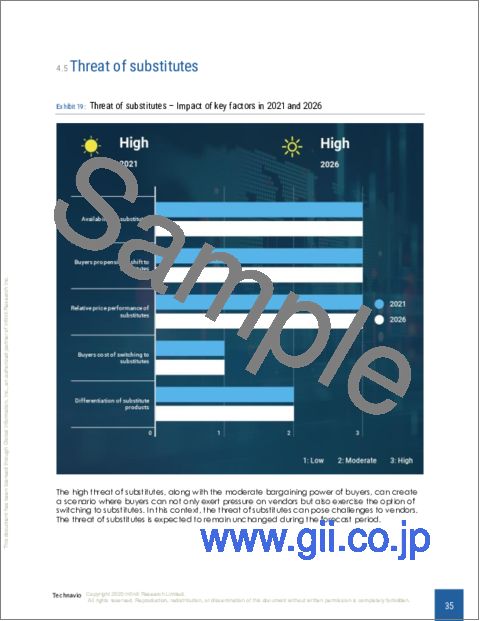
- 4.5 Threat of substitutes
- Exhibit 19: Threat of substitutes - Impact of key factors in 2021 and 2026
- 4.6 Threat of rivalry
- Exhibit 20: Threat of rivalry - Impact of key factors in 2021 and 2026
- 4.7 Market condition
- Exhibit 21: Chart on Market condition - Five forces 2021 and 2026
5 Market Segmentation by Crop Type
- 5.1 Market segments
- Exhibit 22: Chart on Crop Type - Market share 2021-2026 (%)
- Exhibit 23: Data Table on Crop Type - Market share 2021-2026 (%)
- 5.2 Comparison by Crop Type
- Exhibit 24: Chart on Comparison by Crop Type
- Exhibit 25: Data Table on Comparison by Crop Type
- 5.3 Cereals - Market size and forecast 2021-2026
- Exhibit 26: Chart on Cereals - Market size and forecast 2021-2026 ($ million)
- Exhibit 27: Data Table on Cereals - Market size and forecast 2021-2026 ($ million)
- Exhibit 28: Chart on Cereals - Year-over-year growth 2021-2026 (%)
- Exhibit 29: Data Table on Cereals - Year-over-year growth 2021-2026 (%)
- 5.4 Legumes - Market size and forecast 2021-2026
- Exhibit 30: Chart on Legumes - Market size and forecast 2021-2026 ($ million)
- Exhibit 31: Data Table on Legumes - Market size and forecast 2021-2026 ($ million)
- Exhibit 32: Chart on Legumes - Year-over-year growth 2021-2026 (%)
- Exhibit 33: Data Table on Legumes - Year-over-year growth 2021-2026 (%)
- 5.5 Grasses - Market size and forecast 2021-2026
- Exhibit 34: Chart on Grasses - Market size and forecast 2021-2026 ($ million)
- Exhibit 35: Data Table on Grasses - Market size and forecast 2021-2026 ($ million)
- Exhibit 36: Chart on Grasses - Year-over-year growth 2021-2026 (%)
- Exhibit 37: Data Table on Grasses - Year-over-year growth 2021-2026 (%)
- 5.6 Market opportunity by Crop Type
- Exhibit 38: Market opportunity by Crop Type ($ million)
6 Market Segmentation by Product
- 6.1 Market segments
- Exhibit 39: Chart on Product - Market share 2021-2026 (%)
- Exhibit 40: Data Table on Product - Market share 2021-2026 (%)
- 6.2 Comparison by Product
- Exhibit 41: Chart on Comparison by Product
- Exhibit 42: Data Table on Comparison by Product
- 6.3 Inorganic - Market size and forecast 2021-2026
- Exhibit 43: Chart on Inorganic - Market size and forecast 2021-2026 ($ million)
- Exhibit 44: Data Table on Inorganic - Market size and forecast 2021-2026 ($ million)
- Exhibit 45: Chart on Inorganic - Year-over-year growth 2021-2026 (%)
- Exhibit 46: Data Table on Inorganic - Year-over-year growth 2021-2026 (%)
- 6.4 Organic - Market size and forecast 2021-2026
- Exhibit 47: Chart on Organic - Market size and forecast 2021-2026 ($ million)
- Exhibit 48: Data Table on Organic - Market size and forecast 2021-2026 ($ million)
- Exhibit 49: Chart on Organic - Year-over-year growth 2021-2026 (%)
- Exhibit 50: Data Table on Organic - Year-over-year growth 2021-2026 (%)
- 6.5 Market opportunity by Product
- Exhibit 51: Market opportunity by Product ($ million)
7 Customer Landscape
- 7.1 Customer landscape overview
- Exhibit 52: Analysis of price sensitivity, lifecycle, customer purchase basket, adoption rates, and purchase criteria
8 Drivers, Challenges, and Trends
- 8.1 Market drivers
- 8.2 Market challenges
- 8.3 Impact of drivers and challenges
- Exhibit 53: Impact of drivers and challenges in 2021 and 2026
- 8.4 Market trends
9 Vendor Landscape
- 9.1 Overview
- 9.2 Vendor landscape
- Exhibit 54: Overview on Criticality of inputs and Factors of differentiation
- 9.3 Landscape disruption
- Exhibit 55: Overview on factors of disruption
- 9.4 Industry risks
- Exhibit 56: Impact of key risks on business
10 Vendor Analysis
- 10.1 Vendors covered
- Exhibit 57: Vendors covered
- 10.2 Market positioning of vendors
- Exhibit 58: Matrix on vendor position and classification
- 10.3 Allied Seed LLC
- Exhibit 59: Allied Seed LLC - Overview
- Exhibit 60: Allied Seed LLC - Product / Service
- Exhibit 61: Allied Seed LLC - Key offerings
- 10.4 Barenbrug UK Ltd.
- Exhibit 62: Barenbrug UK Ltd. - Overview
- Exhibit 63: Barenbrug UK Ltd. - Product / Service
- Exhibit 64: Barenbrug UK Ltd. - Key offerings
- 10.5 BrettYoung
- Exhibit 65: BrettYoung - Overview
- Exhibit 66: BrettYoung - Product / Service
- Exhibit 67: BrettYoung - Key news
- Exhibit 68: BrettYoung - Key offerings
- 10.6 Central Garden and Pet Co.
- Exhibit 69: Central Garden and Pet Co. - Overview
- Exhibit 70: Central Garden and Pet Co. - Business segments
- Exhibit 71: Central Garden and Pet Co. - Key offerings
- Exhibit 72: Central Garden and Pet Co. - Segment focus
- 10.7 DLF Seeds AS
- Exhibit 73: DLF Seeds AS - Overview
- Exhibit 74: DLF Seeds AS - Business segments
- Exhibit 75: DLF Seeds AS - Key offerings
- Exhibit 76: DLF Seeds AS - Segment focus
- 10.8 Fosters Seed and Feed
- Exhibit 77: Fosters Seed and Feed - Overview
- Exhibit 78: Fosters Seed and Feed - Product / Service
- Exhibit 79: Fosters Seed and Feed - Key offerings
- 10.9 Golden Acre Seeds
- Exhibit 80: Golden Acre Seeds - Overview
- Exhibit 81: Golden Acre Seeds - Product / Service
- Exhibit 82: Golden Acre Seeds - Key offerings
- 10.10 Limagrain UK Ltd.
- Exhibit 83: Limagrain UK Ltd. - Overview
- Exhibit 84: Limagrain UK Ltd. - Product / Service
- Exhibit 85: Limagrain UK Ltd. - Key offerings
- 10.11 PURE SEED
- Exhibit 86: PURE SEED - Overview
- Exhibit 87: PURE SEED - Product / Service
- Exhibit 88: PURE SEED - Key offerings
- 10.12 UPL Ltd.
- Exhibit 89: UPL Ltd. - Overview
- Exhibit 90: UPL Ltd. - Business segments
- Exhibit 91: UPL Ltd. - Key news
- Exhibit 92: UPL Ltd. - Key offerings
- Exhibit 93: UPL Ltd. - Segment focus
11 Appendix
- 11.1 Scope of the report
- 11.2 Inclusions and exclusions checklist
- Exhibit 94: Inclusions checklist
- Exhibit 95: Exclusions checklist
- 11.3 Currency conversion rates for US$
- Exhibit 96: Currency conversion rates for US$
- 11.4 Research methodology
- Exhibit 97: Research methodology
- Exhibit 98: Validation techniques employed for market sizing
- Exhibit 99: Information sources
- 11.5 List of abbreviations
- Exhibit 100: List of abbreviations