|
|
市場調査レポート
商品コード
1072801
ダウンホールツールの世界市場(2022年~2026年)Global Downhole Tools Market 2022-2026 |
||||||
|
|
|||||||
|
● お客様のご希望に応じて、既存データの加工や未掲載情報(例:国別セグメント)の追加などの対応が可能です。 詳細はお問い合わせください。 |
|||||||


| ダウンホールツールの世界市場(2022年~2026年) |
|
出版日: 2022年04月28日
発行: TechNavio
ページ情報: 英文 120 Pages
納期: 即納可能
|
- 全表示
- 概要
- 図表
- 目次
世界のダウンホールツールの市場規模は、予測期間中に5.5%のCAGRで推移し、2022年から2026年の間に113億8,000万米ドルに達すると予測されています。
当レポートでは、世界のダウンホールツール市場を調査し、市場規模・予測、最新動向、促進要因、課題などの情報を提供しています。
目次
第1章 エグゼクティブサマリー
- 市場概要
第2章 市場情勢
- 市場のエコシステム
第3章 市場規模
- 市場定義
- 市場セグメント分析
- 市場規模(2021年)
- 市場の見通し - 予測(2021年~2026年)
第4章 ファイブフォース分析
- ファイブフォースの概要
- 買い手の交渉力
- 供給企業の交渉力
- 新規参入業者の脅威
- 代替品の脅威
- ライバルの脅威
- 市況
第5章 市場セグメンテーション - 用途別
- 市場セグメント
- 比較 - 用途別
- 掘削 - 市場規模と予測(2021年~2026年)
- 坑井介入 - 市場規模と予測(2021年~2026年)
- 仕上げ - 市場規模と予測(2021年~2026年)
- 市場機会 - 用途別
第6章 顧客情勢
- 顧客情勢の概要
- 促進要因または価格感応度、採用ライフサイクル、顧客価格バスケットの重要性、採用率、主要な購入基準を比較した顧客情勢マトリックス
第7章 地理的情勢
- 地理的セグメンテーション
- 地理的比較
- 北米 - 市場規模と予測(2021年~2026年)
- 中東・アフリカ - 市場規模と予測(2021年~2026年)
- アジア太平洋 - 市場規模と予測(2021年~2026年)
- 南米 - 市場規模と予測(2021年~2026年)
- 欧州 - 市場規模と予測(2021年~2026年)
- 米国 - 市場規模と予測(2021年~2026年)
- サウジアラビア - 市場規模と予測(2021年~2026年)
- 中国 - 市場規模と予測(2021年~2026年)
- ロシア - 市場規模と予測(2021年~2026年)
- ブラジル - 市場規模と予測(2021年~2026年)
- 市場機会 - 地理的情勢別
第8章 促進要因、課題、動向
- 市場促進要因
- 非従来型石油・ガス資源の増加
- オフショアフィールド操作の普及
- 新しい油田・製油所の発見
- 市場の課題
- 原油価格の変動
- 再生可能エネルギーへの投資拡大
- 環境リスクと厳格な政府規制
- 促進要因と課題の影響
- 市場動向
- 新世代の自動掘削リグ
- レーザー掘削のイントロダクション
- 深海・超深海掘削プロジェクトの増加
第9章 ベンダー情勢
- 概要
- ベンダー情勢
- 市場情勢の破壊の可能性は2020年には中程度であり、その脅威は2025年まで変わらないと予想される
- 破壊的情勢
- 業界リスク
第10章 ベンダー分析
- 対象ベンダー
- ベンダーの市場ポジショニング
- Archer Ltd.
- Baker Hughes Co.
- Dril Quip Inc.
- General Electric Co.
- Halliburton Co.
- NOV Inc.
図表:
- 図表1:エグゼクティブサマリー - 市場概要のチャート
- 図表2:エグゼクティブサマリー - 市場概要のデータ表
- 図表3:エグゼクティブサマリー - 世界市場の特徴に関するチャート
- 図表4:エグゼクティブサマリー - 市場チャート:地理的情勢別
- 図表5:エグゼクティブサマリー - 市場セグメンテーションに関するチャート:用途別
- 図表6:エグゼクティブサマリー - 増分成長に関するチャート
- 図表7:エグゼクティブサマリー - 増分成長に関するデータ表
- 図表8:エグゼクティブサマリー - ベンダーの市場ポジショニングに関するチャート
- 図表9:親市場
- 図表10:市場の特徴
- 図表11:市場定義に含まれるベンダーの提供
- 図表12:市場セグメント
- 図表13:世界のチャート - 市場規模と予測(2021年~2026年)
- 図表14:世界のデータ表 - 市場規模と予測(2021年~2026年)
- 図表15:世界市場のチャート - 前年比成長率(%)(2021年~2026年)
- 図表16:世界市場のデータ表 - 前年比成長率(%)(2021年~2026年)
- 図表17:ファイブフォース分析 - 比較(2021年と2026年)
- 図表18:買い手の交渉力に関するチャート - 主要な要因の影響(2021年と2026年)
- 図表19:供給企業の交渉力 - 主要な要因の影響(2021年と2026年)
- 図表20:新規参入業者の脅威 - 主要な要因の影響(2021年と2026年)
- 図表21:代替品の脅威 - 主要な要因の影響(2021年と2026年)
- 図表22:ライバルの脅威 - 主要な要因の影響(2021年と2026年)
- 図表23:市況のチャート - ファイブフォース(2021年と2026年)
- 図表24:用途のチャート - 市場シェア(%)(2021年~2026年)
- 図表25:用途のデータ表 - 市場シェア(%)(2021年~2026年)
- 図表26:比較チャート:用途別
- 図表27:比較データ表:用途別
- 図表28:掘削に関するチャート - 市場規模と予測(2021年~2026年)
- 図表29:掘削に関するデータ表 - 市場規模と予測(2021年~2026年)
- 図表30:掘削に関するチャート - 前年比成長率(%)(2021年~2026年)
- 図表31:掘削に関するデータ表 - 前年比成長率(%)(2021年~2026年)
- 図表32:坑井介入に関するチャート - 市場規模と予測(2021年~2026年)
- 図表33:坑井介入に関するデータ表 - 市場規模と予測(2021年~2026年)
- 図表34:坑井介入に関するチャート - 前年比成長率(%)(2021年~2026年)
- 図表35:坑井介入に関するデータ表 - 前年比成長率(%)(2021年~2026年)
- 図表36:仕上げに関するチャート - 市場規模と予測(2021年~2026年)
- 図表37:仕上げに関するデータ表 - 市場規模と予測(2021年~2026年)
- 図表38:仕上げに関するチャート - 前年比成長率(%)(2021年~2026年)
- 図表39:仕上げに関するデータ表 - 前年比成長率(%)(2021年~2026年)
- 図表40:市場機会:用途別
- 図表41:価格感応度、ライフサイクル、顧客購入バスケット、採用率、購入基準の分析
- 図表42:市場シェアのチャート:地理的情勢別(%)(2021年~2026年)
- 図表43:市場シェアのデータ表:地理的情勢別(%)(2021年~2026年)
- 図表44:地理的比較のチャート
- 図表45:地理的比較に関するデータ表
- 図表46:北米のチャート - 市場規模と予測(2021年~2026年)
- 図表47:北米のデータ表 - 市場規模と予測(2021年~2026年)
- 図表48:北米のチャート - 前年比成長率(%)(2021年~2026年)
- 図表49:北米のデータ表 - 前年比成長率(%)(2021年~2026年)
- 図表50:中東・アフリカのチャート - 市場規模と予測(2021年~2026年)
- 図表51:中東・アフリカのデータ表 - 市場規模と予測(2021年~2026年)
- 図表52:中東・アフリカのチャート - 前年比成長率(%)(2021年~2026年)
- 図表53:中東・アフリカのデータ表 - 前年比成長率(%)(2021年~2026年)
- 図表54:欧州のチャート - 市場規模と予測(2021年~2026年)
- 図表55:欧州のデータ表 - 市場規模と予測(2021年~2026年)
- 図表56:欧州のチャート - 前年比成長率(%)(2021年~2026年)
- 図表57:欧州のデータ表 - 前年比成長率(%)(2021年~2026年)
- 図表58:アジア太平洋のチャート - 市場規模と予測(2021年~2026年)
- 図表59:アジア太平洋のデータ表 - 市場規模と予測(2021年~2026年)
- 図表60:アジア太平洋のチャート - 前年比成長率(%)(2021年~2026年)
- 図表61:アジア太平洋のデータ表 - 前年比成長率(%)(2021年~2026年)
- 図表62:南米のチャート - 市場規模と予測(2021年~2026年)
- 図表63:南米のデータ表 - 市場規模と予測(2021年~2026年)
- 図表64:南米のチャート - 前年比成長率(%)(2021年~2026年)
- 図表65:南米のデータ表 - 前年比成長率(%)(2021年~2026年)
- 図表66:米国のチャート - 市場規模と予測(2021年~2026年)
- 図表67:米国のデータ表 - 市場規模と予測(2021年~2026年)
- 図表68:米国のチャート - 前年比成長率(%)(2021年~2026年)
- 図表69:米国のデータ表 - 前年比成長率(%)(2021年~2026年)
- 図表70:サウジアラビアのチャート - 市場規模と予測(2021年~2026年)
- 図表71:サウジアラビアのデータ表 - 市場規模と予測(2021年~2026年)
- 図表72:サウジアラビアのチャート - 前年比成長率(%)(2021年~2026年)
- 図表73:サウジアラビアのデータ表 - 前年比成長率(%)(2021年~2026年)
- 図表74:中国のチャート - 市場規模と予測(2021年~2026年)
- 図表75:中国のデータ表 - 市場規模と予測(2021年~2026年)
- 図表76:中国のチャート - 前年比成長率(%)(2021年~2026年)
- 図表77:中国のデータ表 - 前年比成長率(%)(2021年~2026年)
- 図表78:ロシアのチャート - 市場規模と予測(2021年~2026年)
- 図表79:ロシアのデータ表 - 市場規模と予測(2021年~2026年)
- 図表80:ロシアのチャート - 前年比成長率(%)(2021年~2026年)
- 図表81:ロシアのデータ表 - 前年比成長率(%)(2021年~2026年)
- 図表82:ブラジルのチャート - 市場規模と予測(2021年~2026年)
- 図表83:ブラジルのデータ表 - 市場規模と予測(2021年~2026年)
- 図表84:ブラジルのチャート - 前年比成長率(%)(2021年~2026年)
- 図表85:ブラジルのデータ表 - 前年比成長率(%)(2021年~2026年)
- 図表86:市場機会:地理的情勢別
- 図表87:促進要因と課題の影響(2021年と2026年)
- 図表88:インプットの重要性と差別化の要因に関する概要
- 図表89:混乱の要因の概要
- 図表90:主要リスクがビジネスに与える影響
- 図表91:対象ベンダー
- 図表92:ベンダーポジションと分類に関するマトリックス
- 図表93:Archer Ltd. - 概要
- 図表94:Archer Ltd. - 事業セグメント
- 図表95:Archer Ltd. - 主な製品
- 図表96:Archer Ltd. - セグメントフォーカス
- 図表97:Baker Hughes Co. - 概要
- 図表98:Baker Hughes Co. - 事業セグメント
- 図表99:Baker Hughes Co. - 重要なニュース
- 図表100:Baker Hughes Co. - 主な製品
- 図表101:Baker Hughes Co. - セグメントフォーカス
- 図表102:Dril Quip Inc. - 概要
- 図表103:Dril Quip Inc. - 事業セグメント
- 図表104:Dril Quip Inc. - 主な製品
- 図表105:Dril Quip Inc. - セグメントフォーカス
- 図表106:General Electric Co. - 概要
- 図表107:General Electric Co. - 事業セグメント
- 図表108:General Electric Co. - 重要なニュース
- 図表109:General Electric Co. - 主な製品
- 図表110:General Electric Co. - セグメントフォーカス
- 図表111:Halliburton Co. - 概要
- 図表112:Halliburton Co. - 製品/サービス
- 図表113:Halliburton Co. - 重要なニュース
- 図表114:Halliburton Co. - 主な製品
- 図表115: NOV Inc. - 概要
- 図表116: NOV Inc. - 事業セグメント
- 図表117: NOV Inc. - 重要なニュース
- 図表118: NOV Inc. - 主な製品
- 図表119: NOV Inc. - セグメントフォーカス
- 図表120:Schlumberger Ltd. - 概要
- 図表121:Schlumberger Ltd. - 事業セグメント
- 図表122:Schlumberger Ltd. - 主な製品
- 図表123:Schlumberger Ltd. - セグメントフォーカス
- 図表124:Schoeller Bleckmann Oilfield Equipment AG - 概要
- 図表125:Schoeller Bleckmann Oilfield Equipment AG - 事業セグメント
- 図表126:Schoeller Bleckmann Oilfield Equipment AG - 主な製品
- 図表127:Schoeller Bleckmann Oilfield Equipment AG - セグメントフォーカス
- 図表128:Superior Energy Services Inc. - 概要
- 図表129:Superior Energy Services Inc. - 事業セグメント
- 図表130:Superior Energy Services Inc. - 主な製品
- 図表131:Superior Energy Services Inc. - セグメントフォーカス
- 図表132:Weatherford International Plc - 概要
- 図表133:Weatherford International Plc - 事業セグメント
- 図表134:Weatherford International Plc - 主な製品
- 図表135:Weatherford International Plc - セグメントフォーカス
- 図表136:包含チェックリスト
- 図表137:除外チェックリスト
- 図表138:米ドルの為替レート
- 図表139:調査手法
- 図表140:市場のサイジングに採用された検証手法
- 図表141:情報源
- 図表142:略語のリスト
Exhibits:
- Exhibits1: Executive Summary - Chart on Market Overview
- Exhibits2: Executive Summary - Data Table on Market Overview
- Exhibits3: Executive Summary - Chart on Global Market Characteristics
- Exhibits4: Executive Summary - Chart on Market By Geographical Landscape
- Exhibits5: Executive Summary - Chart on Market Segmentation by Application
- Exhibits6: Executive Summary - Chart on Incremental Growth
- Exhibits7: Executive Summary - Data Table on Incremental Growth
- Exhibits8: Executive Summary - Chart on Vendor Market Positioning
- Exhibits9: Parent market
- Exhibits10: Market Characteristics
- Exhibits11: Offerings of vendors included in the market definition
- Exhibits12: Market segments
- Exhibits13: Chart on Global - Market size and forecast 2021-2026 ($ billion)
- Exhibits14: Data Table on Global - Market size and forecast 2021-2026 ($ billion)
- Exhibits15: Chart on Global Market: Year-over-year growth 2021-2026 (%)
- Exhibits16: Data Table on Global Market: Year-over-year growth 2021-2026 (%)
- Exhibits17: Five forces analysis - Comparison between2021 and 2026
- Exhibits18: Chart on Bargaining power of buyers - Impact of key factors 2021 and 2026
- Exhibits19: Bargaining power of suppliers - Impact of key factors in 2021 and 2026
- Exhibits20: Threat of new entrants - Impact of key factors in 2021 and 2026
- Exhibits21: Threat of substitutes - Impact of key factors in 2021 and 2026
- Exhibits22: Threat of rivalry - Impact of key factors in 2021 and 2026
- Exhibits23: Chart on Market condition - Five forces 2021 and 2026
- Exhibits24: Chart on Application - Market share 2021-2026 (%)
- Exhibits25: Data Table on Application - Market share 2021-2026 (%)
- Exhibits26: Chart on Comparison by Application
- Exhibits27: Data Table on Comparison by Application
- Exhibits28: Chart on Drilling - Market size and forecast 2021-2026 ($ billion)
- Exhibits29: Data Table on Drilling - Market size and forecast 2021-2026 ($ billion)
- Exhibits30: Chart on Drilling - Year-over-year growth 2021-2026 (%)
- Exhibits31: Data Table on Drilling - Year-over-year growth 2021-2026 (%)
- Exhibits32: Chart on Well intervention - Market size and forecast 2021-2026 ($ billion)
- Exhibits33: Data Table on Well intervention - Market size and forecast 2021-2026 ($ billion)
- Exhibits34: Chart on Well intervention - Year-over-year growth 2021-2026 (%)
- Exhibits35: Data Table on Well intervention - Year-over-year growth 2021-2026 (%)
- Exhibits36: Chart on Completion - Market size and forecast 2021-2026 ($ billion)
- Exhibits37: Data Table on Completion - Market size and forecast 2021-2026 ($ billion)
- Exhibits38: Chart on Completion - Year-over-year growth 2021-2026 (%)
- Exhibits39: Data Table on Completion - Year-over-year growth 2021-2026 (%)
- Exhibits40: Market opportunity by Application ($ billion)
- Exhibits41: Analysis of price sensitivity, lifecycle, customer purchase basket, adoption rates, and purchase criteria
- Exhibits42: Chart on Market share By Geographical Landscape 2021-2026 (%)
- Exhibits43: Data Table on Market share By Geographical Landscape 2021-2026 (%)
- Exhibits44: Chart on Geographic comparison
- Exhibits45: Data Table on Geographic comparison
- Exhibits46: Chart on North America - Market size and forecast 2021-2026 ($ billion)
- Exhibits47: Data Table on North America - Market size and forecast 2021-2026 ($ billion)
- Exhibits48: Chart on North America - Year-over-year growth 2021-2026 (%)
- Exhibits49: Data Table on North America - Year-over-year growth 2021-2026 (%)
- Exhibits50: Chart on Middle East and Africa - Market size and forecast 2021-2026 ($ billion)
- Exhibits51: Data Table on Middle East and Africa - Market size and forecast 2021-2026 ($ billion)
- Exhibits52: Chart on Middle East and Africa - Year-over-year growth 2021-2026 (%)
- Exhibits53: Data Table on Middle East and Africa - Year-over-year growth 2021-2026 (%)
- Exhibits54: Chart on Europe - Market size and forecast 2021-2026 ($ billion)
- Exhibits55: Data Table on Europe - Market size and forecast 2021-2026 ($ billion)
- Exhibits56: Chart on Europe - Year-over-year growth 2021-2026 (%)
- Exhibits57: Data Table on Europe - Year-over-year growth 2021-2026 (%)
- Exhibits58: Chart on APAC - Market size and forecast 2021-2026 ($ billion)
- Exhibits59: Data Table on APAC - Market size and forecast 2021-2026 ($ billion)
- Exhibits60: Chart on APAC - Year-over-year growth 2021-2026 (%)
- Exhibits61: Data Table on APAC - Year-over-year growth 2021-2026 (%)
- Exhibits62: Chart on South America - Market size and forecast 2021-2026 ($ billion)
- Exhibits63: Data Table on South America - Market size and forecast 2021-2026 ($ billion)
- Exhibits64: Chart on South America - Year-over-year growth 2021-2026 (%)
- Exhibits65: Data Table on South America - Year-over-year growth 2021-2026 (%)
- Exhibits66: Chart on US - Market size and forecast 2021-2026 ($ billion)
- Exhibits67: Data Table on US - Market size and forecast 2021-2026 ($ billion)
- Exhibits68: Chart on US - Year-over-year growth 2021-2026 (%)
- Exhibits69: Data Table on US - Year-over-year growth 2021-2026 (%)
- Exhibits70: Chart on Saudi Arabia - Market size and forecast 2021-2026 ($ billion)
- Exhibits71: Data Table on Saudi Arabia - Market size and forecast 2021-2026 ($ billion)
- Exhibits72: Chart on Saudi Arabia - Year-over-year growth 2021-2026 (%)
- Exhibits73: Data Table on Saudi Arabia - Year-over-year growth 2021-2026 (%)
- Exhibits74: Chart on China - Market size and forecast 2021-2026 ($ billion)
- Exhibits75: Data Table on China - Market size and forecast 2021-2026 ($ billion)
- Exhibits76: Chart on China - Year-over-year growth 2021-2026 (%)
- Exhibits77: Data Table on China - Year-over-year growth 2021-2026 (%)
- Exhibits78: Chart on Russia - Market size and forecast 2021-2026 ($ billion)
- Exhibits79: Data Table on Russia - Market size and forecast 2021-2026 ($ billion)
- Exhibits80: Chart on Russia - Year-over-year growth 2021-2026 (%)
- Exhibits81: Data Table on Russia - Year-over-year growth 2021-2026 (%)
- Exhibits82: Chart on Brazil - Market size and forecast 2021-2026 ($ billion)
- Exhibits83: Data Table on Brazil - Market size and forecast 2021-2026 ($ billion)
- Exhibits84: Chart on Brazil - Year-over-year growth 2021-2026 (%)
- Exhibits85: Data Table on Brazil - Year-over-year growth 2021-2026 (%)
- Exhibits86: Market opportunity By Geographical Landscape ($ billion)
- Exhibits87: Impact of drivers and challenges in 2021 and 2026
- Exhibits88: Overview on Criticality of inputs and Factors of differentiation
- Exhibits89: Overview on factors of disruption
- Exhibits90: Impact of key risks on business
- Exhibits91: Vendors covered
- Exhibits92: Matrix on vendor position and classification
- Exhibits93: Archer Ltd. - Overview
- Exhibits94: Archer Ltd. - Business segments
- Exhibits95: Archer Ltd. - Key offerings
- Exhibits96: Archer Ltd. - Segment focus
- Exhibits97: Baker Hughes Co. - Overview
- Exhibits98: Baker Hughes Co. - Business segments
- Exhibits99: Baker Hughes Co. - Key news
- Exhibits100: Baker Hughes Co. - Key offerings
- Exhibits101: Baker Hughes Co. - Segment focus
- Exhibits102: Dril Quip Inc. - Overview
- Exhibits103: Dril Quip Inc. - Business segments
- Exhibits104: Dril Quip Inc. - Key offerings
- Exhibits105: Dril Quip Inc. - Segment focus
- Exhibits106: General Electric Co. - Overview
- Exhibits107: General Electric Co. - Business segments
- Exhibits108: General Electric Co. - Key news
- Exhibits109: General Electric Co. - Key offerings
- Exhibits110: General Electric Co. - Segment focus
- Exhibits111: Halliburton Co. - Overview
- Exhibits112: Halliburton Co. - Product / Service
- Exhibits113: Halliburton Co. - Key news
- Exhibits114: Halliburton Co. - Key offerings
- Exhibits115: NOV Inc. - Overview
- Exhibits116: NOV Inc. - Business segments
- Exhibits117: NOV Inc. - Key news
- Exhibits118: NOV Inc. - Key offerings
- Exhibits119: NOV Inc. - Segment focus
- Exhibits120: Schlumberger Ltd. - Overview
- Exhibits121: Schlumberger Ltd. - Business segments
- Exhibits122: Schlumberger Ltd. - Key offerings
- Exhibits123: Schlumberger Ltd. - Segment focus
- Exhibits124: Schoeller Bleckmann Oilfield Equipment AG - Overview
- Exhibits125: Schoeller Bleckmann Oilfield Equipment AG - Business segments
- Exhibits126: Schoeller Bleckmann Oilfield Equipment AG - Key offerings
- Exhibits127: Schoeller Bleckmann Oilfield Equipment AG - Segment focus
- Exhibits128: Superior Energy Services Inc. - Overview
- Exhibits129: Superior Energy Services Inc. - Business segments
- Exhibits130: Superior Energy Services Inc. - Key offerings
- Exhibits131: Superior Energy Services Inc. - Segment focus
- Exhibits132: Weatherford International Plc - Overview
- Exhibits133: Weatherford International Plc - Business segments
- Exhibits134: Weatherford International Plc - Key offerings
- Exhibits135: Weatherford International Plc - Segment focus
- Exhibits136: Inclusions checklist
- Exhibits137: Exclusions checklist
- Exhibits138: Currency conversion rates for US$
- Exhibits139: Research methodology
- Exhibits140: Validation techniques employed for market sizing
- Exhibits141: Information sources
- Exhibits142: List of abbreviations
Technavio has been monitoring the downhole tools market and it is poised to grow by $ 11.38 bn during 2022-2026, accelerating at a CAGR of 5.5% during the forecast period. Our report on the downhole tools market provides a holistic analysis, market size and forecast, trends, growth drivers, and challenges, as well as vendor analysis covering around 25 vendors.
The report offers an up-to-date analysis of the current global market scenario, the latest trends and drivers, and the overall market environment. The market is driven by rising in unconventional oil and gas resources, the growing popularity of offshore field operations, and the discovery of new oilfields and refineries.
The downhole tools market analysis includes application segment and geographic landscape.
Technavio's downhole tools market is segmented as below:
By Application
- Drilling
- Well intervention
- Completion
By Geographical Landscape
- North America
- The Middle East and Africa
- Europe
- APAC
- South America
This study identifies the new-generation automated drilling rigs as one of the prime reasons driving the downhole tools market growth during the next few years. Also, the introduction of laser drilling and the rise in deep and ultra-deepwater drilling projects will lead to sizable demand in the market.
Technavio presents a detailed picture of the market by the way of study, synthesis, and summation of data from multiple sources by an analysis of key parameters. Our report on the downhole tools market covers the following areas:
- Downhole tools market sizing
- Downhole tools market forecast
- Downhole tools market industry analysis
Technavio's robust vendor analysis is designed to help clients improve their market position, and in line with this, this report provides a detailed analysis of several leading downhole tools market vendors that include Aker Solutions ASA, AKITA Drilling Ltd., American Oilfield Tools Inc., Archer Ltd., Baker Hughes Co., Dril Quip Inc., General Electric Co., Halliburton Co., Hunting Plc, Innovex, NexTier Oilfield Solutions Inc., Nine Energy Service Inc., NOV Inc., Schlumberger Ltd., Schoeller Bleckmann Oilfield Equipment AG, Superior Energy Services Inc., Tasman Oil Tools Ltd., The Weir Group Plc, Tryton Tool Services, and Weatherford International Plc. Also, the downhole tools market analysis report includes information on upcoming trends and challenges that will influence market growth. This is to help companies strategize and leverage all forthcoming growth opportunities.
The study was conducted using an objective combination of primary and secondary information including inputs from key participants in the industry. The report contains a comprehensive market and vendor landscape in addition to an analysis of the key vendors.
Technavio presents a detailed picture of the market by the way of study, synthesis, and summation of data from multiple sources by an analysis of key parameters such as profit, pricing, competition, and promotions. It presents various market facets by identifying the key industry influencers. The data presented is comprehensive, reliable, and a result of extensive research - both primary and secondary. Technavio's market research reports provide a complete competitive landscape and an in-depth vendor selection methodology and analysis using qualitative and quantitative research to forecast accurate market growth.
Table of Contents
1. Executive Summary
- 1.1 Market Overview
- Exhibit 01: Executive Summary - Chart on Market Overview
- Exhibit 02: Executive Summary - Data Table on Market Overview
- Exhibit 03: Executive Summary - Chart on Global Market Characteristics
- Exhibit 04: Executive Summary - Chart on Market By Geographical Landscape
- Exhibit 05: Executive Summary - Chart on Market Segmentation by Application
- Exhibit 06: Executive Summary - Chart on Incremental Growth
- Exhibit 07: Executive Summary - Data Table on Incremental Growth
- Exhibit 08: Executive Summary - Chart on Vendor Market Positioning
2. Market Landscape
- 2.1 Market ecosystem
- Exhibit 09: Parent market
- Exhibit 10: Market characteristics
3. Market Sizing
- 3.1 Market definition
- Exhibit 11: Offerings of vendors included in the market definition
- 3.2 Market segment analysis
- Exhibit 12: Market segments
- 3.3 Market size 2021
- 3.4 Market outlook: Forecast for 2021 - 2026
- Exhibit 13: Chart on Global - Market size and forecast 2021-2026 ($ billion)
- Exhibit 14: Data Table on Global - Market size and forecast 2021-2026 ($ billion)
- Exhibit 15: Chart on Global Market: Year-over-year growth 2021-2026 (%)
- Exhibit 16: Data Table on Global Market: Year-over-year growth 2021-2026 (%)
4. Five Forces Analysis
- 4.1 Five Forces Summary
- Exhibit 17: Five forces analysis - Comparison between 2021 and 2026
- 4.2 Bargaining power of buyers
- Exhibit 18: Bargaining power of buyers - Impact of key factors in 2021 and 2026
- 4.3 Bargaining power of suppliers
- Exhibit 19: Bargaining power of suppliers - Impact of key factors in 2021 and 2026
- 4.4 Threat of new entrants
- Exhibit 20: Threat of new entrants - Impact of key factors in 2021 and 2026
- 4.5 Threat of substitutes
- Exhibit 21: Threat of substitutes - Impact of key factors in 2021 and 2026
- 4.6 Threat of rivalry
- Exhibit 22: Threat of rivalry - Impact of key factors in 2021 and 2026
- 4.7 Market condition
- Exhibit 23: Chart on Market condition - Five forces 2021 and 2026
5 Market Segmentation by Application
- 5.1 Market segments
- Exhibit 24: Chart on Application - Market share 2021-2026 (%)
- Exhibit 25: Data Table on Application - Market share 2021-2026 (%)
- 5.2 Comparison by Application
- Exhibit 26: Chart on Comparison by Application
- Exhibit 27: Data Table on Comparison by Application
- 5.3 Drilling - Market size and forecast 2021-2026
- Exhibit 28: Chart on Drilling - Market size and forecast 2021-2026 ($ billion)
- Exhibit 29: Data Table on Drilling - Market size and forecast 2021-2026 ($ billion)
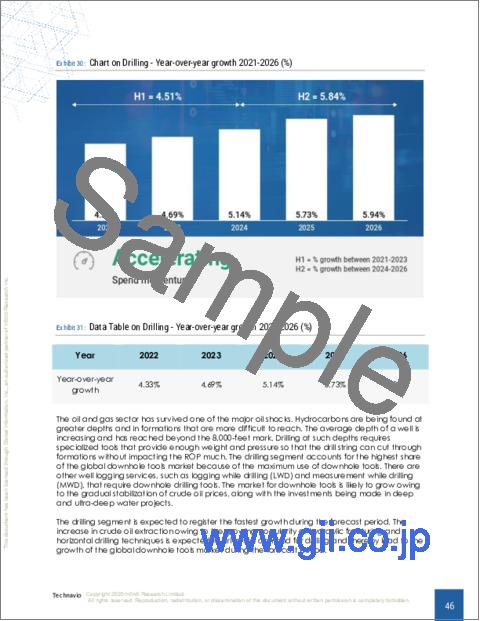
- Exhibit 30: Chart on Drilling - Year-over-year growth 2021-2026 (%)
- Exhibit 31: Data Table on Drilling - Year-over-year growth 2021-2026 (%)
- 5.4 Well intervention - Market size and forecast 2021-2026
- Exhibit 32: Chart on Well intervention - Market size and forecast 2021-2026 ($ billion)
- Exhibit 33: Data Table on Well intervention - Market size and forecast 2021-2026 ($ billion)
- Exhibit 34: Chart on Well intervention - Year-over-year growth 2021-2026 (%)
- Exhibit 35: Data Table on Well intervention - Year-over-year growth 2021-2026 (%)
- 5.5 Completion - Market size and forecast 2021-2026
- Exhibit 36: Chart on Completion - Market size and forecast 2021-2026 ($ billion)
- Exhibit 37: Data Table on Completion - Market size and forecast 2021-2026 ($ billion)
- Exhibit 38: Chart on Completion - Year-over-year growth 2021-2026 (%)
- Exhibit 39: Data Table on Completion - Year-over-year growth 2021-2026 (%)
- 5.6 Market opportunity by Application
- Exhibit 40: Market opportunity by Application ($ billion)
6. Customer landscape
- 6.1 Customer landscape overview
- Technavio's customer landscape matrix comparing Drivers or price sensitivity, Adoption lifecycle, importance in customer price basket, Adoption rate and Key purchase criteria
- Exhibit 41: Analysis of price sensitivity, lifecycle, customer purchase basket, adoption rates, and purchase criteria
7. Geographic Landscape
- 7.1 Geographic segmentation
- Exhibit 42: Chart on Market share By Geographical Landscape 2021-2026 (%)
- Exhibit 43: Data Table on Market share By Geographical Landscape 2021-2026 (%)
- 7.2 Geographic comparison
- Exhibit 44: Chart on Geographic comparison
- Exhibit 45: Data Table on Geographic comparison
- 7.6 North America - Market size and forecast 2021-2026
- Exhibit 46: Chart on North America - Market size and forecast 2021-2026 ($ billion)
- Exhibit 47: Data Table on North America - Market size and forecast 2021-2026 ($ billion)
- Exhibit 48: Chart on North America - Year-over-year growth 2021-2026 (%)
- Exhibit 49: Data Table on North America - Year-over-year growth 2021-2026 (%)
- 7.5 Middle East and Africa - Market size and forecast 2021-2026
- Exhibit 50: Chart on Middle East and Africa - Market size and forecast 2021-2026 ($ billion)
- Exhibit 51: Data Table on Middle East and Africa - Market size and forecast 2021-2026 ($ billion)
- Exhibit 52: Chart on Middle East and Africa - Year-over-year growth 2021-2026 (%)
- Exhibit 53: Data Table on Middle East and Africa - Year-over-year growth 2021-2026 (%)
- 7.3 APAC - Market size and forecast 2021-2026
- Exhibit 54: Chart on APAC - Market size and forecast 2021-2026 ($ billion)
- Exhibit 55: Data Table on APAC - Market size and forecast 2021-2026 ($ billion)
- Exhibit 56: Chart on APAC - Year-over-year growth 2021-2026 (%)
- Exhibit 57: Data Table on APAC - Year-over-year growth 2021-2026 (%)
- 7.4 South America - Market size and forecast 2021-2026
- Exhibit 58: Chart on South America - Market size and forecast 2021-2026 ($ billion)
- Exhibit 59: Data Table on South America - Market size and forecast 2021-2026 ($ billion)
- Exhibit 60: Chart on South America - Year-over-year growth 2021-2026 (%)
- Exhibit 61: Data Table on South America - Year-over-year growth 2021-2026 (%)
- 7.7 Europe - Market size and forecast 2021-2026
- Exhibit 62: Chart on Europe - Market size and forecast 2021-2026 ($ billion)
- Exhibit 63: Data Table on Europe - Market size and forecast 2021-2026 ($ billion)
- Exhibit 64: Chart on Europe - Year-over-year growth 2021-2026 (%)
- Exhibit 65: Data Table on Europe - Year-over-year growth 2021-2026 (%)
- 7.8 US - Market size and forecast 2021-2026
- Exhibit 66: Chart on US - Market size and forecast 2021-2026 ($ billion)
- Exhibit 67: Data Table on US - Market size and forecast 2021-2026 ($ billion)
- Exhibit 68: Chart on US - Year-over-year growth 2021-2026 (%)
- Exhibit 69: Data Table on US - Year-over-year growth 2021-2026 (%)
- 7.9 Saudi Arabia - Market size and forecast 2021-2026
- Exhibit 70: Chart on Saudi Arabia - Market size and forecast 2021-2026 ($ billion)
- Exhibit 71: Data Table on Saudi Arabia - Market size and forecast 2021-2026 ($ billion)
- Exhibit 72: Chart on Saudi Arabia - Year-over-year growth 2021-2026 (%)
- Exhibit 73: Data Table on Saudi Arabia - Year-over-year growth 2021-2026 (%)
- 7.10 China - Market size and forecast 2021-2026
- Exhibit 74: Chart on China - Market size and forecast 2021-2026 ($ billion)
- Exhibit 75: Data Table on China - Market size and forecast 2021-2026 ($ billion)
- Exhibit 76: Chart on China - Year-over-year growth 2021-2026 (%)
- Exhibit 77: Data Table on China - Year-over-year growth 2021-2026 (%)
- 7.11 Russia - Market size and forecast 2021-2026
- Exhibit 78: Chart on Russia - Market size and forecast 2021-2026 ($ billion)
- Exhibit 79: Data Table on Russia - Market size and forecast 2021-2026 ($ billion)
- Exhibit 80: Chart on Russia - Year-over-year growth 2021-2026 (%)
- Exhibit 81: Data Table on Russia - Year-over-year growth 2021-2026 (%)
- 7.12 Brazil - Market size and forecast 2021-2026
- Exhibit 82: Chart on Brazil - Market size and forecast 2021-2026 ($ billion)
- Exhibit 83: Data Table on Brazil - Market size and forecast 2021-2026 ($ billion)
- Exhibit 84: Chart on Brazil - Year-over-year growth 2021-2026 (%)
- Exhibit 85: Data Table on Brazil - Year-over-year growth 2021-2026 (%)
- 7.13 Market opportunity By Geographical Landscape
- Exhibit 86: Market opportunity By Geographical Landscape ($ billion)
8. Drivers, Challenges, and Trends
- 8.1 Market drivers
- 8.1.1 Rise in unconventional oil and gas resources
- 8.1.2 Growing popularity of offshore field operations
- 8.1.3 Discovery of new oilfields and refineries
- 8.2 Market challenges
- 8.2.1 Volatility in crude oil prices
- 8.2.2 Increasing investments in renewable energy
- 8.2.3 Environmental risks and strict government regulations
- 8.3 Impact of drivers and challenges
- Exhibit 87: Impact of drivers and challenges in 2021 and 2026
- 8.4 Market trends
- 8.4.1 New-generation automated drilling rigs
- 8.4.2 Introduction of laser drilling
- 8.4.3 Rise in deep and ultra-deepwater drilling projects
9. Vendor Landscape
- 9.1 Overview
- 9.2 Vendor landscape
- Exhibit 88: Overview on Criticality of inputs and Factors of differentiation
- The potential for the disruption of the market landscape was moderate in 2020, and its threat is expected to remain unchanged by 2025.
- 9.3 Landscape disruption
- Exhibit 89: Overview on factors of disruption
- 9.4 Industry risks
- Exhibit 90: Impact of key risks on business
10. Vendor Analysis
- 10.1 Vendors covered
- Exhibit 91: Vendors covered
- 10.2 Market positioning of vendors
- Exhibit 92: Matrix on vendor position and classification
- 10.3 Archer Ltd.
- Exhibit 93: Archer Ltd. - Overview
- Exhibit 94: Archer Ltd. - Business segments
- Exhibit 95: Archer Ltd. - Key offerings
- Exhibit 96: Archer Ltd. - Segment focus
- 10.4 Baker Hughes Co.
- Exhibit 97: Baker Hughes Co. - Overview
- Exhibit 98: Baker Hughes Co. - Business segments
- Exhibit 99: Baker Hughes Co. - Key news
- Exhibit 100: Baker Hughes Co. - Key offerings
- Exhibit 101: Baker Hughes Co. - Segment focus
- 10.5 Dril Quip Inc.
- Exhibit 102: Dril Quip Inc. - Overview
- Exhibit 103: Dril Quip Inc. - Business segments
- Exhibit 104: Dril Quip Inc. - Key offerings
- Exhibit 105: Dril Quip Inc. - Segment focus
- 10.6 General Electric Co.
- Exhibit 106: General Electric Co. - Overview
- Exhibit 107: General Electric Co. - Business segments
- Exhibit 108: General Electric Co. - Key news
- Exhibit 109: General Electric Co. - Key offerings
- Exhibit 110: General Electric Co. - Segment focus
- 10.7 Halliburton Co.
- Exhibit 111: Halliburton Co. - Overview
- Exhibit 112: Halliburton Co. - Product / Service
- Exhibit 113: Halliburton Co. - Key news
- Exhibit 114: Halliburton Co. - Key offerings
- 10.8 NOV Inc.
- Exhibit 115: NOV Inc. - Overview