|
|
市場調査レポート
商品コード
1071953
農業用検査の世界市場(2022年~2026年)Global Agricultural Testing Market 2022-2026 |
||||||
|
|
|||||||
|
● お客様のご希望に応じて、既存データの加工や未掲載情報(例:国別セグメント)の追加などの対応が可能です。 詳細はお問い合わせください。 |
|||||||


| 農業用検査の世界市場(2022年~2026年) |
|
出版日: 2022年04月21日
発行: TechNavio
ページ情報: 英文 120 Pages
納期: 即納可能
|
- 全表示
- 概要
- 図表
- 目次
世界の農業用検査の市場規模は、2022年~2026年の間に21億米ドルの増加が見込まれ、予測期間中に6.25%のCAGRで成長が予測されています。
市場を牽引しているのは、土壌汚染や水質汚染の著しい増加、農業用部品の改善への取り組み、農業用部品の安全性や品質に関する厳しい規制などです。
当レポートでは、世界の農業用検査市場について調査分析し、全体的な分析、市場規模と予測、動向、成長促進要因、課題のほか、約25社のベンダーを対象としたベンダー分析を提供しています。
目次
第1章 エグゼクティブサマリー
- 市場概要
第2章 市場情勢
- 市場のエコシステム
第3章 市場規模
- 市場の定義
- 市場セグメント分析
- 市場規模(2021年)
- 市場の見通し:2021年~2026年の予測
第4章 ファイブフォース分析
- ファイブフォースの概要
- 買い手の交渉力
- 供給企業の交渉力
- 新規参入業者の脅威
- 代替品の脅威
- ライバル関係の脅威
- 市況
第5章 市場セグメンテーション:用途別
- 市場セグメント
- 用途別の比較
- 土壌試験:市場規模と予測(2021年~2026年)
- 水質検査:市場規模と予測(2021年~2026年)
- 種子検査:市場規模と予測(2021年~2026年)
- その他:市場規模と予測(2021年~2026年)
- 用途別の市場機会
第6章 顧客情勢
- 顧客情勢の概要
第7章 地域別の情勢
- 地域別のセグメンテーション
- 地域別の比較
- 北米:市場規模と予測(2021年~2026年)
- 欧州:市場規模と予測(2021年~2026年)
- アジア太平洋:市場規模と予測(2021年~2026年)
- 南米:市場規模と予測(2021年~2026年)
- 中東・アフリカ:市場規模と予測(2021年~2026年)
- 米国:市場規模と予測(2021年~2026年)
- 中国:市場規模と予測(2021年~2026年)
- 英国:市場規模と予測(2021年~2026年)
- オーストラリア:市場規模と予測(2021年~2026年)
- インド:市場規模と予測(2021年~2026年)
- 地域別の市場機会
第8章 促進要因・課題・動向
- 市場促進要因
- 市場の課題
- 促進要因と課題の影響
- 市場動向
第9章 ベンダー情勢
- 概要
- ベンダー情勢
- 混乱情勢
- 業界のリスク
第10章 ベンダー分析
- 対象ベンダー
- ベンダーの市場ポジショニング
- Agilent Technologies Inc.
- ALS Ltd.
- Apal Agricultural Laboratory
- Eurofins Scientific SE
- Harvests Group
- Intertek Group Plc
- RJ Hill Laboratories Ltd.
- SGS SA
- Thermo Fisher Scientific Inc.
- Tirupati Fresh Argo Crop Science Pvt. Ltd.
第11章 付録
Exhibits:
- Exhibits1: Executive Summary - Chart on Market Overview
- Exhibits2: Executive Summary - Data Table on Market Overview
- Exhibits3: Executive Summary - Chart on Global Market Characteristics
- Exhibits4: Executive Summary - Chart on Market by Geography
- Exhibits5: Executive Summary - Chart on Market Segmentation by Application
- Exhibits6: Executive Summary - Chart on Incremental Growth
- Exhibits7: Executive Summary - Data Table on Incremental Growth
- Exhibits8: Executive Summary - Chart on Vendor Market Positioning
- Exhibits9: Parent market
- Exhibits10: Market Characteristics
- Exhibits11: Offerings of vendors included in the market definition
- Exhibits12: Market segments
- Exhibits13: Chart on Global - Market size and forecast 2021-2026 ($ million)
- Exhibits14: Data Table on Global - Market size and forecast 2021-2026 ($ million)
- Exhibits15: Chart on Global Market: Year-over-year growth 2021-2026 (%)
- Exhibits16: Data Table on Global Market: Year-over-year growth 2021-2026 (%)
- Exhibits17: Five forces analysis - Comparison between2021 and 2026
- Exhibits18: Chart on Bargaining power of buyers - Impact of key factors 2021 and 2026
- Exhibits19: Bargaining power of suppliers - Impact of key factors in 2021 and 2026
- Exhibits20: Threat of new entrants - Impact of key factors in 2021 and 2026
- Exhibits21: Threat of substitutes - Impact of key factors in 2021 and 2026
- Exhibits22: Threat of rivalry - Impact of key factors in 2021 and 2026
- Exhibits23: Chart on Market condition - Five forces 2021 and 2026
- Exhibits24: Chart on Application - Market share 2021-2026 (%)
- Exhibits25: Data Table on Application - Market share 2021-2026 (%)
- Exhibits26: Chart on Comparison by Application
- Exhibits27: Data Table on Comparison by Application
- Exhibits28: Chart on Soil testing - Market size and forecast 2021-2026 ($ million)
- Exhibits29: Data Table on Soil testing - Market size and forecast 2021-2026 ($ million)
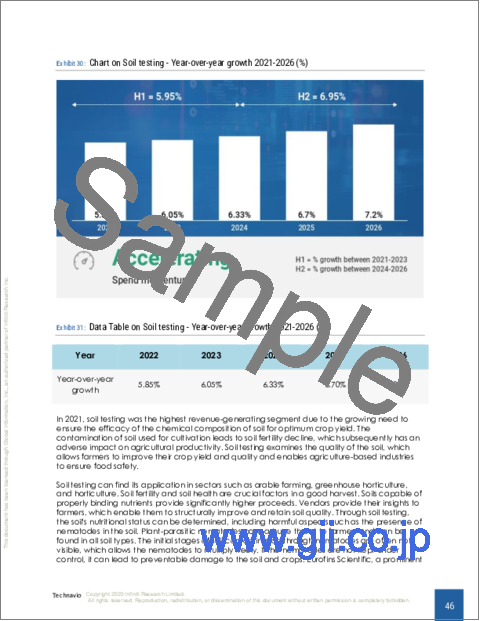
- Exhibits30: Chart on Soil testing - Year-over-year growth 2021-2026 (%)
- Exhibits31: Data Table on Soil testing - Year-over-year growth 2021-2026 (%)
- Exhibits32: Chart on Water testing - Market size and forecast 2021-2026 ($ million)
- Exhibits33: Data Table on Water testing - Market size and forecast 2021-2026 ($ million)
- Exhibits34: Chart on Water testing - Year-over-year growth 2021-2026 (%)
- Exhibits35: Data Table on Water testing - Year-over-year growth 2021-2026 (%)
- Exhibits36: Chart on Seed testing - Market size and forecast 2021-2026 ($ million)
- Exhibits37: Data Table on Seed testing - Market size and forecast 2021-2026 ($ million)
- Exhibits38: Chart on Seed testing - Year-over-year growth 2021-2026 (%)
- Exhibits39: Data Table on Seed testing - Year-over-year growth 2021-2026 (%)
- Exhibits40: Chart on Others - Market size and forecast 2021-2026 ($ million)
- Exhibits41: Data Table on Others - Market size and forecast 2021-2026 ($ million)
- Exhibits42: Chart on Others - Year-over-year growth 2021-2026 (%)
- Exhibits43: Data Table on Others - Year-over-year growth 2021-2026 (%)
- Exhibits44: Market opportunity by Application ($ million)
- Exhibits45: Analysis of price sensitivity, lifecycle, customer purchase basket, adoption rates, and purchase criteria
- Exhibits46: Chart on Market share by geography 2021-2026 (%)
- Exhibits47: Data Table on Market share by geography 2021-2026 (%)
- Exhibits48: Chart on Geographic comparison
- Exhibits49: Data Table on Geographic comparison
- Exhibits50: Chart on North America - Market size and forecast 2021-2026 ($ million)
- Exhibits51: Data Table on North America - Market size and forecast 2021-2026 ($ million)
- Exhibits52: Chart on North America - Year-over-year growth 2021-2026 (%)
- Exhibits53: Data Table on North America - Year-over-year growth 2021-2026 (%)
- Exhibits54: Chart on Europe - Market size and forecast 2021-2026 ($ million)
- Exhibits55: Data Table on Europe - Market size and forecast 2021-2026 ($ million)
- Exhibits56: Chart on Europe - Year-over-year growth 2021-2026 (%)
- Exhibits57: Data Table on Europe - Year-over-year growth 2021-2026 (%)
- Exhibits58: Chart on APAC - Market size and forecast 2021-2026 ($ million)
- Exhibits59: Data Table on APAC - Market size and forecast 2021-2026 ($ million)
- Exhibits60: Chart on APAC - Year-over-year growth 2021-2026 (%)
- Exhibits61: Data Table on APAC - Year-over-year growth 2021-2026 (%)
- Exhibits62: Chart on South America - Market size and forecast 2021-2026 ($ million)
- Exhibits63: Data Table on South America - Market size and forecast 2021-2026 ($ million)
- Exhibits64: Chart on South America - Year-over-year growth 2021-2026 (%)
- Exhibits65: Data Table on South America - Year-over-year growth 2021-2026 (%)
- Exhibits66: Chart on Middle East and Africa - Market size and forecast 2021-2026 ($ million)
- Exhibits67: Data Table on Middle East and Africa - Market size and forecast 2021-2026 ($ million)
- Exhibits68: Chart on Middle East and Africa - Year-over-year growth 2021-2026 (%)
- Exhibits69: Data Table on Middle East and Africa - Year-over-year growth 2021-2026 (%)
- Exhibits70: Chart on US - Market size and forecast 2021-2026 ($ million)
- Exhibits71: Data Table on US - Market size and forecast 2021-2026 ($ million)
- Exhibits72: Chart on US - Year-over-year growth 2021-2026 (%)
- Exhibits73: Data Table on US - Year-over-year growth 2021-2026 (%)
- Exhibits74: Chart on China - Market size and forecast 2021-2026 ($ million)
- Exhibits75: Data Table on China - Market size and forecast 2021-2026 ($ million)
- Exhibits76: Chart on China - Year-over-year growth 2021-2026 (%)
- Exhibits77: Data Table on China - Year-over-year growth 2021-2026 (%)
- Exhibits78: Chart on UK - Market size and forecast 2021-2026 ($ million)
- Exhibits79: Data Table on UK - Market size and forecast 2021-2026 ($ million)
- Exhibits80: Chart on UK - Year-over-year growth 2021-2026 (%)
- Exhibits81: Data Table on UK - Year-over-year growth 2021-2026 (%)
- Exhibits82: Chart on Australia - Market size and forecast 2021-2026 ($ million)
- Exhibits83: Data Table on Australia - Market size and forecast 2021-2026 ($ million)
- Exhibits84: Chart on Australia - Year-over-year growth 2021-2026 (%)
- Exhibits85: Data Table on Australia - Year-over-year growth 2021-2026 (%)
- Exhibits86: Chart on India - Market size and forecast 2021-2026 ($ million)
- Exhibits87: Data Table on India - Market size and forecast 2021-2026 ($ million)
- Exhibits88: Chart on India - Year-over-year growth 2021-2026 (%)
- Exhibits89: Data Table on India - Year-over-year growth 2021-2026 (%)
- Exhibits90: Market opportunity by geography ($ million)
- Exhibits91: Impact of drivers and challenges in 2021 and 2026
- Exhibits92: Overview on Criticality of inputs and Factors of differentiation
- Exhibits93: Overview on factors of disruption
- Exhibits94: Impact of key risks on business
- Exhibits95: Vendors covered
- Exhibits96: Matrix on vendor position and classification
- Exhibits97: Agilent Technologies Inc. - Overview
- Exhibits98: Agilent Technologies Inc. - Business segments
- Exhibits99: Agilent Technologies Inc. - Key news
- Exhibits100: Agilent Technologies Inc. - Key offerings
- Exhibits101: Agilent Technologies Inc. - Segment focus
- Exhibits102: ALS Ltd. - Overview
- Exhibits103: ALS Ltd. - Business segments
- Exhibits104: ALS Ltd. - Key news
- Exhibits105: ALS Ltd. - Key offerings
- Exhibits106: ALS Ltd. - Segment focus
- Exhibits107: Apal Agricultural Laboratory - Overview
- Exhibits108: Apal Agricultural Laboratory - Product / Service
- Exhibits109: Apal Agricultural Laboratory - Key offerings
- Exhibits110: Eurofins Scientific SE - Overview
- Exhibits111: Eurofins Scientific SE - Business segments
- Exhibits112: Eurofins Scientific SE - Key news
- Exhibits113: Eurofins Scientific SE - Key offerings
- Exhibits114: Eurofins Scientific SE - Segment focus
- Exhibits115: Harvesto Group - Overview
- Exhibits116: Harvesto Group - Product / Service
- Exhibits117: Harvesto Group - Key offerings
- Exhibits118: Intertek Group Plc - Overview
- Exhibits119: Intertek Group Plc - Business segments
- Exhibits120: Intertek Group Plc - Key news
- Exhibits121: Intertek Group Plc - Key offerings
- Exhibits122: Intertek Group Plc - Segment focus
- Exhibits123: RJ Hill Laboratories Ltd. - Overview
- Exhibits124: RJ Hill Laboratories Ltd. - Product / Service
- Exhibits125: RJ Hill Laboratories Ltd. - Key offerings
- Exhibits126: SGS SA - Overview
- Exhibits127: SGS SA - Business segments
- Exhibits128: SGS SA - Key offerings
- Exhibits129: SGS SA - Segment focus
- Exhibits130: Thermo Fisher Scientific Inc. - Overview
- Exhibits131: Thermo Fisher Scientific Inc. - Business segments
- Exhibits132: Thermo Fisher Scientific Inc. - Key news
- Exhibits133: Thermo Fisher Scientific Inc. - Key offerings
- Exhibits134: Thermo Fisher Scientific Inc. - Segment focus
- Exhibits135: Tirupati Fresh Agro Crop Science Pvt. Ltd. - Overview
- Exhibits136: Tirupati Fresh Agro Crop Science Pvt. Ltd. - Product / Service
- Exhibits137: Tirupati Fresh Agro Crop Science Pvt. Ltd. - Key offerings
- Exhibits138: Inclusions checklist
- Exhibits139: Exclusions checklist
- Exhibits140: Currency conversion rates for US$
- Exhibits141: Research methodology
- Exhibits142: Validation techniques employed for market sizing
- Exhibits143: Information sources
- Exhibits144: List of abbreviations
Technavio has been monitoring the agricultural testing market and it is poised to grow by $ 2.10 bn during 2022-2026, accelerating at a CAGR of 6.25% during the forecast period. Our report on the agricultural testing market provides a holistic analysis, market size and forecast, trends, growth drivers, and challenges, as well as vendor analysis covering around 25 vendors.
The report offers an up-to-date analysis of the current global market scenario, the latest trends and drivers, and the overall market environment. The market is driven by a marked increase in soil and water contamination, initiatives to improve agricultural components, and stringent safety and quality regulations for agricultural components.
The agricultural testing market analysis includes application segment and geographic landscape.
Technavio's agricultural testing market is segmented as below:
By Application
- soil testing
- water testing
- seed testing
- others
By Geography
- North America
- Europe
- APAC
- South America
- The Middle East and Africa
This study identifies the rapid growth in greenhouse production as one of the prime reasons driving the agricultural testing market growth during the next few years. Also, the growing need to meet the rising demand for food products and the growing prevalence of seed-borne diseases will lead to sizable demand in the market.
Technavio presents a detailed picture of the market by the way of study, synthesis, and summation of data from multiple sources by an analysis of key parameters. Our report on the agricultural testing market covers the following areas:
- Agricultural testing market sizing
- Agricultural testing market forecast
- Agricultural testing market industry analysis
Technavio's robust vendor analysis is designed to help clients improve their market position, and in line with this, this report provides a detailed analysis of several leading agricultural testing market vendors that include Agilent Technologies Inc., ALS Ltd., Apal Agricultural Laboratory, AUREA Agrosciences, bioMerieux SA, Bionema Ltd., Bureau Veritas SA, Charm Sciences Inc., Element Materials Technology Group Ltd., Eurofins Scientific SE, Harvesto Group, Intertek Group Plc, Lilaba Analytical Laboratories, Neogen Corp., Polygon Agro India Pvt. Ltd., RJ Hill Laboratories Ltd., SGS SA, Staphyt, Thermo Fisher Scientific Inc., and Tirupati Fresh Agro Crop Science Pvt. Ltd. Also, the agricultural testing market analysis report includes information on upcoming trends and challenges that will influence market growth. This is to help companies strategize and leverage all forthcoming growth opportunities.
The study was conducted using an objective combination of primary and secondary information including inputs from key participants in the industry. The report contains a comprehensive market and vendor landscape in addition to an analysis of the key vendors.
Technavio presents a detailed picture of the market by the way of study, synthesis, and summation of data from multiple sources by an analysis of key parameters such as profit, pricing, competition, and promotions. It presents various market facets by identifying the key industry influencers. The data presented is comprehensive, reliable, and a result of extensive research - both primary and secondary. Technavio's market research reports provide a complete competitive landscape and an in-depth vendor selection methodology and analysis using qualitative and quantitative research to forecast accurate market growth.
Table of Contents
1 Executive Summary
- 1.1 Market overview
- Exhibit 01: Executive Summary - Chart on Market Overview
- Exhibit 02: Executive Summary - Data Table on Market Overview
- Exhibit 03: Executive Summary - Chart on Global Market Characteristics
- Exhibit 04: Executive Summary - Chart on Market by Geography
- Exhibit 05: Executive Summary - Chart on Market Segmentation by Application
- Exhibit 06: Executive Summary - Chart on Incremental Growth
- Exhibit 07: Executive Summary - Data Table on Incremental Growth
- Exhibit 08: Executive Summary - Chart on Vendor Market Positioning
2 Market Landscape
- 2.1 Market ecosystem
- Exhibit 09: Parent market
- Exhibit 10: Market Characteristics
3 Market Sizing
- 3.1 Market definition
- Exhibit 11: Offerings of vendors included in the market definition
- 3.2 Market segment analysis
- Exhibit 12: Market segments
- 3.3 Market size 2021
- 3.4 Market outlook: Forecast for 2021-2026
- Exhibit 13: Chart on Global - Market size and forecast 2021-2026 ($ million)
- Exhibit 14: Data Table on Global - Market size and forecast 2021-2026 ($ million)
- Exhibit 15: Chart on Global Market: Year-over-year growth 2021-2026 (%)
- Exhibit 16: Data Table on Global Market: Year-over-year growth 2021-2026 (%)
4 Five Forces Analysis
- 4.1 Five forces summary
- Exhibit 17: Five forces analysis - Comparison between2021 and 2026
- 4.2 Bargaining power of buyers
- Exhibit 18: Chart on Bargaining power of buyers - Impact of key factors 2021 and 2026
- 4.3 Bargaining power of suppliers
- Exhibit 19: Bargaining power of suppliers - Impact of key factors in 2021 and 2026
- 4.4 Threat of new entrants
- Exhibit 20: Threat of new entrants - Impact of key factors in 2021 and 2026
- 4.5 Threat of substitutes
- Exhibit 21: Threat of substitutes - Impact of key factors in 2021 and 2026
- 4.6 Threat of rivalry
- Exhibit 22: Threat of rivalry - Impact of key factors in 2021 and 2026
- 4.7 Market condition
- Exhibit 23: Chart on Market condition - Five forces 2021 and 2026
5 Market Segmentation by Application
- 5.1 Market segments
- Exhibit 24: Chart on Application - Market share 2021-2026 (%)
- Exhibit 25: Data Table on Application - Market share 2021-2026 (%)
- 5.2 Comparison by Application
- Exhibit 26: Chart on Comparison by Application
- Exhibit 27: Data Table on Comparison by Application
- 5.3 Soil testing - Market size and forecast 2021-2026
- Exhibit 28: Chart on Soil testing - Market size and forecast 2021-2026 ($ million)
- Exhibit 29: Data Table on Soil testing - Market size and forecast 2021-2026 ($ million)
- Exhibit 30: Chart on Soil testing - Year-over-year growth 2021-2026 (%)
- Exhibit 31: Data Table on Soil testing - Year-over-year growth 2021-2026 (%)
- 5.4 Water testing - Market size and forecast 2021-2026
- Exhibit 32: Chart on Water testing - Market size and forecast 2021-2026 ($ million)
- Exhibit 33: Data Table on Water testing - Market size and forecast 2021-2026 ($ million)
- Exhibit 34: Chart on Water testing - Year-over-year growth 2021-2026 (%)
- Exhibit 35: Data Table on Water testing - Year-over-year growth 2021-2026 (%)
- 5.5 Seed testing - Market size and forecast 2021-2026
- Exhibit 36: Chart on Seed testing - Market size and forecast 2021-2026 ($ million)
- Exhibit 37: Data Table on Seed testing - Market size and forecast 2021-2026 ($ million)
- Exhibit 38: Chart on Seed testing - Year-over-year growth 2021-2026 (%)
- Exhibit 39: Data Table on Seed testing - Year-over-year growth 2021-2026 (%)
- 5.6 Others - Market size and forecast 2021-2026
- Exhibit 40: Chart on Others - Market size and forecast 2021-2026 ($ million)
- Exhibit 41: Data Table on Others - Market size and forecast 2021-2026 ($ million)
- Exhibit 42: Chart on Others - Year-over-year growth 2021-2026 (%)
- Exhibit 43: Data Table on Others - Year-over-year growth 2021-2026 (%)
- 5.7 Market opportunity by Application
- Exhibit 44: Market opportunity by Application ($ million)
6 Customer Landscape
- 6.1 Customer landscape overview
- Exhibit 45: Analysis of price sensitivity, lifecycle, customer purchase basket, adoption rates, and purchase criteria
7 Geographic Landscape
- 7.1 Geographic segmentation
- Exhibit 46: Chart on Market share by geography 2021-2026 (%)
- Exhibit 47: Data Table on Market share by geography 2021-2026 (%)
- 7.2 Geographic comparison
- Exhibit 48: Chart on Geographic comparison
- Exhibit 49: Data Table on Geographic comparison
- 7.3 North America - Market size and forecast 2021-2026
- Exhibit 50: Chart on North America - Market size and forecast 2021-2026 ($ million)
- Exhibit 51: Data Table on North America - Market size and forecast 2021-2026 ($ million)
- Exhibit 52: Chart on North America - Year-over-year growth 2021-2026 (%)
- Exhibit 53: Data Table on North America - Year-over-year growth 2021-2026 (%)
- 7.4 Europe - Market size and forecast 2021-2026
- Exhibit 54: Chart on Europe - Market size and forecast 2021-2026 ($ million)
- Exhibit 55: Data Table on Europe - Market size and forecast 2021-2026 ($ million)
- Exhibit 56: Chart on Europe - Year-over-year growth 2021-2026 (%)
- Exhibit 57: Data Table on Europe - Year-over-year growth 2021-2026 (%)
- 7.5 APAC - Market size and forecast 2021-2026
- Exhibit 58: Chart on APAC - Market size and forecast 2021-2026 ($ million)
- Exhibit 59: Data Table on APAC - Market size and forecast 2021-2026 ($ million)
- Exhibit 60: Chart on APAC - Year-over-year growth 2021-2026 (%)
- Exhibit 61: Data Table on APAC - Year-over-year growth 2021-2026 (%)
- 7.6 South America - Market size and forecast 2021-2026
- Exhibit 62: Chart on South America - Market size and forecast 2021-2026 ($ million)
- Exhibit 63: Data Table on South America - Market size and forecast 2021-2026 ($ million)
- Exhibit 64: Chart on South America - Year-over-year growth 2021-2026 (%)
- Exhibit 65: Data Table on South America - Year-over-year growth 2021-2026 (%)
- 7.7 Middle East and Africa - Market size and forecast 2021-2026
- Exhibit 66: Chart on Middle East and Africa - Market size and forecast 2021-2026 ($ million)
- Exhibit 67: Data Table on Middle East and Africa - Market size and forecast 2021-2026 ($ million)
- Exhibit 68: Chart on Middle East and Africa - Year-over-year growth 2021-2026 (%)
- Exhibit 69: Data Table on Middle East and Africa - Year-over-year growth 2021-2026 (%)
- 7.8 US - Market size and forecast 2021-2026
- Exhibit 70: Chart on US - Market size and forecast 2021-2026 ($ million)
- Exhibit 71: Data Table on US - Market size and forecast 2021-2026 ($ million)
- Exhibit 72: Chart on US - Year-over-year growth 2021-2026 (%)
- Exhibit 73: Data Table on US - Year-over-year growth 2021-2026 (%)
- 7.9 China - Market size and forecast 2021-2026
- Exhibit 74: Chart on China - Market size and forecast 2021-2026 ($ million)
- Exhibit 75: Data Table on China - Market size and forecast 2021-2026 ($ million)
- Exhibit 76: Chart on China - Year-over-year growth 2021-2026 (%)
- Exhibit 77: Data Table on China - Year-over-year growth 2021-2026 (%)
- 7.10 UK - Market size and forecast 2021-2026
- Exhibit 78: Chart on UK - Market size and forecast 2021-2026 ($ million)
- Exhibit 79: Data Table on UK - Market size and forecast 2021-2026 ($ million)
- Exhibit 80: Chart on UK - Year-over-year growth 2021-2026 (%)
- Exhibit 81: Data Table on UK - Year-over-year growth 2021-2026 (%)
- 7.11 Australia - Market size and forecast 2021-2026
- Exhibit 82: Chart on Australia - Market size and forecast 2021-2026 ($ million)
- Exhibit 83: Data Table on Australia - Market size and forecast 2021-2026 ($ million)
- Exhibit 84: Chart on Australia - Year-over-year growth 2021-2026 (%)
- Exhibit 85: Data Table on Australia - Year-over-year growth 2021-2026 (%)
- 7.12 India - Market size and forecast 2021-2026
- Exhibit 86: Chart on India - Market size and forecast 2021-2026 ($ million)
- Exhibit 87: Data Table on India - Market size and forecast 2021-2026 ($ million)
- Exhibit 88: Chart on India - Year-over-year growth 2021-2026 (%)
- Exhibit 89: Data Table on India - Year-over-year growth 2021-2026 (%)
- 7.13 Market opportunity by geography
- Exhibit 90: Market opportunity by geography ($ million)
8 Drivers, Challenges, and Trends
- 8.1 Market drivers
- 8.2 Market challenges
- 8.3 Impact of drivers and challenges
- Exhibit 91: Impact of drivers and challenges in 2021 and 2026
- 8.4 Market trends
9 Vendor Landscape
- 9.1 Overview
- 9.2 Vendor landscape
- Exhibit 92: Overview on Criticality of inputs and Factors of differentiation
- 9.3 Landscape disruption
- Exhibit 93: Overview on factors of disruption
- 9.4 Industry risks
- Exhibit 94: Impact of key risks on business
10 Vendor Analysis
- 10.1 Vendors covered
- Exhibit 95: Vendors covered
- 10.2 Market positioning of vendors
- Exhibit 96: Matrix on vendor position and classification
- 10.3 Agilent Technologies Inc.
- Exhibit 97: Agilent Technologies Inc. - Overview
- Exhibit 98: Agilent Technologies Inc. - Business segments
- Exhibit 99: Agilent Technologies Inc. - Key news
- Exhibit 100: Agilent Technologies Inc. - Key offerings
- Exhibit 101: Agilent Technologies Inc. - Segment focus
- 10.4 ALS Ltd.
- Exhibit 102: ALS Ltd. - Overview
- Exhibit 103: ALS Ltd. - Business segments
- Exhibit 104: ALS Ltd. - Key news
- Exhibit 105: ALS Ltd. - Key offerings
- Exhibit 106: ALS Ltd. - Segment focus
- 10.5 Apal Agricultural Laboratory
- Exhibit 107: Apal Agricultural Laboratory - Overview
- Exhibit 108: Apal Agricultural Laboratory - Product / Service
- Exhibit 109: Apal Agricultural Laboratory - Key offerings
- 10.6 Eurofins Scientific SE
- Exhibit 110: Eurofins Scientific SE - Overview
- Exhibit 111: Eurofins Scientific SE - Business segments
- Exhibit 112: Eurofins Scientific SE - Key news
- Exhibit 113: Eurofins Scientific SE - Key offerings
- Exhibit 114: Eurofins Scientific SE - Segment focus
- 10.7 Harvesto Group
- Exhibit 115: Harvesto Group - Overview
- Exhibit 116: Harvesto Group - Product / Service
- Exhibit 117: Harvesto Group - Key offerings
- 10.8 Intertek Group Plc
- Exhibit 118: Intertek Group Plc - Overview
- Exhibit 119: Intertek Group Plc - Business segments
- Exhibit 120: Intertek Group Plc - Key news
- Exhibit 121: Intertek Group Plc - Key offerings
- Exhibit 122: Intertek Group Plc - Segment focus
- 10.9 RJ Hill Laboratories Ltd.
- Exhibit 123: RJ Hill Laboratories Ltd. - Overview
- Exhibit 124: RJ Hill Laboratories Ltd. - Product / Service
- Exhibit 125: RJ Hill Laboratories Ltd. - Key offerings
- 10.10 SGS SA
- Exhibit 126: SGS SA - Overview
- Exhibit 127: SGS SA - Business segments
- Exhibit 128: SGS SA - Key offerings
- Exhibit 129: SGS SA - Segment focus
- 10.11 Thermo Fisher Scientific Inc.
- Exhibit 130: Thermo Fisher Scientific Inc. - Overview
- Exhibit 131: Thermo Fisher Scientific Inc. - Business segments
- Exhibit 132: Thermo Fisher Scientific Inc. - Key news
- Exhibit 133: Thermo Fisher Scientific Inc. - Key offerings
- Exhibit 134: Thermo Fisher Scientific Inc. - Segment focus
- 10.12 Tirupati Fresh Agro Crop Science Pvt. Ltd.
- Exhibit 135: Tirupati Fresh Agro Crop Science Pvt. Ltd. - Overview
- Exhibit 136: Tirupati Fresh Agro Crop Science Pvt. Ltd. - Product / Service
- Exhibit 137: Tirupati Fresh Agro Crop Science Pvt. Ltd. - Key offerings
11 Appendix
- 11.1 Scope of the report
- 11.2 Inclusions and exclusions checklist
- Exhibit 138: Inclusions checklist
- Exhibit 139: Exclusions checklist
- 11.3 Currency conversion rates for US$
- Exhibit 140: Currency conversion rates for US$
- 11.4 Research methodology
- Exhibit 141: Research methodology
- Exhibit 142: Validation techniques employed for market sizing
- Exhibit 143: Information sources
- 11.5 List of abbreviations
- Exhibit 144: List of abbreviations