|
|
市場調査レポート
商品コード
1261930
ヘルスケアにおける4Dプリンティングの世界市場 2023-2027Global 4D Printing in Healthcare Market 2023-2027 |
||||||
|
|
|||||||
|
● お客様のご希望に応じて、既存データの加工や未掲載情報(例:国別セグメント)の追加などの対応が可能です。 詳細はお問い合わせください。 |
|||||||


| ヘルスケアにおける4Dプリンティングの世界市場 2023-2027 |
|
出版日: 2023年03月20日
発行: TechNavio
ページ情報: 英文 152 Pages
納期: 即納可能
|
- 全表示
- 概要
- 図表
- 目次
当レポートでは、ヘルスケアにおける4Dプリンティング市場を監視し、2022年から2027年の間に42,391.26 thの米ドルで、予測期間中に29.62%のCAGRで成長すると予測しています。
当レポートでは、ヘルスケアにおける4Dプリンティング市場について、全体的な分析、市場規模・予測、動向、成長促進要因・課題、さらに約25のベンダーを網羅したベンダー分析を行っています。
現在の市場シナリオ、最新の動向と促進要因、市場全体の環境に関する最新の分析を提供しています。この市場は、パーソナライズされた医療機器やカスタマイズされた医療機器の需要の増加、医療関係者による4dプリント技術の採用の増加、コスト効率の上昇と生産性の向上が牽引しています。
本調査では、今後数年間のヘルスケアにおける4Dプリンティング市場の成長を促進する主要な理由の一つとして、医療機器における4dプリンティングの新たな技術的進歩とアプリケーションを挙げています。また、生体臓器や細胞構造を製造するための4dプリンティングプロセスに関する調査や、4dフローメディカルイメージングを用いた3dプリンティングの導入が、市場の大きな需要につながると考えられます。
目次
第1章 エグゼクティブサマリー
- 市場概要
第2章 市場情勢
- 市場エコシステム
第3章 市場規模
- 市場の定義
- 市場別分析
- 市場規模 2022
- 市場の見通し 2022-2027
第4章 市場規模実績
- ヘルスケアにおける4Dプリンティングの世界市場 2017-2021
- 用途別分析 2017-2021
- 部品セグメント分析 2017-2021
- 地域別分析 2017-2021
- 国別分析 2017-2021
第5章 ファイブフォース分析
- ファイブフォースの要約
- 買い手の交渉力
- 供給企業の交渉力
- 新規参入業者の脅威
- 代替品の脅威
- 競争の脅威
- 市況
第6章 市場セグメンテーション:用途別
- 市場セグメント
- 比較:用途別
- インプラント:市場規模と予測 2022-2027
- 医療機器:市場規模と予測 2022-2027
- シミュレーションとトレーニング:市場規模と予測 2022-2027
- 市場機会:用途別
第7章 市場セグメンテーション:コンポーネント別
- 市場セグメント
- 比較:コンポーネント別
- ソフトウェアとサービス:市場規模と予測 2022-2027
- 装置:市場規模と予測 2022-2027
- プログラマブルマテリアル:市場規模と予測 2022-2027
- 市場機会:コンポーネント別
第8章 顧客情勢
- 顧客情勢の概要
第9章 地域別情勢
- 地域別セグメンテーション
- 地域別比較
- 北米:市場規模と予測 2022-2027
- 欧州:市場規模と予測 2022-2027
- アジア:市場規模と予測 2022-2027
- 世界のその他の地域:市場規模と予測 2022-2027
- 米国:市場規模と予測 2022-2027
- ドイツ:市場規模と予測 2022-2027
- 中国:市場規模と予測 2022-2027
- フランス:市場規模と予測 2022-2027
- 日本:市場規模と予測 2022-2027
- 市場機会:地域別
第10章 促進要因、課題、および動向
- 市場促進要因
- 市場の課題
- 促進要因と課題の影響
- 市場動向
第11章 ベンダー情勢
- 概要
- ベンダー情勢
- 混乱の状況
- 業界のリスク
第12章 ベンダー分析
- 対象ベンダー
- ベンダーの市場ポジショニング
- 3D Systems Corp.
- Desktop Metal Inc.
- Organovo Holdings Inc.
- Otto GmbH and Co. KG
- Poietis
- Stratasys Ltd.
第13章 付録
Exhibits:
- Exhibits1: Executive Summary - Chart on Market Overview
- Exhibits2: Executive Summary - Data Table on Market Overview
- Exhibits3: Executive Summary - Chart on Global Market Characteristics
- Exhibits4: Executive Summary - Chart on Market by Geography
- Exhibits5: Executive Summary - Chart on Market Segmentation by Application
- Exhibits6: Executive Summary - Chart on Market Segmentation by Component
- Exhibits7: Executive Summary - Chart on Incremental Growth
- Exhibits8: Executive Summary - Data Table on Incremental Growth
- Exhibits9: Executive Summary - Chart on Vendor Market Positioning
- Exhibits10: Parent market
- Exhibits11: Market Characteristics
- Exhibits12: Offerings of vendors included in the market definition
- Exhibits13: Market segments
- Exhibits14: Chart on Global - Market size and forecast 2022-2027 ($ thousand)
- Exhibits15: Data Table on Global - Market size and forecast 2022-2027 ($ thousand)
- Exhibits16: Chart on Global Market: Year-over-year growth 2022-2027 (%)
- Exhibits17: Data Table on Global Market: Year-over-year growth 2022-2027 (%)
- Exhibits18: Historic Market Size - Data Table on Global 4D printing in healthcare market 2017 - 2021 ($ thousand)
- Exhibits19: Historic Market Size - Application Segment 2017 - 2021 ($ thousand)
- Exhibits20: Historic Market Size - Component Segment 2017 - 2021 ($ thousand)
- Exhibits21: Historic Market Size - Geography Segment 2017 - 2021 ($ thousand)
- Exhibits22: Historic Market Size - Country Segment 2017 - 2021 ($ thousand)
- Exhibits23: Five forces analysis - Comparison between 2022 and 2027
- Exhibits24: Chart on Bargaining power of buyers - Impact of key factors 2022 and 2027
- Exhibits25: Bargaining power of suppliers - Impact of key factors in 2022 and 2027
- Exhibits26: Threat of new entrants - Impact of key factors in 2022 and 2027
- Exhibits27: Threat of substitutes - Impact of key factors in 2022 and 2027
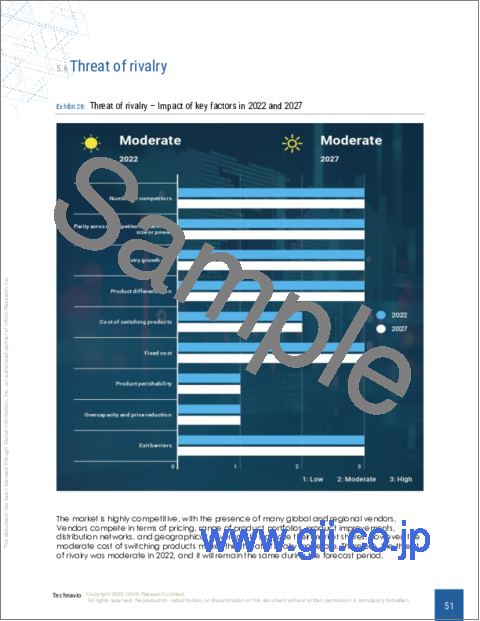
- Exhibits28: Threat of rivalry - Impact of key factors in 2022 and 2027
- Exhibits29: Chart on Market condition - Five forces 2022 and 2027
- Exhibits30: Chart on Application - Market share 2022-2027 (%)
- Exhibits31: Data Table on Application - Market share 2022-2027 (%)
- Exhibits32: Chart on Comparison by Application
- Exhibits33: Data Table on Comparison by Application
- Exhibits34: Chart on Implants - Market size and forecast 2022-2027 ($ thousand)
- Exhibits35: Data Table on Implants - Market size and forecast 2022-2027 ($ thousand)
- Exhibits36: Chart on Implants - Year-over-year growth 2022-2027 (%)
- Exhibits37: Data Table on Implants - Year-over-year growth 2022-2027 (%)
- Exhibits38: Chart on Medical devices - Market size and forecast 2022-2027 ($ thousand)
- Exhibits39: Data Table on Medical devices - Market size and forecast 2022-2027 ($ thousand)
- Exhibits40: Chart on Medical devices - Year-over-year growth 2022-2027 (%)
- Exhibits41: Data Table on Medical devices - Year-over-year growth 2022-2027 (%)
- Exhibits42: Chart on Simulating and training - Market size and forecast 2022-2027 ($ thousand)
- Exhibits43: Data Table on Simulating and training - Market size and forecast 2022-2027 ($ thousand)
- Exhibits44: Chart on Simulating and training - Year-over-year growth 2022-2027 (%)
- Exhibits45: Data Table on Simulating and training - Year-over-year growth 2022-2027 (%)
- Exhibits46: Market opportunity by Application ($ thousand)
- Exhibits47: Data Table on Market opportunity by Application ($ thousand)
- Exhibits48: Chart on Component - Market share 2022-2027 (%)
- Exhibits49: Data Table on Component - Market share 2022-2027 (%)
- Exhibits50: Chart on Comparison by Component
- Exhibits51: Data Table on Comparison by Component
- Exhibits52: Chart on Software and services - Market size and forecast 2022-2027 ($ thousand)
- Exhibits53: Data Table on Software and services - Market size and forecast 2022-2027 ($ thousand)
- Exhibits54: Chart on Software and services - Year-over-year growth 2022-2027 (%)
- Exhibits55: Data Table on Software and services - Year-over-year growth 2022-2027 (%)
- Exhibits56: Chart on Equipment - Market size and forecast 2022-2027 ($ thousand)
- Exhibits57: Data Table on Equipment - Market size and forecast 2022-2027 ($ thousand)
- Exhibits58: Chart on Equipment - Year-over-year growth 2022-2027 (%)
- Exhibits59: Data Table on Equipment - Year-over-year growth 2022-2027 (%)
- Exhibits60: Chart on Programmable materials - Market size and forecast 2022-2027 ($ thousand)
- Exhibits61: Data Table on Programmable materials - Market size and forecast 2022-2027 ($ thousand)
- Exhibits62: Chart on Programmable materials - Year-over-year growth 2022-2027 (%)
- Exhibits63: Data Table on Programmable materials - Year-over-year growth 2022-2027 (%)
- Exhibits64: Market opportunity by Component ($ thousand)
- Exhibits65: Data Table on Market opportunity by Component ($ thousand)
- Exhibits66: Analysis of price sensitivity, lifecycle, customer purchase basket, adoption rates, and purchase criteria
- Exhibits67: Chart on Market share by geography 2022-2027 (%)
- Exhibits68: Data Table on Market share by geography 2022-2027 (%)
- Exhibits69: Chart on Geographic comparison
- Exhibits70: Data Table on Geographic comparison
- Exhibits71: Chart on North America - Market size and forecast 2022-2027 ($ thousand)
- Exhibits72: Data Table on North America - Market size and forecast 2022-2027 ($ thousand)
- Exhibits73: Chart on North America - Year-over-year growth 2022-2027 (%)
- Exhibits74: Data Table on North America - Year-over-year growth 2022-2027 (%)
- Exhibits75: Chart on Europe - Market size and forecast 2022-2027 ($ thousand)
- Exhibits76: Data Table on Europe - Market size and forecast 2022-2027 ($ thousand)
- Exhibits77: Chart on Europe - Year-over-year growth 2022-2027 (%)
- Exhibits78: Data Table on Europe - Year-over-year growth 2022-2027 (%)
- Exhibits79: Chart on Asia - Market size and forecast 2022-2027 ($ thousand)
- Exhibits80: Data Table on Asia - Market size and forecast 2022-2027 ($ thousand)
- Exhibits81: Chart on Asia - Year-over-year growth 2022-2027 (%)
- Exhibits82: Data Table on Asia - Year-over-year growth 2022-2027 (%)
- Exhibits83: Chart on Rest of World (ROW) - Market size and forecast 2022-2027 ($ thousand)
- Exhibits84: Data Table on Rest of World (ROW) - Market size and forecast 2022-2027 ($ thousand)
- Exhibits85: Chart on Rest of World (ROW) - Year-over-year growth 2022-2027 (%)
- Exhibits86: Data Table on Rest of World (ROW) - Year-over-year growth 2022-2027 (%)
- Exhibits87: Chart on US - Market size and forecast 2022-2027 ($ thousand)
- Exhibits88: Data Table on US - Market size and forecast 2022-2027 ($ thousand)
- Exhibits89: Chart on US - Year-over-year growth 2022-2027 (%)
- Exhibits90: Data Table on US - Year-over-year growth 2022-2027 (%)
- Exhibits91: Chart on Germany - Market size and forecast 2022-2027 ($ thousand)
- Exhibits92: Data Table on Germany - Market size and forecast 2022-2027 ($ thousand)
- Exhibits93: Chart on Germany - Year-over-year growth 2022-2027 (%)
- Exhibits94: Data Table on Germany - Year-over-year growth 2022-2027 (%)
- Exhibits95: Chart on China - Market size and forecast 2022-2027 ($ thousand)
- Exhibits96: Data Table on China - Market size and forecast 2022-2027 ($ thousand)
- Exhibits97: Chart on China - Year-over-year growth 2022-2027 (%)
- Exhibits98: Data Table on China - Year-over-year growth 2022-2027 (%)
- Exhibits99: Chart on France - Market size and forecast 2022-2027 ($ thousand)
- Exhibits100: Data Table on France - Market size and forecast 2022-2027 ($ thousand)
- Exhibits101: Chart on France - Year-over-year growth 2022-2027 (%)
- Exhibits102: Data Table on France - Year-over-year growth 2022-2027 (%)
- Exhibits103: Chart on Japan - Market size and forecast 2022-2027 ($ thousand)
- Exhibits104: Data Table on Japan - Market size and forecast 2022-2027 ($ thousand)
- Exhibits105: Chart on Japan - Year-over-year growth 2022-2027 (%)
- Exhibits106: Data Table on Japan - Year-over-year growth 2022-2027 (%)
- Exhibits107: Market opportunity by geography ($ thousand)
- Exhibits108: Data Tables on Market opportunity by geography ($ thousand)
- Exhibits109: Impact of drivers and challenges in 2022 and 2027
- Exhibits110: Overview on Criticality of inputs and Factors of differentiation
- Exhibits111: Overview on factors of disruption
- Exhibits112: Impact of key risks on business
- Exhibits113: Vendors covered
- Exhibits114: Matrix on vendor position and classification
- Exhibits115: 3D Systems Corp. - Overview
- Exhibits116: 3D Systems Corp. - Business segments
- Exhibits117: 3D Systems Corp. - Key news
- Exhibits118: 3D Systems Corp. - Key offerings
- Exhibits119: 3D Systems Corp. - Segment focus
- Exhibits120: Desktop Metal Inc. - Overview
- Exhibits121: Desktop Metal Inc. - Business segments
- Exhibits122: Desktop Metal Inc. - Key news
- Exhibits123: Desktop Metal Inc. - Key offerings
- Exhibits124: Desktop Metal Inc. - Segment focus
- Exhibits125: Organovo Holdings Inc. - Overview
- Exhibits126: Organovo Holdings Inc. - Business segments
- Exhibits127: Organovo Holdings Inc. - Key offerings
- Exhibits128: Organovo Holdings Inc. - Segment focus
- Exhibits129: Otto GmbH and Co. KG - Overview
- Exhibits130: Otto GmbH and Co. KG - Business segments
- Exhibits131: Otto GmbH and Co. KG - Key news
- Exhibits132: Otto GmbH and Co. KG - Key offerings
- Exhibits133: Otto GmbH and Co. KG - Segment focus
- Exhibits134: Poietis - Overview
- Exhibits135: Poietis - Product / Service
- Exhibits136: Poietis - Key offerings
- Exhibits137: Stratasys Ltd. - Overview
- Exhibits138: Stratasys Ltd. - Product / Service
- Exhibits139: Stratasys Ltd. - Key news
- Exhibits140: Stratasys Ltd. - Key offerings
- Exhibits141: Inclusions checklist
- Exhibits142: Exclusions checklist
- Exhibits143: Currency conversion rates for US$
- Exhibits144: Research methodology
- Exhibits145: Validation techniques employed for market sizing
- Exhibits146: Information sources
- Exhibits147: List of abbreviations
Technavio has been monitoring the 4d printing in healthcare market and is forecast to grow by USD 42,391.26 th during 2022-2027, accelerating at a CAGR of 29.62% during the forecast period. Our report on 4d printing in healthcare market provides a holistic analysis, market size, and forecast, trends, growth drivers, and challenges, as well as vendor analysis covering around 25 vendors.
The report offers an up-to-date analysis regarding the current market scenario, the latest trends and drivers, and the overall market environment. The market is driven by increased demand for personalized or customized medical devices, increasing adoption of 4d printing technology by medical professionals, and rising cost efficiency and enhanced productivity.
Technavio's 4d printing in healthcare market is segmented as below:
By Application
- Implants
- Medical devices
- Simulating and training
By Component
- Software and services
- Equipment
- Programmable materials
By Geography
- North America
- Europe
- Asia
- Rest of World (ROW)
This study identifies the emerging technological advances and applications of 4d printing in medical devices as one of the prime reasons driving the 4d printing in healthcare market growth during the next few years. Also, rising research on the 4d printing process to manufacture living organs and cell structures and implementation of 3d printing using 4d flow medical imaging will lead to sizable demand in the market.
Technavio presents a detailed picture of the market by the way of study, synthesis, and summation of data from multiple sources through an analysis of key parameters. Our report on 4d printing in healthcare market covers the following areas:
- 4d printing in healthcare market sizing
- 4d printing in healthcare market forecast
- 4d printing in healthcare market industry analysis
Technavio's robust vendor analysis is designed to help clients improve their market position, and in line with this, this report provides a detailed analysis of several leading 4d printing in healthcare market vendors that include 3D Systems Corp., Desktop Metal Inc., Organovo Holdings Inc., Otto GmbH and Co. KG, Poietis, and Stratasys Ltd.. Also, the 4d printing in healthcare market analysis report includes information on upcoming trends and challenges that will influence market growth. This is to help companies strategize and leverage all forthcoming growth opportunities.
The study was conducted using an objective combination of primary and secondary information including inputs from key participants in the industry. The report contains a comprehensive market and vendor landscape and an analysis of the key vendors.
Table of Contents
1 Executive Summary
- 1.1 Market overview
- Exhibit 01: Executive Summary - Chart on Market Overview
- Exhibit 02: Executive Summary - Data Table on Market Overview
- Exhibit 03: Executive Summary - Chart on Global Market Characteristics
- Exhibit 04: Executive Summary - Chart on Market by Geography
- Exhibit 05: Executive Summary - Chart on Market Segmentation by Application
- Exhibit 06: Executive Summary - Chart on Market Segmentation by Component
- Exhibit 07: Executive Summary - Chart on Incremental Growth
- Exhibit 08: Executive Summary - Data Table on Incremental Growth
- Exhibit 09: Executive Summary - Chart on Vendor Market Positioning
2 Market Landscape
- 2.1 Market ecosystem
- Exhibit 10: Parent market
- Exhibit 11: Market Characteristics
3 Market Sizing
- 3.1 Market definition
- Exhibit 12: Offerings of vendors included in the market definition
- 3.2 Market segment analysis
- Exhibit 13: Market segments
- 3.3 Market size 2022
- 3.4 Market outlook: Forecast for 2022-2027
- Exhibit 14: Chart on Global - Market size and forecast 2022-2027 ($ thousand)
- Exhibit 15: Data Table on Global - Market size and forecast 2022-2027 ($ thousand)
- Exhibit 16: Chart on Global Market: Year-over-year growth 2022-2027 (%)
- Exhibit 17: Data Table on Global Market: Year-over-year growth 2022-2027 (%)
4 Historic Market Size
- 4.1 Global 4D printing in healthcare market 2017 - 2021
- Exhibit 18: Historic Market Size - Data Table on Global 4D printing in healthcare market 2017 - 2021 ($ thousand)
- 4.2 Application Segment Analysis 2017 - 2021
- Exhibit 19: Historic Market Size - Application Segment 2017 - 2021 ($ thousand)
- 4.3 Component Segment Analysis 2017 - 2021
- Exhibit 20: Historic Market Size - Component Segment 2017 - 2021 ($ thousand)
- 4.4 Geography Segment Analysis 2017 - 2021
- Exhibit 21: Historic Market Size - Geography Segment 2017 - 2021 ($ thousand)
- 4.5 Country Segment Analysis 2017 - 2021
- Exhibit 22: Historic Market Size - Country Segment 2017 - 2021 ($ thousand)
5 Five Forces Analysis
- 5.1 Five forces summary
- Exhibit 23: Five forces analysis - Comparison between 2022 and 2027
- 5.2 Bargaining power of buyers
- Exhibit 24: Chart on Bargaining power of buyers - Impact of key factors 2022 and 2027
- 5.3 Bargaining power of suppliers
- Exhibit 25: Bargaining power of suppliers - Impact of key factors in 2022 and 2027
- 5.4 Threat of new entrants
- Exhibit 26: Threat of new entrants - Impact of key factors in 2022 and 2027
- 5.5 Threat of substitutes
- Exhibit 27: Threat of substitutes - Impact of key factors in 2022 and 2027
- 5.6 Threat of rivalry
- Exhibit 28: Threat of rivalry - Impact of key factors in 2022 and 2027
- 5.7 Market condition
- Exhibit 29: Chart on Market condition - Five forces 2022 and 2027
6 Market Segmentation by Application
- 6.1 Market segments
- Exhibit 30: Chart on Application - Market share 2022-2027 (%)
- Exhibit 31: Data Table on Application - Market share 2022-2027 (%)
- 6.2 Comparison by Application
- Exhibit 32: Chart on Comparison by Application
- Exhibit 33: Data Table on Comparison by Application
- 6.3 Implants - Market size and forecast 2022-2027
- Exhibit 34: Chart on Implants - Market size and forecast 2022-2027 ($ thousand)
- Exhibit 35: Data Table on Implants - Market size and forecast 2022-2027 ($ thousand)
- Exhibit 36: Chart on Implants - Year-over-year growth 2022-2027 (%)
- Exhibit 37: Data Table on Implants - Year-over-year growth 2022-2027 (%)
- 6.4 Medical devices - Market size and forecast 2022-2027
- Exhibit 38: Chart on Medical devices - Market size and forecast 2022-2027 ($ thousand)
- Exhibit 39: Data Table on Medical devices - Market size and forecast 2022-2027 ($ thousand)
- Exhibit 40: Chart on Medical devices - Year-over-year growth 2022-2027 (%)
- Exhibit 41: Data Table on Medical devices - Year-over-year growth 2022-2027 (%)
- 6.5 Simulating and training - Market size and forecast 2022-2027
- Exhibit 42: Chart on Simulating and training - Market size and forecast 2022-2027 ($ thousand)
- Exhibit 43: Data Table on Simulating and training - Market size and forecast 2022-2027 ($ thousand)
- Exhibit 44: Chart on Simulating and training - Year-over-year growth 2022-2027 (%)
- Exhibit 45: Data Table on Simulating and training - Year-over-year growth 2022-2027 (%)
- 6.6 Market opportunity by Application
- Exhibit 46: Market opportunity by Application ($ thousand)
- Exhibit 47: Data Table on Market opportunity by Application ($ thousand)
7 Market Segmentation by Component
- 7.1 Market segments
- Exhibit 48: Chart on Component - Market share 2022-2027 (%)
- Exhibit 49: Data Table on Component - Market share 2022-2027 (%)
- 7.2 Comparison by Component
- Exhibit 50: Chart on Comparison by Component
- Exhibit 51: Data Table on Comparison by Component
- 7.3 Software and services - Market size and forecast 2022-2027
- Exhibit 52: Chart on Software and services - Market size and forecast 2022-2027 ($ thousand)
- Exhibit 53: Data Table on Software and services - Market size and forecast 2022-2027 ($ thousand)
- Exhibit 54: Chart on Software and services - Year-over-year growth 2022-2027 (%)
- Exhibit 55: Data Table on Software and services - Year-over-year growth 2022-2027 (%)
- 7.4 Equipment - Market size and forecast 2022-2027
- Exhibit 56: Chart on Equipment - Market size and forecast 2022-2027 ($ thousand)
- Exhibit 57: Data Table on Equipment - Market size and forecast 2022-2027 ($ thousand)
- Exhibit 58: Chart on Equipment - Year-over-year growth 2022-2027 (%)
- Exhibit 59: Data Table on Equipment - Year-over-year growth 2022-2027 (%)
- 7.5 Programmable materials - Market size and forecast 2022-2027
- Exhibit 60: Chart on Programmable materials - Market size and forecast 2022-2027 ($ thousand)
- Exhibit 61: Data Table on Programmable materials - Market size and forecast 2022-2027 ($ thousand)
- Exhibit 62: Chart on Programmable materials - Year-over-year growth 2022-2027 (%)
- Exhibit 63: Data Table on Programmable materials - Year-over-year growth 2022-2027 (%)
- 7.6 Market opportunity by Component
- Exhibit 64: Market opportunity by Component ($ thousand)
- Exhibit 65: Data Table on Market opportunity by Component ($ thousand)
8 Customer Landscape
- 8.1 Customer landscape overview
- Exhibit 66: Analysis of price sensitivity, lifecycle, customer purchase basket, adoption rates, and purchase criteria
9 Geographic Landscape
- 9.1 Geographic segmentation
- Exhibit 67: Chart on Market share by geography 2022-2027 (%)
- Exhibit 68: Data Table on Market share by geography 2022-2027 (%)
- 9.2 Geographic comparison
- Exhibit 69: Chart on Geographic comparison
- Exhibit 70: Data Table on Geographic comparison
- 9.3 North America - Market size and forecast 2022-2027
- Exhibit 71: Chart on North America - Market size and forecast 2022-2027 ($ thousand)
- Exhibit 72: Data Table on North America - Market size and forecast 2022-2027 ($ thousand)
- Exhibit 73: Chart on North America - Year-over-year growth 2022-2027 (%)
- Exhibit 74: Data Table on North America - Year-over-year growth 2022-2027 (%)
- 9.4 Europe - Market size and forecast 2022-2027
- Exhibit 75: Chart on Europe - Market size and forecast 2022-2027 ($ thousand)
- Exhibit 76: Data Table on Europe - Market size and forecast 2022-2027 ($ thousand)
- Exhibit 77: Chart on Europe - Year-over-year growth 2022-2027 (%)
- Exhibit 78: Data Table on Europe - Year-over-year growth 2022-2027 (%)
- 9.5 Asia - Market size and forecast 2022-2027
- Exhibit 79: Chart on Asia - Market size and forecast 2022-2027 ($ thousand)
- Exhibit 80: Data Table on Asia - Market size and forecast 2022-2027 ($ thousand)
- Exhibit 81: Chart on Asia - Year-over-year growth 2022-2027 (%)
- Exhibit 82: Data Table on Asia - Year-over-year growth 2022-2027 (%)
- 9.6 Rest of World (ROW) - Market size and forecast 2022-2027
- Exhibit 83: Chart on Rest of World (ROW) - Market size and forecast 2022-2027 ($ thousand)
- Exhibit 84: Data Table on Rest of World (ROW) - Market size and forecast 2022-2027 ($ thousand)
- Exhibit 85: Chart on Rest of World (ROW) - Year-over-year growth 2022-2027 (%)
- Exhibit 86: Data Table on Rest of World (ROW) - Year-over-year growth 2022-2027 (%)
- 9.7 US - Market size and forecast 2022-2027
- Exhibit 87: Chart on US - Market size and forecast 2022-2027 ($ thousand)
- Exhibit 88: Data Table on US - Market size and forecast 2022-2027 ($ thousand)
- Exhibit 89: Chart on US - Year-over-year growth 2022-2027 (%)
- Exhibit 90: Data Table on US - Year-over-year growth 2022-2027 (%)
- 9.8 Germany - Market size and forecast 2022-2027
- Exhibit 91: Chart on Germany - Market size and forecast 2022-2027 ($ thousand)
- Exhibit 92: Data Table on Germany - Market size and forecast 2022-2027 ($ thousand)
- Exhibit 93: Chart on Germany - Year-over-year growth 2022-2027 (%)
- Exhibit 94: Data Table on Germany - Year-over-year growth 2022-2027 (%)
- 9.9 China - Market size and forecast 2022-2027
- Exhibit 95: Chart on China - Market size and forecast 2022-2027 ($ thousand)
- Exhibit 96: Data Table on China - Market size and forecast 2022-2027 ($ thousand)
- Exhibit 97: Chart on China - Year-over-year growth 2022-2027 (%)
- Exhibit 98: Data Table on China - Year-over-year growth 2022-2027 (%)
- 9.10 France - Market size and forecast 2022-2027
- Exhibit 99: Chart on France - Market size and forecast 2022-2027 ($ thousand)
- Exhibit 100: Data Table on France - Market size and forecast 2022-2027 ($ thousand)
- Exhibit 101: Chart on France - Year-over-year growth 2022-2027 (%)
- Exhibit 102: Data Table on France - Year-over-year growth 2022-2027 (%)
- 9.11 Japan - Market size and forecast 2022-2027
- Exhibit 103: Chart on Japan - Market size and forecast 2022-2027 ($ thousand)
- Exhibit 104: Data Table on Japan - Market size and forecast 2022-2027 ($ thousand)
- Exhibit 105: Chart on Japan - Year-over-year growth 2022-2027 (%)
- Exhibit 106: Data Table on Japan - Year-over-year growth 2022-2027 (%)
- 9.12 Market opportunity by geography
- Exhibit 107: Market opportunity by geography ($ thousand)
- Exhibit 108: Data Tables on Market opportunity by geography ($ thousand)
10 Drivers, Challenges, and Trends
- 10.1 Market drivers
- 10.2 Market challenges
- 10.3 Impact of drivers and challenges
- Exhibit 109: Impact of drivers and challenges in 2022 and 2027
- 10.4 Market trends
11 Vendor Landscape
- 11.1 Overview
- 11.2 Vendor landscape
- Exhibit 110: Overview on Criticality of inputs and Factors of differentiation
- 11.3 Landscape disruption
- Exhibit 111: Overview on factors of disruption
- 11.4 Industry risks
- Exhibit 112: Impact of key risks on business
12 Vendor Analysis
- 12.1 Vendors covered
- Exhibit 113: Vendors covered
- 12.2 Market positioning of vendors
- Exhibit 114: Matrix on vendor position and classification
- 12.3 3D Systems Corp.
- Exhibit 115: 3D Systems Corp. - Overview
- Exhibit 116: 3D Systems Corp. - Business segments
- Exhibit 117: 3D Systems Corp. - Key news
- Exhibit 118: 3D Systems Corp. - Key offerings
- Exhibit 119: 3D Systems Corp. - Segment focus
- 12.4 Desktop Metal Inc.
- Exhibit 120: Desktop Metal Inc. - Overview
- Exhibit 121: Desktop Metal Inc. - Business segments
- Exhibit 122: Desktop Metal Inc. - Key news
- Exhibit 123: Desktop Metal Inc. - Key offerings
- Exhibit 124: Desktop Metal Inc. - Segment focus
- 12.5 Organovo Holdings Inc.
- Exhibit 125: Organovo Holdings Inc. - Overview
- Exhibit 126: Organovo Holdings Inc. - Business segments
- Exhibit 127: Organovo Holdings Inc. - Key offerings
- Exhibit 128: Organovo Holdings Inc. - Segment focus
- 12.6 Otto GmbH and Co. KG
- Exhibit 129: Otto GmbH and Co. KG - Overview
- Exhibit 130: Otto GmbH and Co. KG - Business segments
- Exhibit 131: Otto GmbH and Co. KG - Key news
- Exhibit 132: Otto GmbH and Co. KG - Key offerings
- Exhibit 133: Otto GmbH and Co. KG - Segment focus
- 12.7 Poietis
- Exhibit 134: Poietis - Overview
- Exhibit 135: Poietis - Product / Service
- Exhibit 136: Poietis - Key offerings
- 12.8 Stratasys Ltd.
- Exhibit 137: Stratasys Ltd. - Overview
- Exhibit 138: Stratasys Ltd. - Product / Service
- Exhibit 139: Stratasys Ltd. - Key news
- Exhibit 140: Stratasys Ltd. - Key offerings
13 Appendix
- 13.1 Scope of the report
- 13.2 Inclusions and exclusions checklist
- Exhibit 141: Inclusions checklist
- Exhibit 142: Exclusions checklist
- 13.3 Currency conversion rates for US$
- Exhibit 143: Currency conversion rates for US$
- 13.4 Research methodology
- Exhibit 144: Research methodology
- Exhibit 145: Validation techniques employed for market sizing
- Exhibit 146: Information sources
- 13.5 List of abbreviations
- Exhibit 147: List of abbreviations