|
|
市場調査レポート
商品コード
1270850
パパイヤの世界市場 2023-2027Global Papaya Market 2023-2027 |
||||||
|
|
|||||||
|
● お客様のご希望に応じて、既存データの加工や未掲載情報(例:国別セグメント)の追加などの対応が可能です。 詳細はお問い合わせください。 |
|||||||


| パパイヤの世界市場 2023-2027 |
|
出版日: 2023年04月06日
発行: TechNavio
ページ情報: 英文 150 Pages
納期: 即納可能
|
- 全表示
- 概要
- 図表
- 目次
当レポートでは、パパイヤ市場をモニターし、2022年から2027年の間に285万2,590t、予測期間中のCAGRは3.61%で成長すると予測しています。
当レポートでは、パパイヤ市場について、全体的な分析、市場規模・予測、動向、成長促進要因・課題、約25のベンダーをカバーするベンダー分析などを掲載しています。
現在の市場シナリオ、最新の動向と促進要因、市場全体の環境に関する最新の分析を提供しています。市場は、健康的な食生活を維持するための果物消費の増加、パパイヤパルプの需要拡大、主要市場におけるパパイヤの需要拡大によって牽引されています。
本調査では、パパイヤの利点に関する意識の高まりが、今後数年間のパパイヤ市場の成長を促進する主要な理由の1つであると指摘しています。また、世界の組織小売業の成長とオーガニックフルーツへの需要の高まりは、市場の大きな需要につながると考えられます。
目次
第1章 エグゼクティブサマリー
- 市場概要
第2章 市場情勢
- 市場エコシステム
第3章 市場規模
- 市場の定義
- 市場別分析
- 市場規模 2022
- 市場の見通し 2022-2027
第4章 市場規模実績
- パパイヤの世界市場 2017-2021
- 用途別分析 2017-2021
- 流通チャネルセグメント分析 2017-2021
- 地域別分析 2017-2021
- 国別分析 2017-2021
第5章 ファイブフォース分析
- ファイブフォースの要約
- 買い手の交渉力
- 供給企業の交渉力
- 新規参入業者の脅威
- 代替品の脅威
- 競争の脅威
- 市況
第6章 市場セグメンテーション:用途別
- 市場セグメント
- 比較:用途別
- 製薬とヘルスケア:市場規模と予測 2022-2027
- 化粧品:市場規模と予測 2022-2027
- その他:市場規模と予測 2022-2027
- 市場機会:用途別
第7章 市場セグメンテーション:流通チャネル別
- 市場セグメント
- 比較:流通チャネル別
- オフライン:市場規模と予測 2022-2027
- オンライン:市場規模と予測 2022-2027
- 市場機会:流通チャネル別
第8章 顧客情勢
- 顧客情勢の概要
第9章 地域別情勢
- 地域別セグメンテーション
- 地域別比較
- アジア太平洋:市場規模と予測 2022-2027
- 中東・アフリカ:市場規模と予測 2022-2027
- 南米:市場規模と予測 2022-2027
- 北米:市場規模と予測 2022-2027
- 欧州:市場規模と予測 2022-2027
- インド:市場規模と予測 2022-2027
- ドミニカ共和国:市場規模と予測 2022-2027
- ブラジル:市場規模と予測 2022-2027
- メキシコ:市場規模と予測 2022-2027
- インドネシア:市場規模と予測 2022-2027
- 地域情勢別市場機会
第10章 促進要因、課題、および動向
- 市場促進要因
- 市場の課題
- 促進要因と課題の影響
- 市場動向
第11章 ベンダー情勢
- 概要
- ベンダー情勢
- 混乱の状況
- 業界のリスク
第12章 ベンダー分析
- 対象ベンダー
- ベンダーの市場ポジショニング
- ABC Fruits
- Brooks Tropicals LLC
- Calavo Growers Inc.
- Galla Foods
- Harvest Fresh Farms
- Riverford Organic Farmers Ltd.
- RK Growers Srl
- Super Starr International
第13章 付録
Exhibits:
- Exhibits1: Executive Summary - Chart on Market Overview
- Exhibits2: Executive Summary - Data Table on Market Overview
- Exhibits3: Executive Summary - Chart on Global Market Characteristics
- Exhibits4: Executive Summary - Chart on Market By Geographical Landscape
- Exhibits5: Executive Summary - Chart on Market Segmentation by Application
- Exhibits6: Executive Summary - Chart on Market Segmentation by Distribution Channel
- Exhibits7: Executive Summary - Chart on Incremental Growth
- Exhibits8: Executive Summary - Data Table on Incremental Growth
- Exhibits9: Executive Summary - Chart on Vendor Market Positioning
- Exhibits10: Parent market
- Exhibits11: Market Characteristics
- Exhibits12: Offerings of vendors included in the market definition
- Exhibits13: Market segments
- Exhibits14: Chart on Global - Market size and forecast 2022-2027 (thousand t)
- Exhibits15: Data Table on Global - Market size and forecast 2022-2027 (thousand t)
- Exhibits16: Chart on Global Market- Year-over-year growth 2022-2027 (%)
- Exhibits17: Data Table on Global Market- Year-over-year growth 2022-2027 (%)
- Exhibits18: Historic Market Size - Data Table on Global papaya market 2017 - 2021 (thousand t)
- Exhibits19: Historic Market Size - Application Segment 2017 - 2021 (thousand t)
- Exhibits20: Historic Market Size - Distribution channel Segment 2017 - 2021 (thousand t)
- Exhibits21: Historic Market Size - Geography Segment 2017 - 2021 (thousand t)
- Exhibits22: Historic Market Size - Country Segment 2017 - 2021 (thousand t)
- Exhibits23: Five forces analysis - Comparison between 2022 and 2027
- Exhibits24: Chart on Bargaining power of buyers - Impact of key factors 2022 and 2027
- Exhibits25: Bargaining power of suppliers - Impact of key factors in 2022 and 2027
- Exhibits26: Threat of new entrants - Impact of key factors in 2022 and 2027
- Exhibits27: Threat of substitutes - Impact of key factors in 2022 and 2027
- Exhibits28: Threat of rivalry - Impact of key factors in 2022 and 2027
- Exhibits29: Chart on Market condition - Five forces 2022 and 2027
- Exhibits30: Chart on Application - Market share 2022-2027 (%)
- Exhibits31: Data Table on Application - Market share 2022-2027 (%)
- Exhibits32: Chart on Comparison by Application
- Exhibits33: Data Table on Comparison by Application
- Exhibits34: Chart on Pharmaceutical and healthcare - Market size and forecast 2022-2027 (thousand t)
- Exhibits35: Data Table on Pharmaceutical and healthcare - Market size and forecast 2022-2027 (thousand t)
- Exhibits36: Chart on Pharmaceutical and healthcare - Year-over-year growth 2022-2027 (%)
- Exhibits37: Data Table on Pharmaceutical and healthcare - Year-over-year growth 2022-2027 (%)
- Exhibits38: Chart on Cosmetics - Market size and forecast 2022-2027 (thousand t)
- Exhibits39: Data Table on Cosmetics - Market size and forecast 2022-2027 (thousand t)
- Exhibits40: Chart on Cosmetics - Year-over-year growth 2022-2027 (%)
- Exhibits41: Data Table on Cosmetics - Year-over-year growth 2022-2027 (%)
- Exhibits42: Chart on Others - Market size and forecast 2022-2027 (thousand t)
- Exhibits43: Data Table on Others - Market size and forecast 2022-2027 (thousand t)
- Exhibits44: Chart on Others - Year-over-year growth 2022-2027 (%)
- Exhibits45: Data Table on Others - Year-over-year growth 2022-2027 (%)
- Exhibits46: Market opportunity by Application (thousand t)
- Exhibits47: Data Table on Market opportunity by Application (thousand t)
- Exhibits48: Chart on Distribution Channel - Market share 2022-2027 (%)
- Exhibits49: Data Table on Distribution Channel - Market share 2022-2027 (%)
- Exhibits50: Chart on Comparison by Distribution Channel
- Exhibits51: Data Table on Comparison by Distribution Channel
- Exhibits52: Chart on Offline - Market size and forecast 2022-2027 (thousand t)
- Exhibits53: Data Table on Offline - Market size and forecast 2022-2027 (thousand t)
- Exhibits54: Chart on Offline - Year-over-year growth 2022-2027 (%)
- Exhibits55: Data Table on Offline - Year-over-year growth 2022-2027 (%)
- Exhibits56: Chart on Online - Market size and forecast 2022-2027 (thousand t)
- Exhibits57: Data Table on Online - Market size and forecast 2022-2027 (thousand t)
- Exhibits58: Chart on Online - Year-over-year growth 2022-2027 (%)
- Exhibits59: Data Table on Online - Year-over-year growth 2022-2027 (%)
- Exhibits60: Market opportunity by Distribution Channel (thousand t)
- Exhibits61: Data Table on Market opportunity by Distribution Channel (thousand t)
- Exhibits62: Analysis of price sensitivity, lifecycle, customer purchase basket, adoption rates, and purchase criteria
- Exhibits63: Chart on Market share By Geographical Landscape 2022-2027 (%)
- Exhibits64: Data Table on Market share By Geographical Landscape 2022-2027 (%)
- Exhibits65: Chart on Geographic comparison
- Exhibits66: Data Table on Geographic comparison
- Exhibits67: Chart on APAC - Market size and forecast 2022-2027 (thousand t)
- Exhibits68: Data Table on APAC - Market size and forecast 2022-2027 (thousand t)
- Exhibits69: Chart on APAC - Year-over-year growth 2022-2027 (%)
- Exhibits70: Data Table on APAC - Year-over-year growth 2022-2027 (%)
- Exhibits71: Chart on Middle East and Africa - Market size and forecast 2022-2027 (thousand t)
- Exhibits72: Data Table on Middle East and Africa - Market size and forecast 2022-2027 (thousand t)
- Exhibits73: Chart on Middle East and Africa - Year-over-year growth 2022-2027 (%)
- Exhibits74: Data Table on Middle East and Africa - Year-over-year growth 2022-2027 (%)
- Exhibits75: Chart on South America - Market size and forecast 2022-2027 (thousand t)
- Exhibits76: Data Table on South America - Market size and forecast 2022-2027 (thousand t)
- Exhibits77: Chart on South America - Year-over-year growth 2022-2027 (%)
- Exhibits78: Data Table on South America - Year-over-year growth 2022-2027 (%)
- Exhibits79: Chart on North America - Market size and forecast 2022-2027 (thousand t)
- Exhibits80: Data Table on North America - Market size and forecast 2022-2027 (thousand t)
- Exhibits81: Chart on North America - Year-over-year growth 2022-2027 (%)
- Exhibits82: Data Table on North America - Year-over-year growth 2022-2027 (%)
- Exhibits83: Chart on Europe - Market size and forecast 2022-2027 (thousand t)
- Exhibits84: Data Table on Europe - Market size and forecast 2022-2027 (thousand t)
- Exhibits85: Chart on Europe - Year-over-year growth 2022-2027 (%)
- Exhibits86: Data Table on Europe - Year-over-year growth 2022-2027 (%)
- Exhibits87: Chart on India - Market size and forecast 2022-2027 (thousand t)
- Exhibits88: Data Table on India - Market size and forecast 2022-2027 (thousand t)
- Exhibits89: Chart on India - Year-over-year growth 2022-2027 (%)
- Exhibits90: Data Table on India - Year-over-year growth 2022-2027 (%)
- Exhibits91: Chart on Dominican Republic - Market size and forecast 2022-2027 (thousand t)
- Exhibits92: Data Table on Dominican Republic - Market size and forecast 2022-2027 (thousand t)
- Exhibits93: Chart on Dominican Republic - Year-over-year growth 2022-2027 (%)
- Exhibits94: Data Table on Dominican Republic - Year-over-year growth 2022-2027 (%)
- Exhibits95: Chart on Brazil - Market size and forecast 2022-2027 (thousand t)
- Exhibits96: Data Table on Brazil - Market size and forecast 2022-2027 (thousand t)
- Exhibits97: Chart on Brazil - Year-over-year growth 2022-2027 (%)
- Exhibits98: Data Table on Brazil - Year-over-year growth 2022-2027 (%)
- Exhibits99: Chart on Mexico - Market size and forecast 2022-2027 (thousand t)
- Exhibits100: Data Table on Mexico - Market size and forecast 2022-2027 (thousand t)
- Exhibits101: Chart on Mexico - Year-over-year growth 2022-2027 (%)
- Exhibits102: Data Table on Mexico - Year-over-year growth 2022-2027 (%)
- Exhibits103: Chart on Indonesia - Market size and forecast 2022-2027 (thousand t)
- Exhibits104: Data Table on Indonesia - Market size and forecast 2022-2027 (thousand t)
- Exhibits105: Chart on Indonesia - Year-over-year growth 2022-2027 (%)
- Exhibits106: Data Table on Indonesia - Year-over-year growth 2022-2027 (%)
- Exhibits107: Market opportunity By Geographical Landscape (thousand t)
- Exhibits108: Market opportunity By Geographical Landscape (thousand t) - Volume
- Exhibits109: Impact of drivers and challenges in 2022 and 2027
- Exhibits110: Overview on Criticality of inputs and Factors of differentiation
- Exhibits111: Overview on factors of disruption
- Exhibits112: Impact of key risks on business
- Exhibits113: Vendors covered
- Exhibits114: Matrix on vendor position and classification
- Exhibits115: ABC Fruits - Overview
- Exhibits116: ABC Fruits - Product / Service
- Exhibits117: ABC Fruits - Key offerings
- Exhibits118: Brooks Tropicals LLC - Overview
- Exhibits119: Brooks Tropicals LLC - Product / Service
- Exhibits120: Brooks Tropicals LLC - Key offerings
- Exhibits121: Calavo Growers Inc. - Overview
- Exhibits122: Calavo Growers Inc. - Business segments
- Exhibits123: Calavo Growers Inc. - Key news
- Exhibits124: Calavo Growers Inc. - Key offerings
- Exhibits125: Calavo Growers Inc. - Segment focus
- Exhibits126: Galla Foods - Overview
- Exhibits127: Galla Foods - Product / Service
- Exhibits128: Galla Foods - Key offerings
- Exhibits129: Harvest Fresh Farms - Overview
- Exhibits130: Harvest Fresh Farms - Product / Service
- Exhibits131: Harvest Fresh Farms - Key offerings
- Exhibits132: Riverford Organic Farmers Ltd. - Overview
- Exhibits133: Riverford Organic Farmers Ltd. - Product / Service
- Exhibits134: Riverford Organic Farmers Ltd. - Key offerings
- Exhibits135: RK Growers Srl - Overview
- Exhibits136: RK Growers Srl - Product / Service
- Exhibits137: RK Growers Srl - Key offerings
- Exhibits138: Super Starr International - Overview
- Exhibits139: Super Starr International - Product / Service
- Exhibits140: Super Starr International - Key offerings
- Exhibits141: Inclusions checklist
- Exhibits142: Exclusions checklist
- Exhibits143: Currency conversion rates for US$
- Exhibits144: Research methodology
- Exhibits145: Validation techniques employed for market sizing
- Exhibits146: Information sources
- Exhibits147: List of abbreviations
Technavio has been monitoring the papaya market and is forecast to grow by 2852.59 thousand t during 2022-2027, accelerating at a CAGR of 3.61% during the forecast period. Our report on the papaya market provides a holistic analysis, market size, and forecast, trends, growth drivers, and challenges, as well as vendor analysis covering around 25 vendors.
The report offers an up-to-date analysis regarding the current market scenario, the latest trends and drivers, and the overall market environment. The market is driven by increased consumption of fruits to maintain a healthier diet, growing demand for papaya pulp, and growing demand for papaya in key markets.
Technavio's papaya market is segmented as below:
By Application
- Pharmaceutical and healthcare
- Cosmetics
- Others
By Distribution Channel
- Offline
- Online
By Geographical Landscape
- APAC
- Middle East and Africa
- South America
- North America
- Europe
This study identifies the increasing awareness regarding the benefits of papaya as one of the prime reasons driving the papaya market growth during the next few years. Also, growth in organized retailing globally and growing demand for organic fruits will lead to sizable demand in the market.
- Papaya market sizing
- Papaya market forecast
- Papaya market industry analysis
Technavio's robust vendor analysis is designed to help clients improve their market position, and in line with this, this report provides a detailed analysis of several leading papaya market vendors that include ABC Fruits, Brooks Tropicals LLC, Calavo Growers Inc., Galla Foods, Harvest Fresh Farms, Riverford Organic Farmers Ltd., RK Growers Srl, and Super Starr International. Also, the papaya market analysis report includes information on upcoming trends and challenges that will influence market growth. This is to help companies strategize and leverage all forthcoming growth opportunities.
The study was conducted using an objective combination of primary and secondary information including inputs from key participants in the industry. The report contains a comprehensive market and vendor landscape in addition to an analysis of the key vendors.
Table of Contents
1 Executive Summary
- 1.1 Market overview
- Exhibit 01: Executive Summary - Chart on Market Overview
- Exhibit 02: Executive Summary - Data Table on Market Overview
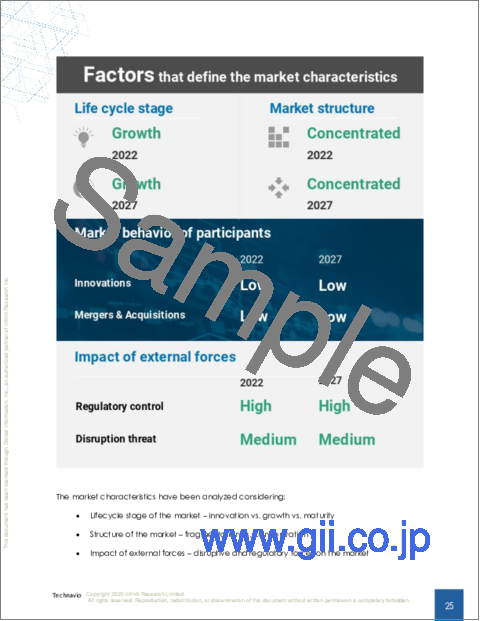
- Exhibit 03: Executive Summary - Chart on Global Market Characteristics
- Exhibit 04: Executive Summary - Chart on Market By Geographical Landscape
- Exhibit 05: Executive Summary - Chart on Market Segmentation by Application
- Exhibit 06: Executive Summary - Chart on Market Segmentation by Distribution Channel
- Exhibit 07: Executive Summary - Chart on Incremental Growth
- Exhibit 08: Executive Summary - Data Table on Incremental Growth
- Exhibit 09: Executive Summary - Chart on Vendor Market Positioning
2 Market Landscape
- 2.1 Market ecosystem
- Exhibit 10: Parent market
- Exhibit 11: Market Characteristics
3 Market Sizing
- 3.1 Market definition
- Exhibit 12: Offerings of vendors included in the market definition
- 3.2 Market segment analysis
- Exhibit 13: Market segments
- 3.3 Market size 2022
- 3.4 Market outlook: Forecast for 2022-2027
- Exhibit 14: Chart on Global - Market size and forecast 2022-2027 (thousand t)
- Exhibit 15: Data Table on Global - Market size and forecast 2022-2027 (thousand t)
- Exhibit 16: Chart on Global Market- Year-over-year growth 2022-2027 (%)
- Exhibit 17: Data Table on Global Market- Year-over-year growth 2022-2027 (%)
4 Historic Market Size
- 4.1 Global papaya market 2017 - 2021
- Exhibit 18: Historic Market Size - Data Table on Global papaya market 2017 - 2021 (thousand t)
- 4.2 Application Segment Analysis 2017 - 2021
- Exhibit 19: Historic Market Size - Application Segment 2017 - 2021 (thousand t)
- 4.3 Distribution channel Segment Analysis 2017 - 2021
- Exhibit 20: Historic Market Size - Distribution channel Segment 2017 - 2021 (thousand t)
- 4.4 Geography Segment Analysis 2017 - 2021
- Exhibit 21: Historic Market Size - Geography Segment 2017 - 2021 (thousand t)
- 4.5 Country Segment Analysis 2017 - 2021
- Exhibit 22: Historic Market Size - Country Segment 2017 - 2021 (thousand t)
5 Five Forces Analysis
- 5.1 Five forces summary
- Exhibit 23: Five forces analysis - Comparison between 2022 and 2027
- 5.2 Bargaining power of buyers
- Exhibit 24: Chart on Bargaining power of buyers - Impact of key factors 2022 and 2027
- 5.3 Bargaining power of suppliers
- Exhibit 25: Bargaining power of suppliers - Impact of key factors in 2022 and 2027
- 5.4 Threat of new entrants
- Exhibit 26: Threat of new entrants - Impact of key factors in 2022 and 2027
- 5.5 Threat of substitutes
- Exhibit 27: Threat of substitutes - Impact of key factors in 2022 and 2027
- 5.6 Threat of rivalry
- Exhibit 28: Threat of rivalry - Impact of key factors in 2022 and 2027
- 5.7 Market condition
- Exhibit 29: Chart on Market condition - Five forces 2022 and 2027
6 Market Segmentation by Application
- 6.1 Market segments
- Exhibit 30: Chart on Application - Market share 2022-2027 (%)
- Exhibit 31: Data Table on Application - Market share 2022-2027 (%)
- 6.2 Comparison by Application
- Exhibit 32: Chart on Comparison by Application
- Exhibit 33: Data Table on Comparison by Application
- 6.3 Pharmaceutical and healthcare - Market size and forecast 2022-2027
- Exhibit 34: Chart on Pharmaceutical and healthcare - Market size and forecast 2022-2027 (thousand t)
- Exhibit 35: Data Table on Pharmaceutical and healthcare - Market size and forecast 2022-2027 (thousand t)
- Exhibit 36: Chart on Pharmaceutical and healthcare - Year-over-year growth 2022-2027 (%)
- Exhibit 37: Data Table on Pharmaceutical and healthcare - Year-over-year growth 2022-2027 (%)
- 6.4 Cosmetics - Market size and forecast 2022-2027
- Exhibit 38: Chart on Cosmetics - Market size and forecast 2022-2027 (thousand t)
- Exhibit 39: Data Table on Cosmetics - Market size and forecast 2022-2027 (thousand t)
- Exhibit 40: Chart on Cosmetics - Year-over-year growth 2022-2027 (%)
- Exhibit 41: Data Table on Cosmetics - Year-over-year growth 2022-2027 (%)
- 6.5 Others - Market size and forecast 2022-2027
- Exhibit 42: Chart on Others - Market size and forecast 2022-2027 (thousand t)
- Exhibit 43: Data Table on Others - Market size and forecast 2022-2027 (thousand t)
- Exhibit 44: Chart on Others - Year-over-year growth 2022-2027 (%)
- Exhibit 45: Data Table on Others - Year-over-year growth 2022-2027 (%)
- 6.6 Market opportunity by Application
- Exhibit 46: Market opportunity by Application (thousand t)
- Exhibit 47: Data Table on Market opportunity by Application (thousand t)
7 Market Segmentation by Distribution Channel
- 7.1 Market segments
- Exhibit 48: Chart on Distribution Channel - Market share 2022-2027 (%)
- Exhibit 49: Data Table on Distribution Channel - Market share 2022-2027 (%)
- 7.2 Comparison by Distribution Channel
- Exhibit 50: Chart on Comparison by Distribution Channel
- Exhibit 51: Data Table on Comparison by Distribution Channel
- 7.3 Offline - Market size and forecast 2022-2027
- Exhibit 52: Chart on Offline - Market size and forecast 2022-2027 (thousand t)
- Exhibit 53: Data Table on Offline - Market size and forecast 2022-2027 (thousand t)
- Exhibit 54: Chart on Offline - Year-over-year growth 2022-2027 (%)
- Exhibit 55: Data Table on Offline - Year-over-year growth 2022-2027 (%)
- 7.4 Online - Market size and forecast 2022-2027
- Exhibit 56: Chart on Online - Market size and forecast 2022-2027 (thousand t)
- Exhibit 57: Data Table on Online - Market size and forecast 2022-2027 (thousand t)
- Exhibit 58: Chart on Online - Year-over-year growth 2022-2027 (%)
- Exhibit 59: Data Table on Online - Year-over-year growth 2022-2027 (%)
- 7.5 Market opportunity by Distribution Channel
- Exhibit 60: Market opportunity by Distribution Channel (thousand t)
- Exhibit 61: Data Table on Market opportunity by Distribution Channel (thousand t)
8 Customer Landscape
- 8.1 Customer landscape overview
- Exhibit 62: Analysis of price sensitivity, lifecycle, customer purchase basket, adoption rates, and purchase criteria
9 Geographic Landscape
- 9.1 Geographic segmentation
- Exhibit 63: Chart on Market share By Geographical Landscape 2022-2027 (%)
- Exhibit 64: Data Table on Market share By Geographical Landscape 2022-2027 (%)
- 9.2 Geographic comparison
- Exhibit 65: Chart on Geographic comparison
- Exhibit 66: Data Table on Geographic comparison
- 9.3 APAC - Market size and forecast 2022-2027
- Exhibit 67: Chart on APAC - Market size and forecast 2022-2027 (thousand t)
- Exhibit 68: Data Table on APAC - Market size and forecast 2022-2027 (thousand t)
- Exhibit 69: Chart on APAC - Year-over-year growth 2022-2027 (%)
- Exhibit 70: Data Table on APAC - Year-over-year growth 2022-2027 (%)
- 9.4 Middle East and Africa - Market size and forecast 2022-2027
- Exhibit 71: Chart on Middle East and Africa - Market size and forecast 2022-2027 (thousand t)
- Exhibit 72: Data Table on Middle East and Africa - Market size and forecast 2022-2027 (thousand t)
- Exhibit 73: Chart on Middle East and Africa - Year-over-year growth 2022-2027 (%)
- Exhibit 74: Data Table on Middle East and Africa - Year-over-year growth 2022-2027 (%)
- 9.5 South America - Market size and forecast 2022-2027
- Exhibit 75: Chart on South America - Market size and forecast 2022-2027 (thousand t)
- Exhibit 76: Data Table on South America - Market size and forecast 2022-2027 (thousand t)
- Exhibit 77: Chart on South America - Year-over-year growth 2022-2027 (%)
- Exhibit 78: Data Table on South America - Year-over-year growth 2022-2027 (%)
- 9.6 North America - Market size and forecast 2022-2027
- Exhibit 79: Chart on North America - Market size and forecast 2022-2027 (thousand t)
- Exhibit 80: Data Table on North America - Market size and forecast 2022-2027 (thousand t)
- Exhibit 81: Chart on North America - Year-over-year growth 2022-2027 (%)
- Exhibit 82: Data Table on North America - Year-over-year growth 2022-2027 (%)
- 9.7 Europe - Market size and forecast 2022-2027
- Exhibit 83: Chart on Europe - Market size and forecast 2022-2027 (thousand t)
- Exhibit 84: Data Table on Europe - Market size and forecast 2022-2027 (thousand t)
- Exhibit 85: Chart on Europe - Year-over-year growth 2022-2027 (%)
- Exhibit 86: Data Table on Europe - Year-over-year growth 2022-2027 (%)
- 9.8 India - Market size and forecast 2022-2027
- Exhibit 87: Chart on India - Market size and forecast 2022-2027 (thousand t)
- Exhibit 88: Data Table on India - Market size and forecast 2022-2027 (thousand t)
- Exhibit 89: Chart on India - Year-over-year growth 2022-2027 (%)
- Exhibit 90: Data Table on India - Year-over-year growth 2022-2027 (%)
- 9.9 Dominican Republic - Market size and forecast 2022-2027
- Exhibit 91: Chart on Dominican Republic - Market size and forecast 2022-2027 (thousand t)
- Exhibit 92: Data Table on Dominican Republic - Market size and forecast 2022-2027 (thousand t)
- Exhibit 93: Chart on Dominican Republic - Year-over-year growth 2022-2027 (%)
- Exhibit 94: Data Table on Dominican Republic - Year-over-year growth 2022-2027 (%)
- 9.10 Brazil - Market size and forecast 2022-2027
- Exhibit 95: Chart on Brazil - Market size and forecast 2022-2027 (thousand t)
- Exhibit 96: Data Table on Brazil - Market size and forecast 2022-2027 (thousand t)
- Exhibit 97: Chart on Brazil - Year-over-year growth 2022-2027 (%)
- Exhibit 98: Data Table on Brazil - Year-over-year growth 2022-2027 (%)
- 9.11 Mexico - Market size and forecast 2022-2027
- Exhibit 99: Chart on Mexico - Market size and forecast 2022-2027 (thousand t)
- Exhibit 100: Data Table on Mexico - Market size and forecast 2022-2027 (thousand t)
- Exhibit 101: Chart on Mexico - Year-over-year growth 2022-2027 (%)
- Exhibit 102: Data Table on Mexico - Year-over-year growth 2022-2027 (%)
- 9.12 Indonesia - Market size and forecast 2022-2027
- Exhibit 103: Chart on Indonesia - Market size and forecast 2022-2027 (thousand t)
- Exhibit 104: Data Table on Indonesia - Market size and forecast 2022-2027 (thousand t)
- Exhibit 105: Chart on Indonesia - Year-over-year growth 2022-2027 (%)
- Exhibit 106: Data Table on Indonesia - Year-over-year growth 2022-2027 (%)
- 9.13 Market opportunity By Geographical Landscape
- Exhibit 107: Market opportunity By Geographical Landscape (thousand t)
- Exhibit 108: Market opportunity By Geographical Landscape (thousand t) - Volume
10 Drivers, Challenges, and Trends
- 10.1 Market drivers
- 10.2 Market challenges
- 10.3 Impact of drivers and challenges
- Exhibit 109: Impact of drivers and challenges in 2022 and 2027
- 10.4 Market trends
11 Vendor Landscape
- 11.1 Overview
- 11.2 Vendor landscape
- Exhibit 110: Overview on Criticality of inputs and Factors of differentiation
- 11.3 Landscape disruption
- Exhibit 111: Overview on factors of disruption
- 11.4 Industry risks
- Exhibit 112: Impact of key risks on business
12 Vendor Analysis
- 12.1 Vendors covered
- Exhibit 113: Vendors covered
- 12.2 Market positioning of vendors
- Exhibit 114: Matrix on vendor position and classification
- 12.3 ABC Fruits
- Exhibit 115: ABC Fruits - Overview
- Exhibit 116: ABC Fruits - Product / Service
- Exhibit 117: ABC Fruits - Key offerings
- 12.4 Brooks Tropicals LLC
- Exhibit 118: Brooks Tropicals LLC - Overview
- Exhibit 119: Brooks Tropicals LLC - Product / Service
- Exhibit 120: Brooks Tropicals LLC - Key offerings
- 12.5 Calavo Growers Inc.
- Exhibit 121: Calavo Growers Inc. - Overview
- Exhibit 122: Calavo Growers Inc. - Business segments
- Exhibit 123: Calavo Growers Inc. - Key news
- Exhibit 124: Calavo Growers Inc. - Key offerings
- Exhibit 125: Calavo Growers Inc. - Segment focus
- 12.6 Galla Foods
- Exhibit 126: Galla Foods - Overview
- Exhibit 127: Galla Foods - Product / Service
- Exhibit 128: Galla Foods - Key offerings
- 12.7 Harvest Fresh Farms
- Exhibit 129: Harvest Fresh Farms - Overview
- Exhibit 130: Harvest Fresh Farms - Product / Service
- Exhibit 131: Harvest Fresh Farms - Key offerings
- 12.8 Riverford Organic Farmers Ltd.
- Exhibit 132: Riverford Organic Farmers Ltd. - Overview
- Exhibit 133: Riverford Organic Farmers Ltd. - Product / Service
- Exhibit 134: Riverford Organic Farmers Ltd. - Key offerings
- 12.9 RK Growers Srl
- Exhibit 135: RK Growers Srl - Overview
- Exhibit 136: RK Growers Srl - Product / Service
- Exhibit 137: RK Growers Srl - Key offerings
- 12.10 Super Starr International
- Exhibit 138: Super Starr International - Overview
- Exhibit 139: Super Starr International - Product / Service
- Exhibit 140: Super Starr International - Key offerings
13 Appendix
- 13.1 Scope of the report
- 13.2 Inclusions and exclusions checklist
- Exhibit 141: Inclusions checklist
- Exhibit 142: Exclusions checklist
- 13.3 Currency conversion rates for US$
- Exhibit 143: Currency conversion rates for US$
- 13.4 Research methodology
- Exhibit 144: Research methodology
- Exhibit 145: Validation techniques employed for market sizing
- Exhibit 146: Information sources
- 13.5 List of abbreviations
- Exhibit 147: List of abbreviations