|
|
市場調査レポート
商品コード
1144252
コンピュータ数値制御ソリューションの世界市場 2022-2026Global Computer Numerical Control Solutions Market 2022-2026 |
||||||
|
|
|||||||
|
● お客様のご希望に応じて、既存データの加工や未掲載情報(例:国別セグメント)の追加などの対応が可能です。 詳細はお問い合わせください。 |
|||||||


| コンピュータ数値制御ソリューションの世界市場 2022-2026 |
|
出版日: 2022年10月12日
発行: TechNavio
ページ情報: 英文 120 Pages
納期: 即納可能
|
- 全表示
- 概要
- 図表
- 目次
当レポートではコンピュータ数値制御ソリューションの市場規模は、2022年から2026年の間に81億3000万米ドルの増加が見込まれ、予測期間中に6.85%のCAGRで成長すると予測しています。当レポートでは、コンピュータ数値制御ソリューション市場の全体分析、市場規模と予測、動向、成長促進要因・課題、さらに約25社のベンダーを網羅したベンダー分析を行っています。
現在の世界の市場動向と促進要因、市場環境全体に関する最新分析を提供しています。
市場は、産業界におけるサーボベースシステムの使用の増加、コンピュータ数値制御ソリューションの人気の高まり、成長態勢にあるダイナミックな金属加工市場によって牽引されています。
本調査では、人工知能とシステム統合の応用が、今後数年間のコンピュータ数値制御ソリューション市場の成長を促進する主要な理由の1つであると特定しています。また、金属積層造形とCNCシステムの進歩は、市場の相当な需要につながるでしょう。
目次
第1章 エグゼクティブサマリー
- 市場概要
第2章 市場情勢
- 市場エコシステム
第3章 市場規模
- 市場の定義
- 市場セグメント分析
- 市場規模 2021
- 市場の見通し:2021-2026年の予測
第4章 ファイブフォース分析
- ファイブフォースの要約
- 買い手の交渉力
- 供給企業の交渉力
- 新規参入業者の脅威
- 代替品の脅威
- 競争の脅威
- 市況
第5章 市場セグメンテーション:エンドユーザー別
- 市場内訳
- エンドユーザー別比較
- 自動車 - 市場規模と予測 2021-2026
- 航空宇宙 - 市場規模と予測 2021-2026
- 産業機械 - 市場規模と予測 2021-2026
- その他 - 市場規模と予測 2021-2026
- エンドユーザー別の市場機会
第6章 市場セグメンテーション:ソリューション別
- 市場内訳
- ソリューション別比較
- サーボドライブ - 市場規模と予測 2021-2026
- サーボモーター - 市場規模と予測 2021-2026
- コントローラー - 市場規模と予測 2021-2026
- ソリューション別の市場機会
第7章 顧客情勢
- 顧客情勢の概要
第8章 地域別情勢
- 地域別セグメンテーション
- 地域別比較
- APAC - 市場規模と予測 2021-2026
- 北米 - 市場規模と予測 2021-2026
- 欧州 - 市場規模と予測 2021-2026
- 南米 - 市場規模と予測 2021-2026
- 中東およびアフリカ - 市場規模と予測 2021-2026
- 中国 - 市場規模と予測 2021-2026
- 米国 - 市場規模と予測 2021-2026
- 日本 - 市場規模と予測 2021-2026
- ドイツ - 市場規模と予測 2021-2026
- 韓国 - 市場規模と予測 2021-2026
- 地域情勢別の市場機会
第9章 促進要因、課題、および動向
- 市場促進要因
- 市場の課題
- 促進要因と課題の影響
- 市場動向
第10章 ベンダー情勢
- 概要
- ベンダー情勢
- 混乱の状況
- 業界のリスク
第11章 ベンダー分析
- 対象ベンダー
- ベンダーの市場ポジショニング
- DR JOHANNES HEIDENHAIN GmbH
- FANUC Corp.
- KEBA AG
- Makino Milling Machine Co. Ltd.
- Mitsubishi Electric Corp.
- MONDRAGON Corp.
- NUM AG
- Okuma Corp.
- Robert Bosch GmbH
- Siemens AG
第12章 付録
Exhibits:
- Exhibits1: Executive Summary - Chart on Market Overview
- Exhibits2: Executive Summary - Data Table on Market Overview
- Exhibits3: Executive Summary - Chart on Global Market Characteristics
- Exhibits4: Executive Summary - Chart on Market By Geographical Landscape
- Exhibits5: Executive Summary - Chart on Market Segmentation by End-user
- Exhibits6: Executive Summary - Chart on Market Segmentation by Solution
- Exhibits7: Executive Summary - Chart on Incremental Growth
- Exhibits8: Executive Summary - Data Table on Incremental Growth
- Exhibits9: Executive Summary - Chart on Vendor Market Positioning
- Exhibits10: Parent market
- Exhibits11: Market Characteristics
- Exhibits12: Offerings of vendors included in the market definition
- Exhibits13: Market segments
- Exhibits14: Chart on Global - Market size and forecast 2021-2026 ($ million)
- Exhibits15: Data Table on Global - Market size and forecast 2021-2026 ($ million)
- Exhibits16: Chart on Global Market: Year-over-year growth 2021-2026 (%)
- Exhibits17: Data Table on Global Market: Year-over-year growth 2021-2026 (%)
- Exhibits18: Data table on Vandor Market Share Market share of Vendors 2021
- Exhibits19: Five forces analysis - Comparison between2021 and 2026
- Exhibits20: Chart on Bargaining power of buyers - Impact of key factors 2021 and 2026
- Exhibits21: Bargaining power of suppliers - Impact of key factors in 2021 and 2026
- Exhibits22: Threat of new entrants - Impact of key factors in 2021 and 2026
- Exhibits23: Threat of substitutes - Impact of key factors in 2021 and 2026
- Exhibits24: Threat of rivalry - Impact of key factors in 2021 and 2026
- Exhibits25: Chart on Market condition - Five forces 2021 and 2026
- Exhibits26: Chart on End-user - Market share 2021-2026 (%)
- Exhibits27: Data Table on End-user - Market share 2021-2026 (%)
- Exhibits28: Chart on Comparison by End-user
- Exhibits29: Data Table on Comparison by End-user
- Exhibits30: Chart on Automotive - Market size and forecast 2021-2026 ($ million)
- Exhibits31: Data Table on Automotive - Market size and forecast 2021-2026 ($ million)
- Exhibits32: Chart on Automotive - Year-over-year growth 2021-2026 (%)
- Exhibits33: Data Table on Automotive - Year-over-year growth 2021-2026 (%)
- Exhibits34: Chart on Aerospace - Market size and forecast 2021-2026 ($ million)
- Exhibits35: Data Table on Aerospace - Market size and forecast 2021-2026 ($ million)
- Exhibits36: Chart on Aerospace - Year-over-year growth 2021-2026 (%)
- Exhibits37: Data Table on Aerospace - Year-over-year growth 2021-2026 (%)
- Exhibits38: Chart on Industrial machinery - Market size and forecast 2021-2026 ($ million)
- Exhibits39: Data Table on Industrial machinery - Market size and forecast 2021-2026 ($ million)
- Exhibits40: Chart on Industrial machinery - Year-over-year growth 2021-2026 (%)
- Exhibits41: Data Table on Industrial machinery - Year-over-year growth 2021-2026 (%)
- Exhibits42: Chart on Others - Market size and forecast 2021-2026 ($ million)
- Exhibits43: Data Table on Others - Market size and forecast 2021-2026 ($ million)
- Exhibits44: Chart on Others - Year-over-year growth 2021-2026 (%)
- Exhibits45: Data Table on Others - Year-over-year growth 2021-2026 (%)
- Exhibits46: Market opportunity by End-user ($ million)
- Exhibits47: Chart on Solution - Market share 2021-2026 (%)
- Exhibits48: Data Table on Solution - Market share 2021-2026 (%)
- Exhibits49: Chart on Comparison by Solution
- Exhibits50: Data Table on Comparison by Solution
- Exhibits51: Chart on Servo drives - Market size and forecast 2021-2026 ($ million)
- Exhibits52: Data Table on Servo drives - Market size and forecast 2021-2026 ($ million)
- Exhibits53: Chart on Servo drives - Year-over-year growth 2021-2026 (%)
- Exhibits54: Data Table on Servo drives - Year-over-year growth 2021-2026 (%)
- Exhibits55: Chart on Servo motors - Market size and forecast 2021-2026 ($ million)
- Exhibits56: Data Table on Servo motors - Market size and forecast 2021-2026 ($ million)
- Exhibits57: Chart on Servo motors - Year-over-year growth 2021-2026 (%)
- Exhibits58: Data Table on Servo motors - Year-over-year growth 2021-2026 (%)
- Exhibits59: Chart on Controllers - Market size and forecast 2021-2026 ($ million)
- Exhibits60: Data Table on Controllers - Market size and forecast 2021-2026 ($ million)
- Exhibits61: Chart on Controllers - Year-over-year growth 2021-2026 (%)
- Exhibits62: Data Table on Controllers - Year-over-year growth 2021-2026 (%)
- Exhibits63: Market opportunity by Solution ($ million)
- Exhibits64: Analysis of price sensitivity, lifecycle, customer purchase basket, adoption rates, and purchase criteria
- Exhibits65: Chart on Market share By Geographical Landscape 2021-2026 (%)
- Exhibits66: Data Table on Market share By Geographical Landscape 2021-2026 (%)
- Exhibits67: Chart on Geographic comparison
- Exhibits68: Data Table on Geographic comparison
- Exhibits69: Chart on APAC - Market size and forecast 2021-2026 ($ million)
- Exhibits70: Data Table on APAC - Market size and forecast 2021-2026 ($ million)
- Exhibits71: Chart on APAC - Year-over-year growth 2021-2026 (%)
- Exhibits72: Data Table on APAC - Year-over-year growth 2021-2026 (%)
- Exhibits73: Chart on North America - Market size and forecast 2021-2026 ($ million)
- Exhibits74: Data Table on North America - Market size and forecast 2021-2026 ($ million)
- Exhibits75: Chart on North America - Year-over-year growth 2021-2026 (%)
- Exhibits76: Data Table on North America - Year-over-year growth 2021-2026 (%)
- Exhibits77: Chart on Europe - Market size and forecast 2021-2026 ($ million)
- Exhibits78: Data Table on Europe - Market size and forecast 2021-2026 ($ million)
- Exhibits79: Chart on Europe - Year-over-year growth 2021-2026 (%)
- Exhibits80: Data Table on Europe - Year-over-year growth 2021-2026 (%)
- Exhibits81: Chart on South America - Market size and forecast 2021-2026 ($ million)
- Exhibits82: Data Table on South America - Market size and forecast 2021-2026 ($ million)
- Exhibits83: Chart on South America - Year-over-year growth 2021-2026 (%)
- Exhibits84: Data Table on South America - Year-over-year growth 2021-2026 (%)
- Exhibits85: Chart on Middle East and Africa - Market size and forecast 2021-2026 ($ million)
- Exhibits86: Data Table on Middle East and Africa - Market size and forecast 2021-2026 ($ million)
- Exhibits87: Chart on Middle East and Africa - Year-over-year growth 2021-2026 (%)
- Exhibits88: Data Table on Middle East and Africa - Year-over-year growth 2021-2026 (%)
- Exhibits89: Chart on China - Market size and forecast 2021-2026 ($ million)
- Exhibits90: Data Table on China - Market size and forecast 2021-2026 ($ million)
- Exhibits91: Chart on China - Year-over-year growth 2021-2026 (%)
- Exhibits92: Data Table on China - Year-over-year growth 2021-2026 (%)
- Exhibits93: Chart on US - Market size and forecast 2021-2026 ($ million)
- Exhibits94: Data Table on US - Market size and forecast 2021-2026 ($ million)
- Exhibits95: Chart on US - Year-over-year growth 2021-2026 (%)
- Exhibits96: Data Table on US - Year-over-year growth 2021-2026 (%)
- Exhibits97: Chart on Japan - Market size and forecast 2021-2026 ($ million)
- Exhibits98: Data Table on Japan - Market size and forecast 2021-2026 ($ million)
- Exhibits99: Chart on Japan - Year-over-year growth 2021-2026 (%)
- Exhibits100: Data Table on Japan - Year-over-year growth 2021-2026 (%)
- Exhibits101: Chart on Germany - Market size and forecast 2021-2026 ($ million)
- Exhibits102: Data Table on Germany - Market size and forecast 2021-2026 ($ million)
- Exhibits103: Chart on Germany - Year-over-year growth 2021-2026 (%)
- Exhibits104: Data Table on Germany - Year-over-year growth 2021-2026 (%)
- Exhibits105: Chart on South Korea - Market size and forecast 2021-2026 ($ million)
- Exhibits106: Data Table on South Korea - Market size and forecast 2021-2026 ($ million)
- Exhibits107: Chart on South Korea - Year-over-year growth 2021-2026 (%)
- Exhibits108: Data Table on South Korea - Year-over-year growth 2021-2026 (%)
- Exhibits109: Market opportunity By Geographical Landscape ($ million)
- Exhibits110: Impact of drivers and challenges in 2021 and 2026
- Exhibits111: Overview on Criticality of inputs and Factors of differentiation
- Exhibits112: Overview on factors of disruption
- Exhibits113: Impact of key risks on business
- Exhibits114: Vendors covered
- Exhibits115: Matrix on vendor position and classification
- Exhibits116: DR JOHANNES HEIDENHAIN GmbH - Overview
- Exhibits117: DR JOHANNES HEIDENHAIN GmbH - Product / Service
- Exhibits118: DR JOHANNES HEIDENHAIN GmbH - Key offerings
- Exhibits119: FANUC Corp. - Overview
- Exhibits120: FANUC Corp. - Product / Service
- Exhibits121: FANUC Corp. - Key offerings
- Exhibits122: KEBA AG - Overview
- Exhibits123: KEBA AG - Product / Service
- Exhibits124: KEBA AG - Key offerings
- Exhibits125: Makino Milling Machine Co. Ltd. - Overview
- Exhibits126: Makino Milling Machine Co. Ltd. - Product / Service
- Exhibits127: Makino Milling Machine Co. Ltd. - Key offerings
- Exhibits128: Mitsubishi Electric Corp. - Overview
- Exhibits129: Mitsubishi Electric Corp. - Business segments
- Exhibits130: Mitsubishi Electric Corp. - Key news
- Exhibits131: Mitsubishi Electric Corp. - Key offerings
- Exhibits132: Mitsubishi Electric Corp. - Segment focus
- Exhibits133: MONDRAGON Corp. - Overview
- Exhibits134: MONDRAGON Corp. - Business segments
- Exhibits135: MONDRAGON Corp. - Key offerings
- Exhibits136: MONDRAGON Corp. - Segment focus
- Exhibits137: NUM AG - Overview
- Exhibits138: NUM AG - Product / Service
- Exhibits139: NUM AG - Key offerings
- Exhibits140: Okuma Corp. - Overview
- Exhibits141: Okuma Corp. - Business segments
- Exhibits142: Okuma Corp. - Key offerings
- Exhibits143: Okuma Corp. - Segment focus
- Exhibits144: Robert Bosch GmbH - Overview
- Exhibits145: Robert Bosch GmbH - Business segments
- Exhibits146: Robert Bosch GmbH - Key news
- Exhibits147: Robert Bosch GmbH - Key offerings
- Exhibits148: Robert Bosch GmbH - Segment focus
- Exhibits149: Siemens AG - Overview
- Exhibits150: Siemens AG - Business segments
- Exhibits151: Siemens AG - Key news
- Exhibits152: Siemens AG - Key offerings
- Exhibits153: Siemens AG - Segment focus
- Exhibits154: Inclusions checklist
- Exhibits155: Exclusions checklist
- Exhibits156: Currency conversion rates for US$
- Exhibits157: Research methodology
- Exhibits158: Validation techniques employed for market sizing
- Exhibits159: Information sources
- Exhibits160: List of abbreviations
Technavio has been monitoring the computer numerical control solutions market and it is poised to grow by $8.13 bn during 2022-2026, accelerating at a CAGR of 6.85% during the forecast period. Our report on the computer numerical control solutions market provides a holistic analysis, market size and forecast, trends, growth drivers, and challenges, as well as vendor analysis covering around 25 vendors.
The report offers an up-to-date analysis regarding the current global market scenario, latest trends and drivers, and the overall market environment. The market is driven by increased use of servo-based systems in industries, growing popularity of computer numerical control solutions, and dynamic metal fabrication market poised for growth.
The computer numerical control solutions market analysis includes the end-user and solution segments and geographic landscape.
Technavio's computer numerical control solutions market is segmented as below:
By End-user
- Automotive
- Aerospace
- Industrial machinery
- Others
By Solution
- Servo drives
- Servo motors
- Controllers
By Geographical Landscape
- APAC
- North America
- Europe
- South America
- Middle East and Africa
This study identifies the application of artificial intelligence and system integration as one of the prime reasons driving the computer numerical control solutions market growth during the next few years. Also, metal additive manufacturing and advancement in CNC systems will lead to sizable demand in the market.
Technavio presents a detailed picture of the market by the way of study, synthesis, and summation of data from multiple sources by an analysis of key parameters. Our report on the computer numerical control solutions market covers the following areas:
- Computer numerical control solutions market sizing
- Computer numerical control solutions market forecast
- Computer numerical control solutions market industry analysis
Technavio's robust vendor analysis is designed to help clients improve their market position, and in line with this, this report provides a detailed analysis of several leading computer numerical control solutions market vendors that include Delta Electronics Inc., DMG MORI Co Ltd, DR JOHANNES HEIDENHAIN GmbH, FANUC Corp., Haas Automation Inc., Hurco Companies Inc., KEBA AG, Makino Milling Machine Co. Ltd., Micromatic Machine Tools Pvt. Ltd., Minitech Machinery Corp., Mitsubishi Electric Corp., MONDRAGON Corp., NUM AG, Okuma Corp., Robert Bosch GmbH, Rockwell Automation Inc., Sandvik AB, Siemens AG, SIEB and MEYER AG, and Yaskawa Electric Corp. Also, the computer numerical control solutions market analysis report includes information on upcoming trends and challenges that will influence market growth. This is to help companies strategize and leverage all forthcoming growth opportunities.
The study was conducted using an objective combination of primary and secondary information including inputs from key participants in the industry. The report contains a comprehensive market and vendor landscape in addition to an analysis of the key vendors.
Technavio presents a detailed picture of the market by the way of study, synthesis, and summation of data from multiple sources by an analysis of key parameters such as profit, pricing, competition, and promotions. It presents various market facets by identifying the key industry influencers. The data presented is comprehensive, reliable, and a result of extensive research - both primary and secondary. Technavio's market research reports provide a complete competitive landscape and an in-depth vendor selection methodology and analysis using qualitative and quantitative research to forecast accurate market growth.
Table of Contents
1 Executive Summary
- 1.1 Market overview
- Exhibit 01: Executive Summary - Chart on Market Overview
- Exhibit 02: Executive Summary - Data Table on Market Overview
- Exhibit 03: Executive Summary - Chart on Global Market Characteristics
- Exhibit 04: Executive Summary - Chart on Market By Geographical Landscape
- Exhibit 05: Executive Summary - Chart on Market Segmentation by End-user
- Exhibit 06: Executive Summary - Chart on Market Segmentation by Solution
- Exhibit 07: Executive Summary - Chart on Incremental Growth
- Exhibit 08: Executive Summary - Data Table on Incremental Growth
- Exhibit 09: Executive Summary - Chart on Vendor Market Positioning
2 Market Landscape
- 2.1 Market ecosystem
- Exhibit 10: Parent market
- Exhibit 11: Market Characteristics
3 Market Sizing
- 3.1 Market definition
- Exhibit 12: Offerings of vendors included in the market definition
- 3.2 Market segment analysis
- Exhibit 13: Market segments
- 3.3 Market size 2021
- 3.4 Market outlook: Forecast for 2021-2026
- Exhibit 14: Chart on Global - Market size and forecast 2021-2026 ($ million)
- Exhibit 15: Data Table on Global - Market size and forecast 2021-2026 ($ million)
- Exhibit 16: Chart on Global Market: Year-over-year growth 2021-2026 (%)
- Exhibit 17: Data Table on Global Market: Year-over-year growth 2021-2026 (%)
4 Five Forces Analysis
- 4.1 Five forces summary
- Exhibit 18: Five forces analysis - Comparison between 2021 and 2026
- 4.2 Bargaining power of buyers
- Exhibit 19: Chart on Bargaining power of buyers - Impact of key factors 2021 and 2026
- 4.3 Bargaining power of suppliers
- Exhibit 20: Bargaining power of suppliers - Impact of key factors in 2021 and 2026
- 4.4 Threat of new entrants
- Exhibit 21: Threat of new entrants - Impact of key factors in 2021 and 2026
- 4.5 Threat of substitutes
- Exhibit 22: Threat of substitutes - Impact of key factors in 2021 and 2026
- 4.6 Threat of rivalry
- Exhibit 23: Threat of rivalry - Impact of key factors in 2021 and 2026
- 4.7 Market condition
- Exhibit 24: Chart on Market condition - Five forces 2021 and 2026
5 Market Segmentation by End-user
- 5.1 Market segments
- Exhibit 25: Chart on End-user - Market share 2021-2026 (%)
- Exhibit 26: Data Table on End-user - Market share 2021-2026 (%)
- 5.2 Comparison by End-user
- Exhibit 27: Chart on Comparison by End-user
- Exhibit 28: Data Table on Comparison by End-user
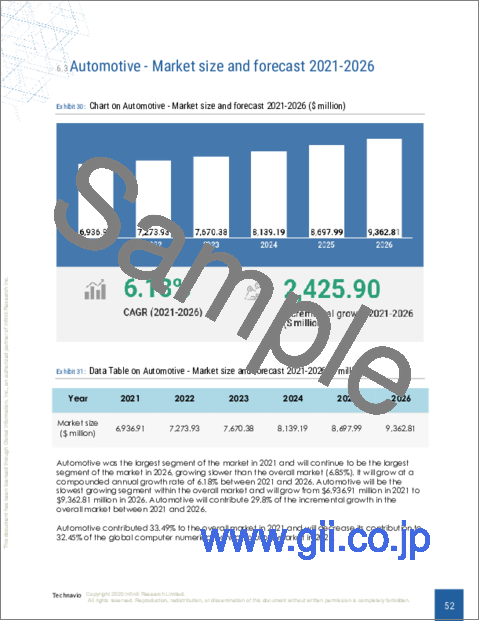
- 5.3 Automotive - Market size and forecast 2021-2026
- Exhibit 29: Chart on Automotive - Market size and forecast 2021-2026 ($ million)
- Exhibit 30: Data Table on Automotive - Market size and forecast 2021-2026 ($ million)
- Exhibit 31: Chart on Automotive - Year-over-year growth 2021-2026 (%)
- Exhibit 32: Data Table on Automotive - Year-over-year growth 2021-2026 (%)
- 5.4 Aerospace - Market size and forecast 2021-2026
- Exhibit 33: Chart on Aerospace - Market size and forecast 2021-2026 ($ million)
- Exhibit 34: Data Table on Aerospace - Market size and forecast 2021-2026 ($ million)
- Exhibit 35: Chart on Aerospace - Year-over-year growth 2021-2026 (%)
- Exhibit 36: Data Table on Aerospace - Year-over-year growth 2021-2026 (%)
- 5.5 Industrial machinery - Market size and forecast 2021-2026
- Exhibit 37: Chart on Industrial machinery - Market size and forecast 2021-2026 ($ million)
- Exhibit 38: Data Table on Industrial machinery - Market size and forecast 2021-2026 ($ million)
- Exhibit 39: Chart on Industrial machinery - Year-over-year growth 2021-2026 (%)
- Exhibit 40: Data Table on Industrial machinery - Year-over-year growth 2021-2026 (%)
- 5.6 Others - Market size and forecast 2021-2026
- Exhibit 41: Chart on Others - Market size and forecast 2021-2026 ($ million)
- Exhibit 42: Data Table on Others - Market size and forecast 2021-2026 ($ million)
- Exhibit 43: Chart on Others - Year-over-year growth 2021-2026 (%)
- Exhibit 44: Data Table on Others - Year-over-year growth 2021-2026 (%)
- 5.7 Market opportunity by End-user
- Exhibit 45: Market opportunity by End-user ($ million)
6 Market Segmentation by Solution
- 6.1 Market segments
- Exhibit 46: Chart on Solution - Market share 2021-2026 (%)
- Exhibit 47: Data Table on Solution - Market share 2021-2026 (%)
- 6.2 Comparison by Solution
- Exhibit 48: Chart on Comparison by Solution
- Exhibit 49: Data Table on Comparison by Solution
- 6.3 Servo drives - Market size and forecast 2021-2026
- Exhibit 50: Chart on Servo drives - Market size and forecast 2021-2026 ($ million)
- Exhibit 51: Data Table on Servo drives - Market size and forecast 2021-2026 ($ million)
- Exhibit 52: Chart on Servo drives - Year-over-year growth 2021-2026 (%)
- Exhibit 53: Data Table on Servo drives - Year-over-year growth 2021-2026 (%)
- 6.4 Servo motors - Market size and forecast 2021-2026
- Exhibit 54: Chart on Servo motors - Market size and forecast 2021-2026 ($ million)
- Exhibit 55: Data Table on Servo motors - Market size and forecast 2021-2026 ($ million)
- Exhibit 56: Chart on Servo motors - Year-over-year growth 2021-2026 (%)
- Exhibit 57: Data Table on Servo motors - Year-over-year growth 2021-2026 (%)
- 6.5 Controllers - Market size and forecast 2021-2026
- Exhibit 58: Chart on Controllers - Market size and forecast 2021-2026 ($ million)
- Exhibit 59: Data Table on Controllers - Market size and forecast 2021-2026 ($ million)
- Exhibit 60: Chart on Controllers - Year-over-year growth 2021-2026 (%)
- Exhibit 61: Data Table on Controllers - Year-over-year growth 2021-2026 (%)
- 6.6 Market opportunity by Solution
- Exhibit 62: Market opportunity by Solution ($ million)
7 Customer Landscape
- 7.1 Customer landscape overview
- Exhibit 63: Analysis of price sensitivity, lifecycle, customer purchase basket, adoption rates, and purchase criteria
8 Geographic Landscape
- 8.1 Geographic segmentation
- Exhibit 64: Chart on Market share By Geographical Landscape 2021-2026 (%)
- Exhibit 65: Data Table on Market share By Geographical Landscape 2021-2026 (%)
- 8.2 Geographic comparison
- Exhibit 66: Chart on Geographic comparison
- Exhibit 67: Data Table on Geographic comparison
- 8.3 APAC - Market size and forecast 2021-2026
- Exhibit 68: Chart on APAC - Market size and forecast 2021-2026 ($ million)
- Exhibit 69: Data Table on APAC - Market size and forecast 2021-2026 ($ million)
- Exhibit 70: Chart on APAC - Year-over-year growth 2021-2026 (%)
- Exhibit 71: Data Table on APAC - Year-over-year growth 2021-2026 (%)
- 8.4 North America - Market size and forecast 2021-2026
- Exhibit 72: Chart on North America - Market size and forecast 2021-2026 ($ million)
- Exhibit 73: Data Table on North America - Market size and forecast 2021-2026 ($ million)
- Exhibit 74: Chart on North America - Year-over-year growth 2021-2026 (%)
- Exhibit 75: Data Table on North America - Year-over-year growth 2021-2026 (%)
- 8.5 Europe - Market size and forecast 2021-2026
- Exhibit 76: Chart on Europe - Market size and forecast 2021-2026 ($ million)
- Exhibit 77: Data Table on Europe - Market size and forecast 2021-2026 ($ million)
- Exhibit 78: Chart on Europe - Year-over-year growth 2021-2026 (%)
- Exhibit 79: Data Table on Europe - Year-over-year growth 2021-2026 (%)
- 8.6 South America - Market size and forecast 2021-2026
- Exhibit 80: Chart on South America - Market size and forecast 2021-2026 ($ million)
- Exhibit 81: Data Table on South America - Market size and forecast 2021-2026 ($ million)
- Exhibit 82: Chart on South America - Year-over-year growth 2021-2026 (%)
- Exhibit 83: Data Table on South America - Year-over-year growth 2021-2026 (%)
- 8.7 Middle East and Africa - Market size and forecast 2021-2026
- Exhibit 84: Chart on Middle East and Africa - Market size and forecast 2021-2026 ($ million)
- Exhibit 85: Data Table on Middle East and Africa - Market size and forecast 2021-2026 ($ million)
- Exhibit 86: Chart on Middle East and Africa - Year-over-year growth 2021-2026 (%)
- Exhibit 87: Data Table on Middle East and Africa - Year-over-year growth 2021-2026 (%)
- 8.8 China - Market size and forecast 2021-2026
- Exhibit 88: Chart on China - Market size and forecast 2021-2026 ($ million)
- Exhibit 89: Data Table on China - Market size and forecast 2021-2026 ($ million)
- Exhibit 90: Chart on China - Year-over-year growth 2021-2026 (%)
- Exhibit 91: Data Table on China - Year-over-year growth 2021-2026 (%)
- 8.9 US - Market size and forecast 2021-2026
- Exhibit 92: Chart on US - Market size and forecast 2021-2026 ($ million)
- Exhibit 93: Data Table on US - Market size and forecast 2021-2026 ($ million)
- Exhibit 94: Chart on US - Year-over-year growth 2021-2026 (%)
- Exhibit 95: Data Table on US - Year-over-year growth 2021-2026 (%)
- 8.10 Japan - Market size and forecast 2021-2026
- Exhibit 96: Chart on Japan - Market size and forecast 2021-2026 ($ million)
- Exhibit 97: Data Table on Japan - Market size and forecast 2021-2026 ($ million)
- Exhibit 98: Chart on Japan - Year-over-year growth 2021-2026 (%)
- Exhibit 99: Data Table on Japan - Year-over-year growth 2021-2026 (%)
- 8.11 Germany - Market size and forecast 2021-2026
- Exhibit 100: Chart on Germany - Market size and forecast 2021-2026 ($ million)
- Exhibit 101: Data Table on Germany - Market size and forecast 2021-2026 ($ million)
- Exhibit 102: Chart on Germany - Year-over-year growth 2021-2026 (%)
- Exhibit 103: Data Table on Germany - Year-over-year growth 2021-2026 (%)
- 8.12 South Korea - Market size and forecast 2021-2026
- Exhibit 104: Chart on South Korea - Market size and forecast 2021-2026 ($ million)
- Exhibit 105: Data Table on South Korea - Market size and forecast 2021-2026 ($ million)
- Exhibit 106: Chart on South Korea - Year-over-year growth 2021-2026 (%)
- Exhibit 107: Data Table on South Korea - Year-over-year growth 2021-2026 (%)
- 8.13 Market opportunity By Geographical Landscape
- Exhibit 108: Market opportunity By Geographical Landscape ($ million)
9 Drivers, Challenges, and Trends
- 9.1 Market drivers
- 9.2 Market challenges
- 9.3 Impact of drivers and challenges
- Exhibit 109: Impact of drivers and challenges in 2021 and 2026
- 9.4 Market trends
10 Vendor Landscape
- 10.1 Overview
- 10.2 Vendor landscape
- Exhibit 110: Overview on Criticality of inputs and Factors of differentiation
- 10.3 Landscape disruption
- Exhibit 111: Overview on factors of disruption
- 10.4 Industry risks
- Exhibit 112: Impact of key risks on business
11 Vendor Analysis
- 11.1 Vendors covered
- Exhibit 113: Vendors covered
- 11.2 Market positioning of vendors
- Exhibit 114: Matrix on vendor position and classification
- 11.3 DR JOHANNES HEIDENHAIN GmbH
- Exhibit 115: DR JOHANNES HEIDENHAIN GmbH - Overview
- Exhibit 116: DR JOHANNES HEIDENHAIN GmbH - Product / Service
- Exhibit 117: DR JOHANNES HEIDENHAIN GmbH - Key offerings
- 11.4 FANUC Corp.
- Exhibit 118: FANUC Corp. - Overview
- Exhibit 119: FANUC Corp. - Product / Service
- Exhibit 120: FANUC Corp. - Key offerings
- 11.5 KEBA AG
- Exhibit 121: KEBA AG - Overview
- Exhibit 122: KEBA AG - Product / Service
- Exhibit 123: KEBA AG - Key offerings
- 11.6 Makino Milling Machine Co. Ltd.
- Exhibit 124: Makino Milling Machine Co. Ltd. - Overview
- Exhibit 125: Makino Milling Machine Co. Ltd. - Product / Service
- Exhibit 126: Makino Milling Machine Co. Ltd. - Key offerings
- 11.7 Mitsubishi Electric Corp.
- Exhibit 127: Mitsubishi Electric Corp. - Overview
- Exhibit 128: Mitsubishi Electric Corp. - Business segments
- Exhibit 129: Mitsubishi Electric Corp. - Key news
- Exhibit 130: Mitsubishi Electric Corp. - Key offerings
- Exhibit 131: Mitsubishi Electric Corp. - Segment focus
- 11.8 MONDRAGON Corp.
- Exhibit 132: MONDRAGON Corp. - Overview
- Exhibit 133: MONDRAGON Corp. - Business segments
- Exhibit 134: MONDRAGON Corp. - Key offerings
- Exhibit 135: MONDRAGON Corp. - Segment focus
- 11.9 NUM AG
- Exhibit 136: NUM AG - Overview
- Exhibit 137: NUM AG - Product / Service
- Exhibit 138: NUM AG - Key offerings
- 11.10 Okuma Corp.
- Exhibit 139: Okuma Corp. - Overview
- Exhibit 140: Okuma Corp. - Business segments
- Exhibit 141: Okuma Corp. - Key offerings
- Exhibit 142: Okuma Corp. - Segment focus
- 11.11 Robert Bosch GmbH
- Exhibit 143: Robert Bosch GmbH - Overview
- Exhibit 144: Robert Bosch GmbH - Business segments
- Exhibit 145: Robert Bosch GmbH - Key news
- Exhibit 146: Robert Bosch GmbH - Key offerings
- Exhibit 147: Robert Bosch GmbH - Segment focus
- 11.12 Siemens AG
- Exhibit 148: Siemens AG - Overview
- Exhibit 149: Siemens AG - Business segments
- Exhibit 150: Siemens AG - Key news
- Exhibit 151: Siemens AG - Key offerings
- Exhibit 152: Siemens AG - Segment focus
12 Appendix
- 12.1 Scope of the report
- 12.2 Inclusions and exclusions checklist
- Exhibit 153: Inclusions checklist
- Exhibit 154: Exclusions checklist
- 12.3 Currency conversion rates for US$
- Exhibit 155: Currency conversion rates for US$
- 12.4 Research methodology
- Exhibit 156: Research methodology
- Exhibit 157: Validation techniques employed for market sizing
- Exhibit 158: Information sources
- 12.5 List of abbreviations
- Exhibit 159: List of abbreviations