|
|
市場調査レポート
商品コード
1122243
プラスチック包装の市場規模、シェア、動向分析レポート:製品別(リジッド、フレキシブル)、技術別(射出成形、押出、ブロー成形、熱成形)、用途別(食品&飲料)、およびセグメント別予測、2022年~2030年Plastic Packaging Market Size, Share & Trends Analysis Report By Product (Rigid, Flexible), By Technology (Injection Molding, Extrusion, Blow Molding, Thermoforming), By Application (Food & Beverage), and Segment Forecasts, 2022 - 2030 |
||||||
|
|
|||||||
|
● お客様のご希望に応じて、既存データの加工や未掲載情報(例:国別セグメント)の追加などの対応が可能です。 詳細はお問い合わせください。 |
|||||||


| プラスチック包装の市場規模、シェア、動向分析レポート:製品別(リジッド、フレキシブル)、技術別(射出成形、押出、ブロー成形、熱成形)、用途別(食品&飲料)、およびセグメント別予測、2022年~2030年 |
|
出版日: 2022年08月02日
発行: Grand View Research
ページ情報: 英文 213 Pages
納期: 2~10営業日
|
- 全表示
- 概要
- 図表
- 目次
プラスチック包装市場の成長と動向
グランドビューリサーチ社の最新レポートによると、世界のプラスチック包装ング市場規模は2030年までに4,923億米ドルに達すると予測されています。2022年から2030年までのCAGRは4.2%で拡大する見込みです。飲食品、パーソナルケア、産業、医薬品分野の急成長に加え、組織小売業やeリテールの世界の浸透が市場の成長を後押しすると予想されます。
低密度ポリエチレン(LDPE)、ポリプロピレン(PP)、高密度ポリエチレン(HDPE)、ポリエチレンテレフタレート(PET)は、水分に対する強いバリア性、低コスト、軽量、幅広い機能性により、ボトルやジャー、トレイや容器、ラップやフィルム、ポーチなどのパッケージ製品の製造に最も広く使用されている材料です。持続可能な製品に対する需要の高まりにより、プラスチック包装製品の製造に再生プラスチック樹脂を使用するメーカーが増加しています。
食品・飲料業界は、市場の最大の収益シェアを占めています。世界的に見ると、ライフスタイルの変化により、1回で食べきることができる製品がイントロダクションとして導入され、過去数年間のプラスチック包装ングの成長に大きく寄与しています。トレイ、コンテナ、タブ、ラップ、パウチ、フィルムなどの製品は、食品・飲料業界において、すぐに食べられる食事、すぐに食べられる便利な製品、冷凍食品、炭酸・非炭酸飲料、スナック食品などの包装に広く利用されています。
プラスチック包装製品は、透明で軽量、高い美観と堅牢なバリア性を備えており、価格も安価です。これらの要因が、主に飲食品業界において製品が広く浸透している要因となっています。さらに、医薬品業界では、ジャー、シリンジ、ブリスター、硬質ボトル、パウチなどの包装製品が、液体、半固体、固体、粉末の製品の包装に使用されています。中国、インド、メキシコ、ブラジルなどの新興諸国における医薬品産業は、国民の平均寿命の延伸に重点を置いているため、大きな成長を遂げています。
さらに、硬質プラスチック製品の需要は、包装された商品や製品に高い保護機能を提供するその適用性と機能性によって牽引されると予測されています。プラスチックは長い高分子鎖でできているため、耐久性に優れ、非常に壊れにくいという特長があります。医薬品の汚染を防ぐためのヘルスケア業界や、飲食品業界からの硬質プラスチック包装に対する需要の高まりは、予測期間中にセグメントの成長を加速させると予測されます。
プラスチック包装市場のレポートハイライト
収益面では、フレキシブルパッケージがリジッドパッケージよりも低コストで持続性が高いことから、食品・飲料メーカーによるパウチやバッグの需要が増加しており、フレキシブルセグメントは予測期間中にCAGR4.5%で上昇すると予測されています。
パウチ、バッグ、フィルムなどのフレキシブル製品の大半が押出技術で生産されていることから、2021年の売上シェアは押出分野が38.8%と最も大きかった
2021年に市場をリードしたのは、食品・飲料の最終用途セグメントで、51.5%以上の収益シェアを占めています。原材料の食品から最終包装されたシングルサーブの食品まで、プラスチック包装製品が広く使用されていることが、主にこのセグメントのシェア拡大に寄与している
2021年の売上高シェアは、リジッド製品部門が最も高いです。飲食品企業によるボトルやジャー、トレイや容器、キャップやクロージャーなどのリジッド製品の高い採用が、2021年の同セグメントの高いシェアに主に起因している
しかし、フレキシブル製品は軽量で、輸送時の占有スペースが少なく、リジッド製品よりも大幅に安価であり、最も重要なのはフレキシブル包装はプラスチック材料の消費量が少なく、リジッド製品と比較してより良い持続可能性プロファイルを示すため、2022年から2030年にかけてフレキシブル製品セグメントが最も高い成長を遂げると予想されます。
アジア太平洋地域は、2021年の世界売上高シェアの43.1%を占め、主要地域市場に浮上しており、中国、インド、日本、韓国などの主要新興国の存在により、2022年から2030年にかけて最高のCAGRを記録すると予想されています。中国とインドは世界最大の消費者層の1つであり、パッケージング製品への大きな需要を生み出しています。
市場は、国際的な大企業と国内の中小企業が存在し、非常に断片的な性質を持っています。主要企業は買収に注力するとともに、エンドユーザー企業を惹きつけるために持続可能なパッケージング・ポートフォリオをますます拡大しています。
目次
第1章 調査手法と範囲
- 市場セグメンテーションと範囲
- 市場の定義
- 情報調達
- 購入したデータベース
- GVRの内部データベース
- 二次情報と第三者の視点
- 1次調査
- 情報分析
- データ分析モデル
- 市場形成とデータ可視化
- データの検証と公開
第2章 エグゼクティブサマリー
- 市場の見通し
- セグメント別見通し
- 競合考察
第3章 市場変数、動向、および範囲
- 市場系統
- 浸透と成長の見通しのマッピング
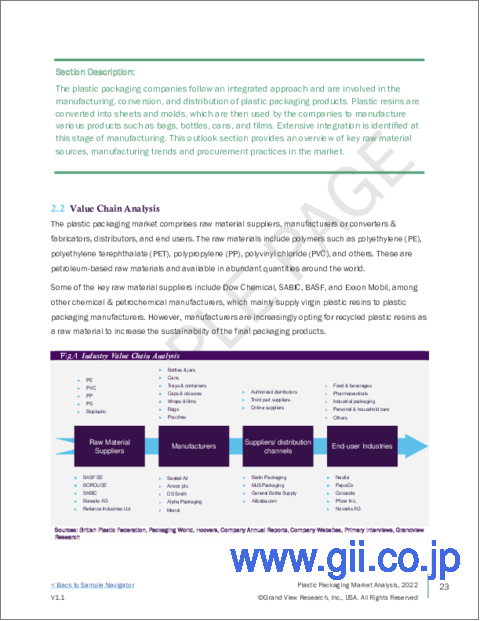
- 業界バリューチェーン分析
- 主要原材料動向分析
- 製造動向
- 販売チャネル分析
- 技術フレームワーク
- 規制の枠組み
- プラスチック包装市場-市場力学
- 市場促進要因分析
- 市場制約分析
- 業界の課題
- ビジネス環境ツール分析:プラスチック包装市場
- ポーターのファイブフォース分析
- 供給企業の交渉力
- 買い手の交渉力
- 代替の脅威
- 新規参入業者の脅威
- 競争企業間の敵対関係
- PESTLE分析
- 政治情勢
- 経済情勢
- 社会情勢
- テクノロジー情勢
- 環境情勢
- 法的情勢
- ポーターのファイブフォース分析
- 主要な戦略的取引と提携
- 市場戦略
- COVID-19の影響
第4章 プラスチック包装市場:製品の推定・動向分析
- 定義と範囲
- プラスチック包装市場:製品変動分析、2021 &2030
- リジッド
- ボトル&ジャー
- 缶
- トレイ&コンテナ
- キャップ&クロージャー
- その他
- フレキシブル
- ラップ&フィルム
- バッグ
- ポーチ
- その他
第5章 プラスチック包装市場:技術推定・動向分析
- プラスチック包装市場:技術動向変動分析、2021 &2030
- 射出成形
- 押し出す
- 中空成形、吹込み成形
- 熱成形
- その他
第6章 プラスチック包装市場:アプリケーションの推定・動向分析
- プラスチック包装市場:アプリケーション変動分析、2021 &2030
- 食品と飲料
- 工業用包装
- 医薬品
- パーソナル&ハウスケア
- その他
第7章 プラスチック包装市場:地域の推定・動向分析
- プラスチック包装市場:地域の変動分析、2021年および2030年
- 北米
- 米国
- カナダ
- メキシコ
- 欧州
- ドイツ
- 英国
- フランス
- イタリア
- スペイン
- アジア太平洋地域
- 中国
- インド
- 日本
- 韓国
- オーストラリア
- 中南米
- ブラジル
- 中東とアフリカ
- 南アフリカ
第8章 競合情勢
- 主要な世界プレーヤー、そのイニシアチブ、および市場への影響
- 主要企業/競合の分類
- ベンダー情勢
- 主要ディストリビューターおよびチャネルパートナーのリスト
- 公開会社
- 会社の市況分析
- 企業の市場シェア/ランキング
- 競合ダッシュボード分析
- 市場の差別化要因
- シナジー分析
- プライベートカンパニー
- 主な新興企業
- 地理的存在
- 会社の市況分析
第9章 企業プロファイル
- Amcor plc
- 会社概要
- 財務実績
- テクノロジーのベンチマーク
- 戦略的イニシアチブ
- Sealed Air
- 会社概要
- 財務実績
- テクノロジーのベンチマーク
- 戦略的イニシアチブ
- Coveris
- 会社概要
- 財務実績
- テクノロジーのベンチマーク
- 戦略的イニシアチブ
- Sonoco Products Company
- 会社概要
- 財務実績
- テクノロジーのベンチマーク
- 戦略的イニシアチブ
- CCL Industries
- 会社概要
- 財務実績
- テクノロジーのベンチマーク
- 戦略的イニシアチブ
- WINPAK LTD
- 会社概要
- 財務実績
- テクノロジーのベンチマーク
- 戦略的イニシアチブ
- Alpha Packaging
- 会社概要
- 財務実績
- テクノロジーのベンチマーク
- 戦略的イニシアチブ
- Berry Global, Inc.
- 会社概要
- 財務実績
- テクノロジーのベンチマーク
- 戦略的イニシアチブ
- Constantia Flexibles
- 会社概要
- 財務実績
- テクノロジーのベンチマーク
- 戦略的イニシアチブ
- Mondi
- 会社概要
- 財務実績
- テクノロジーのベンチマーク
- 戦略的イニシアチブ
List of Tables
- Table 1 Rigid plastic packaging market estimates and forecasts, 2017 - 2030 (USD Billion)
- Table 2 Rigid plastic packaging market estimates and forecasts, from bottles & jars, 2017 - 2030 (USD Billion)
- Table 3 Rigid plastic packaging market estimates and forecasts, from cans, 2017 - 2030 (USD Billion)
- Table 4 Rigid plastic packaging market estimates and forecasts, from trays & containers, 2017 - 2030 (USD Billion)
- Table 5 Rigid plastic packaging market estimates and forecasts, from caps & closures, 2017 - 2030 (USD Billion)
- Table 6 Rigid plastic packaging market estimates and forecasts, from others, 2017 - 2030 (USD Billion)
- Table 7 Flexible plastic packaging market estimates and forecasts, 2017 - 2030 (USD Billion)
- Table 8 Flexible plastic packaging market estimates and forecasts, from wraps & films, 2017 - 2030 (USD Billion)
- Table 9 Flexible plastic packaging market estimates and forecasts, from bags, 2017 - 2030 (USD Billion)
- Table 10 Flexible plastic packaging market estimates and forecasts, from pouches, 2017 - 2030 (USD Billion
- Table 11 Flexible plastic packaging market estimates and forecasts, from others, 2017 - 2030 (USD Billion
- Table 12 Plastic packaging market estimates and forecasts, by injection molding, 2017 - 2030 (USD Billion)
- Table 13 Plastic packaging market estimates and forecasts, by extrusion, 2017 - 2030 (USD Billion)
- Table 14 Plastic packaging market estimates and forecasts, by thermoforming, 2017 - 2030 (USD Billion)
- Table 15 Plastic packaging market estimates and forecasts, by blow molding, 2017 - 2030 (USD Billion)
- Table 16 Plastic packaging market estimates and forecasts, by others, 2017 - 2030 (USD Billion)
- Table 17 Plastic packaging market estimates and forecasts, in food & beverages, 2017 - 2030 (USD Billion)
- Table 18 Plastic packaging market estimates and forecasts, in industrial packaging, 2017 - 2030 (USD Billion)
- Table 19 Plastic packaging market estimates and forecasts, in pharmaceuticals, 2017 - 2030 (USD Billion)
- Table 20 Plastic packaging market estimates and forecasts, in personal & household care, 2017 - 2030 (USD Billion)
- Table 21 Plastic packaging market estimates and forecasts, in others, 2017 - 2030 (USD Billion)
- Table 22 North America plastic packaging market estimates and forecasts, 2017 - 2030 (USD Billion)
- Table 23 North America plastic packaging market estimates and forecasts, by product, 2017 - 2030 (USD Billion)
- Table 24 North America plastic packaging market estimates and forecasts, by technology, 2017 - 2030 (USD Billion)
- Table 25 North America plastic packaging market estimates and forecasts, by application, 2017 - 2030 (USD Billion)
- Table 26 U.S plastic packaging market estimates and forecasts, 2017 - 2030 (USD Billion)
- Table 27 U.S. plastic packaging market estimates and forecasts, by product, 2017 - 2030 (USD Billion)
- Table 28 U.S. plastic packaging market estimates and forecasts, by technology, 2017 - 2030 (USD Billion)
- Table 29 U.S. plastic packaging market estimates and forecasts, by application, 2017 - 2030 (USD Billion)
- Table 30 Canada plastic packaging market estimates and forecasts, 2017 - 2030 (USD Billion)
- Table 31 Canada plastic packaging market estimates and forecasts, by product, 2017 - 2030 (USD Billion)
- Table 32 Canada plastic packaging market estimates and forecasts, by technology, 2017 - 2030 (USD Billion)
- Table 33 Canada plastic packaging market estimates and forecasts, by application, 2017 - 2030 (USD Billion)
- Table 34 Mexico plastic packaging market estimates and forecasts, 2017 - 2030 (USD Billion)
- Table 35 Mexico plastic packaging market estimates and forecasts, by product, 2017 - 2030 (USD Billion)
- Table 36 Mexico plastic packaging market estimates and forecasts, by technology, 2017 - 2030 (USD Billion)
- Table 37 Mexico plastic packaging market estimates and forecasts, by application, 2017 - 2030 (USD Billion)
- Table 38 Europe plastic packaging market estimates and forecasts, 2017 - 2030 (USD Billion)
- Table 39 Europe plastic packaging market estimates and forecasts, by product, 2017 - 2030 (USD Billion)
- Table 40 Europe plastic packaging market estimates and forecasts, by technology, 2017 - 2030 (USD Billion)
- Table 41 Europe plastic packaging market estimates and forecasts, by application, 2017 - 2030 (USD Billion)
- Table 42 Germany plastic packaging market estimates and forecasts, 2017 - 2030 (USD Billion)
- Table 43 Germany plastic packaging market estimates and forecasts, by product, 2017 - 2030 (USD Billion)
- Table 44 Germany plastic packaging market estimates and forecasts, by technology, 2017 - 2030 (USD Billion)
- Table 45 Germany plastic packaging market estimates and forecasts, by application, 2017 - 2030 (USD Billion)
- Table 46 U.K. plastic packaging market estimates and forecasts, 2017 - 2030 (USD Billion)
- Table 47 U.K. plastic packaging market estimates and forecasts, by product, 2017 - 2030 (USD Billion)
- Table 48 U.K. plastic packaging market estimates and forecasts, by technology, 2017 - 2030 (USD Billion)
- Table 49 U.K. plastic packaging market estimates and forecasts, by application, 2017 - 2030 (USD Billion)
- Table 50 France plastic packaging market estimates and forecasts, 2017 - 2030 (USD Billion)
- Table 51 France plastic packaging market estimates and forecasts, by product, 2017 - 2030 (USD Billion)
- Table 52 France plastic packaging market estimates and forecasts, by technology, 2017 - 2030 (USD Billion)
- Table 53 France plastic packaging market estimates and forecasts, by application, 2017 - 2030 (USD Billion)
- Table 54 Italy plastic packaging market estimates and forecasts, 2017 - 2030 (USD Billion)
- Table 55 Italy plastic packaging market estimates and forecasts, by product, 2017 - 2030 (USD Billion)
- Table 56 Italy plastic packaging market estimates and forecasts, by technology, 2017 - 2030 (USD Billion)
- Table 57 Italy plastic packaging market estimates and forecasts, by application, 2017 - 2030 (USD Billion)
- Table 58 Spain plastic packaging market estimates and forecasts, 2017 - 2030 (USD Billion)
- Table 59 Spain plastic packaging market estimates and forecasts, 2017 - 2030 (USD Billion)
- Table 60 Spain plastic packaging market estimates and forecasts, by product, 2017 - 2030 (USD Billion)
- Table 61 Spain plastic packaging market estimates and forecasts, by technology, 2017 - 2030 (USD Billion)
- Table 62 Spain plastic packaging market estimates and forecasts, by application, 2017 - 2030 (USD Billion)
- Table 63 Asia Pacific plastic packaging market estimates and forecasts, 2017 - 2030 (USD Billion)
- Table 64 Asia Pacific plastic packaging market estimates and forecasts, by product, 2017 - 2030 (USD Billion)
- Table 65 Asia Pacific plastic packaging market estimates and forecasts, by technology, 2017 - 2030 (USD Billion)
- Table 66 Asia Pacific plastic packaging market estimates and forecasts, by application, 2017 - 2030 (USD Billion)
- Table 67 China plastic packaging market estimates and forecasts, 2017 - 2030 (USD Billion)
- Table 68 China plastic packaging market estimates and forecasts, by product, 2017 - 2030 (USD Billion)
- Table 69 China plastic packaging market estimates and forecasts, by technology, 2017 - 2030 (USD Billion)
- Table 70 China plastic packaging market estimates and forecasts, by application, 2017 - 2030 (USD Billion)
- Table 71 India plastic packaging market estimates and forecasts, 2017 - 2030 (USD Billion)
- Table 72 India plastic packaging market estimates and forecasts, by product, 2017 - 2030 (USD Billion)
- Table 73 India plastic packaging market estimates and forecasts, by technology, 2017 - 2030 (USD Billion)
- Table 74 India plastic packaging market estimates and forecasts, by application, 2017 - 2030 (USD Billion)
- Table 75 Japan plastic packaging market estimates and forecasts, 2017 - 2030 (USD Billion)
- Table 76 Japan plastic packaging market estimates and forecasts, by product, 2017 - 2030 (USD Billion)
- Table 77 Japan plastic packaging market estimates and forecasts, by technology, 2017 - 2030 (USD Billion)
- Table 78 Japan plastic packaging market estimates and forecasts, by application, 2017 - 2030 (USD Billion)
- Table 79 South Korea plastic packaging market estimates and forecasts, 2017 - 2030 (USD Billion)
- Table 80 South Korea plastic packaging market estimates and forecasts, by product, 2017 - 2030 (USD Billion)
- Table 81 South Korea plastic packaging market estimates and forecasts, by technology, 2017 - 2030 (USD Billion)
- Table 82 South Korea plastic packaging market estimates and forecasts, by application, 2017 - 2030 (USD Billion)
- Table 83 Australia plastic packaging market estimates and forecasts, 2017 - 2030 (USD Billion)
- Table 84 Australia plastic packaging market estimates and forecasts, by product, 2017 - 2030 (USD Billion)
- Table 85 Australia plastic packaging market estimates and forecasts, by technology, 2017 - 2030 (USD Billion)
- Table 86 Australia plastic packaging market estimates and forecasts, by application, 2017 - 2030 (USD Billion)
- Table 87 Central & South America plastic packaging market estimates and forecasts, 2017 - 2030 (USD Billion)
- Table 88 Central & South America plastic packaging market estimates and forecasts, by product, 2017 - 2030 (USD Billion)
- Table 89 Central & South America plastic packaging market estimates and forecasts, by technology, 2017 - 2030 (USD Billion)
- Table 90 Central & South America plastic packaging market estimates and forecasts, by application, 2017 - 2030 (USD Billion)
- Table 91 Brazil plastic packaging market estimates and forecasts, 2017 - 2030 (USD Billion)
- Table 92 Brazil plastic packaging market estimates and forecasts, by product, 2017 - 2030 (USD Billion)
- Table 93 Brazil plastic packaging market estimates and forecasts, by technology, 2017 - 2030 (USD Billion)
- Table 94 Brazil plastic packaging market estimates and forecasts, by application, 2017 - 2030 (USD Billion)
- Table 95 Middle East & Africa plastic packaging market estimates and forecasts, 2017 - 2030 (USD Billion)
- Table 96 Middle East & Africa plastic packaging market estimates and forecasts, by product, 2017 - 2030 (USD Billion)
- Table 97 Middle East & Africa plastic packaging market estimates and forecasts, by technology, 2017 - 2030 (USD Billion)
- Table 98 Middle East & Africa plastic packaging market estimates and forecasts, by application, 2017 - 2030 (USD Billion)
- Table 99 South Africa plastic packaging market estimates and forecasts, 2017 - 2030 (USD Billion)
- Table 100 South Africa plastic packaging market estimates and forecasts, by product, 2017 - 2030 (USD Billion)
- Table 101 South Africa plastic packaging market estimates and forecasts, by technology, 2017 - 2030 (USD Billion)
- Table 102 South Africa plastic packaging market estimates and forecasts, by application, 2017 - 2030 (USD Billion)
List of Figures
- Fig. 1 Information procurement
- Fig. 2 Primary research pattern
- Fig. 3 Primary research process
- Fig. 4 Primary research approaches
- Fig. 5 Plastic Packaging market: Market outlook
- Fig. 6 Plastic packaging market: Competitive snapshot
- Fig. 7 Plastic packaging market: Segmental snapshot
- Fig. 8 Plastic Packaging market: segmental snapshot
- Fig. 9 Plastic Packaging market: penetration and growth prospect mapping
- Fig. 10 Plastic Packaging market: Value chain analysis
- Fig. 11 Global PE Production, by region, 2020
- Fig. 12 Global PE prices (USD/Kg), 2014 - 2020
- Fig. 13 Global PP production, by region-, 2020
- Fig. 14 Global polypropylene prices (USD/Kg), 2014 - 2020
- Fig. 15 Sales channel analysis
- Fig. 16 Global Pharmaceutical Market Growth Rate, 2011 - 2021 (USD Billion)
- Fig. 17 Crude oil prices (USD/barrel) ,2013 - 2020
- Fig. 18 Plastic Packaging market: Porter's Five Forces Analysis
- Fig. 19 Plastic Packaging market: PESTEL analysis
- Fig. 20 Plastic Packaging market: Product movement analysis, 2021 & 2030
- Fig. 21 Plastic Packaging market: Technology movement analysis, 2021 & 2030
- Fig. 22 Plastic Packaging market: Application movement analysis, 2021 & 2030
- Fig. 23 Global Plastic Packaging market Regional snapshot
- Fig. 24 Global Plastic Packaging market: Regional movement analysis, by revenue, 2021 & 2030
- Fig. 25 Participant categorization
- Fig. 26 Plastic Packaging Market: Competitive dashboard analysis [Public companies]
Plastic Packaging Market Growth & Trends:
The global plastic packaging market size is expected to reach USD 492.3 billion by 2030, according to a new report by Grand View Research, Inc. The market is expected to expand at a CAGR of 4.2% from 2022 to 2030. The rapid growth of food and beverages, personal care, industrial, and pharmaceutical sectors, coupled with the rising penetration of organized and e-retail across the world, is expected to fuel growth in the market.
Low-density polyethylene (LDPE), Polypropylene (PP), High-density Polyethylene (HDPE), and Polyethylene Terephthalate (PET) are the most widely used materials for the manufacturing of packaging products such as bottles and jars, trays & containers, wraps and films, and pouches, owing to their strong barrier properties against moisture, low cost, lightweight, and extensive functionalities. Growing demand for sustainable products is prompting manufacturers to use recycled plastic resins to make plastic packaging products.
The food and beverage industry has been accounting for the largest revenue share of the market. Globally, the changing lifestyle has led to the introduction of single-serve products that significantly contributed to the growth of plastic packaging in the past few years. Products such as trays, containers, tubs, wraps, pouches, films, and others are extensively utilized in the food and beverage industry for packing ready-to-eat meals, ready-to-eat convenient products, frozen meals, carbonated and non-carbonated beverages, and snack foods.
Plastic packaging products are transparent, lightweight, offer high aesthetic appeal along with robust barrier properties, and are less expensive. These factors are mainly attributed to the widespread penetration of the products in the food and beverages industry. Moreover, in the pharmaceutical industry, packaging products such as jars, syringes, blisters, rigid bottles, pouches, and others are used for packing liquid, semisolid, solid, and powdered products. The pharmaceutical industry in countries like China, India, Mexico, Brazil, and other developing economies is witnessing significant growth due to a higher focus on increasing the life expectancy of the population.
Furthermore, the demand for rigid plastic products is projected to be driven by their applicability and functionality in offering high protection to packaged goods and products. Plastics are long polymer chains making them durable and extraordinarily difficult to break. The rise in the demand for rigid plastic packaging from the healthcare industry to prevent contamination of medicines and from the food and beverage industry is projected to accelerate the segment growth during the forecast period.
Plastic Packaging Market Report Highlights:
- In terms of revenue, the flexible segment is projected to ascend at a CAGR of 4.5% during the forecast period on account of the growing demand for pouches and bags by food and beverage manufacturers, owing to the low cost and high sustainability of flexible packaging over rigid ones
- The extrusion segment accounted for the largest revenue share of 38.8% in 2021 as the majority of the flexible products such as pouches, bags, and films are produced by extrusion technology
- The food and beverage end-use segment led the market in 2021 and accounted for a revenue share of more than 51.5%. Widespread use of plastic packaging products from raw food products to final packaged single-serve food products has been mainly contributing to the higher share of the segment
- The rigid product segment accounted for the largest revenue share in 2021. High adoption of rigid products such as bottles and jars, trays and containers, and caps and closure by food and beverage companies is mainly attributed to a higher share of the segment in 2021
- However, the flexible product segment is expected to witness the highest growth from 2022 to 2030 as the flexible products are lightweight, occupy lesser space in transportation, are significantly cheaper than rigid ones, and most importantly flexible packaging consumes less plastic material and thus presents better sustainability profile than its rigid counterpart
- Asia Pacific emerged as the leading regional market with 43.1% of the global revenue share in 2021 and is expected to witness the highest CAGR from 2022 to 2030, owing to the presence of major emerging economies like China, India, Japan, and South Korea. China and India constitute one of the largest consumer bases around the world, which creates a huge demand for packaging products
- The market is highly fragmented in nature with the presence of large-sized international companies as well as small- and medium-sized domestic players. Key players are focusing on acquisitions and also increasingly expanding sustainable packaging portfolios to attract end-user companies
Table of Contents
Chapter 1. Methodology and Scope
- 1.1. Market Segmentation & Scope
- 1.2. Market Definition
- 1.3. Information Procurement
- 1.3.1. Purchased Database
- 1.3.2. GVR's Internal Database
- 1.3.3. Secondary Sources & Third-Party Perspectives
- 1.3.4. Primary Research
- 1.4. Information Analysis
- 1.4.1. Data Analysis Models
- 1.5. Market Formulation & Data Visualization
- 1.6. Data Validation & Publishing
Chapter 2. Executive Summary
- 2.1. Market Outlook
- 2.2. Segmental Outlook
- 2.3. Competitive Insights
Chapter 3. Market Variables, Trends, and Scope
- 3.1. Market Lineage
- 3.2. Penetration & Growth Prospect Mapping
- 3.3. Industry Value Chain Analysis
- 3.3.1. Major Raw Material Trends Analysis
- 3.3.2. Manufacturing Trends
- 3.4. Sales Channel Analysis
- 3.5. Technology Framework
- 3.6. Regulatory Framework
- 3.7. Plastic Packaging market - Market Dynamics
- 3.7.1. Market Driver Analysis
- 3.7.2. Market Restraint Analysis
- 3.7.3. Industry Challenges
- 3.8. Business Environmental Tools Analysis: Plastic Packaging market
- 3.8.1. Porter's Five Forces Analysis
- 3.8.1.1. Bargaining Power of Suppliers
- 3.8.1.2. Bargaining Power of Buyers
- 3.8.1.3. Threat of Substitution
- 3.8.1.4. Threat of New Entrants
- 3.8.1.5. Competitive Rivalry
- 3.8.2. PESTLE Analysis
- 3.8.2.1. Political Landscape
- 3.8.2.2. Economic Landscape
- 3.8.2.3. Social Landscape
- 3.8.2.4. Technology Landscape
- 3.8.2.5. Environmental Landscape
- 3.8.2.6. Legal Landscape
- 3.8.1. Porter's Five Forces Analysis
- 3.9. Major Strategic Deals & Alliances
- 3.10. Market Strategies
- 3.10.1. Impact of COVID-19
Chapter 4. Plastic Packaging market: Product Estimates & Trend Analysis
- 4.1. Definitions & Scope
- 4.2. Plastic Packaging market: Product Movement Analysis, 2021 & 2030
- 4.3. Rigid
- 4.3.1. Market estimates and forecasts, 2017 - 2030 (USD Billion)
- 4.3.2. Bottles & Jars
- 4.3.2.1. Market estimates and forecasts, 2017 - 2030 (USD Billion)
- 4.3.3. Cans
- 4.3.3.1. Market estimates and forecasts, 2017 - 2030 (USD Billion)
- 4.3.4. Trays & Containers
- 4.3.4.1. Market estimates and forecasts, 2017 - 2030 (USD Billion)
- 4.3.5. Caps & Closures
- 4.3.5.1. Market estimates and forecasts, 2017 - 2030 (USD Billion)
- 4.3.6. Others
- 4.3.6.1. Market estimates and forecasts, 2017 - 2030 (USD Billion)
- 4.4. Flexible
- 4.4.1. Market estimates and forecasts, 2017 - 2030 (USD Billion)
- 4.4.2. Wraps & Films
- 4.4.2.1. Market estimates and forecasts, 2017 - 2030 (USD Billion)
- 4.4.3. Bags
- 4.4.3.1. Market estimates and forecasts, 2017 - 2030 (USD Billion)
- 4.4.4. Pouches
- 4.4.4.1. Market estimates and forecasts, 2017 - 2030 (USD Billion)
- 4.4.5. Others
- 4.4.5.1. Market estimates and forecasts, 2017 - 2030 (USD Billion)
Chapter 5. Plastic Packaging market: Technology Estimates & Trend Analysis
- 5.1. Plastic Packaging market: Technology Movement Analysis, 2021 & 2030
- 5.2. Injection Molding
- 5.2.1. Market estimates and forecasts, 2017 - 2030 (USD Billion)
- 5.3. Extrusion
- 5.3.1. Market estimates and forecasts, 2017 - 2030 (USD Billion)
- 5.4. Blow Molding
- 5.4.1. Market estimates and forecasts, 2017 - 2030 (USD Billion)
- 5.5. Thermoforming
- 5.5.1. Market estimates and forecasts, 2017 - 2030 (USD Billion)
- 5.6. Others
- 5.6.1. Market estimates and forecasts, 2017 - 2030 (USD Billion)
Chapter 6. Plastic Packaging Market: Application Estimates & Trend Analysis
- 6.1. Plastic Packaging Market: Application Movement Analysis, 2021 & 2030
- 6.2. Food & Beverages
- 6.2.1. Market estimates and forecasts, 2017 - 2030 (USD Billion)
- 6.3. Industrial Packaging
- 6.3.1. Market estimates and forecasts, 2017 - 2030 (USD Billion)
- 6.4. Pharmaceutical
- 6.4.1. Market estimates and forecasts, 2017 - 2030 (USD Billion)
- 6.5. Personal & Household Care
- 6.5.1. Market estimates and forecasts, 2017 - 2030 (USD Billion)
- 6.6. Others
- 6.6.1. Market estimates and forecasts, 2017 - 2030 (USD Billion)
Chapter 7. Plastic Packaging market: Regional Estimates & Trend Analysis
- 7.1. Plastic Packaging market: Regional movement analysis, 2021 & 2030
- 7.2. North America
- 7.2.1. Market estimates and forecasts, 2017 - 2030 (USD Billion)
- 7.2.2. Market estimates and forecasts, by product, 2017 - 2030 (USD Billion)
- 7.2.3. Market estimates and forecasts, by technology, 2017 - 2030 (USD Billion)
- 7.2.4. Market estimates and forecasts, by application, 2017 - 2030 (USD Billion)
- 7.2.5. U.S.
- 7.2.5.1. Market estimates and forecasts, 2017 - 2030 (USD Billion)
- 7.2.5.2. Market estimates and forecasts, by product, 2017 - 2030 (USD Billion)
- 7.2.5.3. Market estimates and forecasts, by technology, 2017 - 2030 (USD Billion)
- 7.2.5.4. Market estimates and forecasts, by application, 2017 - 2030 (USD Billion)
- 7.2.6. Canada
- 7.2.6.1. Market estimates and forecasts, 2017 - 2030 (USD Billion)
- 7.2.6.2. Market estimates and forecasts, by product, 2017 - 2030 (USD Billion)
- 7.2.6.3. Market estimates and forecasts, by technology, 2017 - 2030 (USD Billion)
- 7.2.6.4. Market estimates and forecasts, by application, 2017 - 2030 (USD Billion)
- 7.2.7. Mexico
- 7.2.7.1. Market estimates and forecasts, 2017 - 2030 (USD Billion)
- 7.2.7.2. Market estimates and forecasts, by product, 2017 - 2030 (USD Billion)
- 7.2.7.3. Market estimates and forecasts, by technology, 2017 - 2030 (USD Billion)
- 7.2.7.4. Market estimates and forecasts, by application, 2017 - 2030 (USD Billion)
- 7.3. Europe
- 7.3.1. Market estimates and forecasts, 2017 - 2030 (USD Billion)
- 7.3.2. Market estimates and forecasts, by product, 2017 - 2030 (USD Billion)
- 7.3.3. Market estimates and forecasts, by technology, 2017 - 2030 (USD Billion)
- 7.3.4. Market estimates and forecasts, by application, 2017 - 2030 (USD Billion)
- 7.3.5. Germany
- 7.3.5.1. Market estimates and forecasts, 2017 - 2030 (USD Billion)
- 7.3.5.2. Market estimates and forecasts, by product, 2017 - 2030 (USD Billion)
- 7.3.5.3. Market estimates and forecasts, by technology, 2017 - 2030 (USD Billion)
- 7.3.5.4. Market estimates and forecasts, by application, 2017 - 2030 (USD Billion)
- 7.3.6. U.K.
- 7.3.6.1. Market estimates and forecasts, 2017 - 2030 (USD Billion)
- 7.3.6.2. Market estimates and forecasts, by product, 2017 - 2030 (USD Billion)
- 7.3.6.3. Market estimates and forecasts, by technology, 2017 - 2030 (USD Billion)
- 7.3.6.4. Market estimates and forecasts, by application, 2017 - 2030 (USD Billion)
- 7.3.7. France
- 7.3.7.1. Market estimates and forecasts, 2017 - 2030 (USD Billion)
- 7.3.7.2. Market estimates and forecasts, by product, 2017 - 2030 (USD Billion)
- 7.3.7.3. Market estimates and forecasts, by technology, 2017 - 2030 (USD Billion)
- 7.3.7.4. Market estimates and forecasts, by application, 2017 - 2030 (USD Billion)
- 7.3.8. Italy
- 7.3.8.1. Market estimates and forecasts, 2017 - 2030 (USD Billion)
- 7.3.8.2. Market estimates and forecasts, by product, 2017 - 2030 (USD Billion)
- 7.3.8.3. Market estimates and forecasts, by technology, 2017 - 2030 (USD Billion)
- 7.3.8.4. Market estimates and forecasts, by application, 2017 - 2030 (USD Billion)
- 7.3.9. Spain
- 7.3.9.1. Market estimates and forecasts, 2017 - 2030 (USD Billion)
- 7.3.9.2. Market estimates and forecasts, by product, 2017 - 2030 (USD Billion)
- 7.3.9.3. Market estimates and forecasts, by technology, 2017 - 2030 (USD Billion)
- 7.3.9.4. Market estimates and forecasts, by application, 2017 - 2030 (USD Billion)
- 7.4. Asia Pacific
- 7.4.1. Market estimates and forecasts, 2017 - 2030 (USD Billion)
- 7.4.2. Market estimates and forecasts, by product, 2017 - 2030 (USD Billion)
- 7.4.3. Market estimates and forecasts, by technology, 2017 - 2030 (USD Billion)
- 7.4.4. Market estimates and forecasts, by application, 2017 - 2030 (USD Billion)
- 7.4.5. China
- 7.4.5.1. Market estimates and forecasts, 2017 - 2030 (USD Billion)
- 7.4.5.2. Market estimates and forecasts, by product, 2017 - 2030 (USD Billion)
- 7.4.5.3. Market estimates and forecasts, by technology, 2017 - 2030 (USD Billion)
- 7.4.5.4. Market estimates and forecasts, by application, 2017 - 2030 (USD Billion)
- 7.4.6. India
- 7.4.6.1. Market estimates and forecasts, 2017 - 2030 (USD Billion)
- 7.4.6.2. Market estimates and forecasts, by product, 2017 - 2030 (USD Billion)
- 7.4.6.3. Market estimates and forecasts, by technology, 2017 - 2030 (USD Billion)
- 7.4.6.4. Market estimates and forecasts, by application, 2017 - 2030 (USD Billion)
- 7.4.7. Japan
- 7.4.7.1. Market estimates and forecasts, 2017 - 2030 (USD Billion)
- 7.4.7.2. Market estimates and forecasts, by product, 2017 - 2030 (USD Billion)
- 7.4.7.3. Market estimates and forecasts, by technology, 2017 - 2030 (USD Billion)
- 7.4.7.4. Market estimates and forecasts, by application, 2017 - 2030 (USD Billion)
- 7.4.8. South Korea
- 7.4.8.1. Market estimates and forecasts, 2017 - 2030 (USD Billion)
- 7.4.8.2. Market estimates and forecasts, by product, 2017 - 2030 (USD Billion)
- 7.4.8.3. Market estimates and forecasts, by technology, 2017 - 2030 (USD Billion)
- 7.4.8.4. Market estimates and forecasts, by application, 2017 - 2030 (USD Billion)
- 7.4.9. Australia
- 7.4.9.1. Market estimates and forecasts, 2017 - 2030 (USD Billion)
- 7.4.9.2. Market estimates and forecasts, by product, 2017 - 2030 (USD Billion)
- 7.4.9.3. Market estimates and forecasts, by technology, 2017 - 2030 (USD Billion)
- 7.4.9.4. Market estimates and forecasts, by application, 2017 - 2030 (USD Billion)
- 7.5. Central & South America
- 7.5.1. Market estimates and forecasts, 2017 - 2030 (USD Billion)
- 7.5.2. Market estimates and forecasts, by product, 2017 - 2030 (USD Billion)
- 7.5.3. Market estimates and forecasts, by technology, 2017 - 2030 (USD Billion)
- 7.5.4. Market estimates and forecasts, by application, 2017 - 2030 (USD Billion)
- 7.5.5. Brazil
- 7.5.5.1. Market estimates and forecasts, 2017 - 2030 (USD Billion)
- 7.5.5.2. Market estimates and forecasts, by product, 2017 - 2030 (USD Billion)
- 7.5.5.3. Market estimates and forecasts, by technology, 2017 - 2030 (USD Billion)
- 7.5.5.4. Market estimates and forecasts, by application, 2017 - 2030 (USD Billion)
- 7.6. Middle East & Africa
- 7.6.1. Market estimates and forecasts, 2017 - 2030 (USD Billion)
- 7.6.2. Market estimates and forecasts, by product, 2017 - 2030 (USD Billion)
- 7.6.3. Market estimates and forecasts, by technology, 2017 - 2030 (USD Billion)
- 7.6.4. Market estimates and forecasts, by application, 2017 - 2030 (USD Billion)
- 7.6.5. South Africa
- 7.6.5.1. Market estimates and forecasts, 2017 - 2030 (USD Billion)
- 7.6.5.2. Market estimates and forecasts, by product, 2017 - 2030 (USD Billion)
- 7.6.5.3. Market estimates and forecasts, by technology, 2017 - 2030 (USD Billion)
- 7.6.5.4. Market estimates and forecasts, by application, 2017 - 2030 (USD Billion)
Chapter 8. Competitive Landscape
- 8.1. Key Global Players, Their Initiatives, & Its Impact on the Market
- 8.2. Key Company/Competition Categorization
- 8.3. Vendor Landscape
- 8.3.1. List of Key Distributors & Channel Partners
- 8.4. Public Companies
- 8.4.1. Company Market Position Analysis
- 8.4.2. Company Market Share/Ranking
- 8.4.3. Competitive Dashboard Analysis
- 8.4.3.1. Market Differentiators
- 8.4.3.2. Synergy Analysis
- 8.5. Private Companies
- 8.5.1. Key Emerging Companies
- 8.5.2. Geographical Presence
- 8.5.3. Company Market Position Analysis
Chapter 9. Company Profiles
- 9.1. Amcor plc
- 9.1.1. Company overview
- 9.1.2. Financial performance
- 9.1.3. Technology benchmarking
- 9.1.4. Strategic initiatives
- 9.2. Sealed Air
- 9.2.1. Company overview
- 9.2.2. Financial performance
- 9.2.3. Technology benchmarking
- 9.2.4. Strategic initiatives
- 9.3. Coveris
- 9.3.1. Company overview
- 9.3.2. Financial performance
- 9.3.3. Technology benchmarking
- 9.3.4. Strategic initiatives
- 9.4. Sonoco Products Company
- 9.4.1. Company overview
- 9.4.2. Financial performance
- 9.4.3. Technology benchmarking
- 9.4.4. Strategic initiatives
- 9.5. CCL Industries
- 9.5.1. Company overview
- 9.5.2. Financial performance
- 9.5.3. Technology benchmarking
- 9.5.4. Strategic initiatives
- 9.6. WINPAK LTD
- 9.6.1. Company overview
- 9.6.2. Financial performance
- 9.6.3. Technology benchmarking
- 9.6.4. Strategic initiatives
- 9.7. Alpha Packaging
- 9.7.1. Company overview
- 9.7.2. Financial performance
- 9.7.3. Technology benchmarking
- 9.7.4. Strategic initiatives
- 9.8. Berry Global, Inc.
- 9.8.1. Company overview
- 9.8.2. Financial performance
- 9.8.3. Technology benchmarking
- 9.8.4. Strategic initiatives
- 9.9. Constantia Flexibles
- 9.9.1. Company overview
- 9.9.2. Financial performance
- 9.9.3. Technology benchmarking
- 9.9.4. Strategic initiatives
- 9.10. Mondi
- 9.10.1. Company overview
- 9.10.2. Financial performance
- 9.10.3. Technology benchmarking
- 9.10.4. Strategic initiatives