|
|
市場調査レポート
商品コード
1170891
昇華プリント式アパレルの市場規模・シェア・動向分析レポート製品別(Tシャツ、パーカー)、プリント技術別(3Dバキューム、小型ヒートプレス)、流通チャネル別、セグメント別予測、2022年~2030年Dye Sublimated Apparel Market Size, Share & Trends Analysis Report By Product (T-shirts, Hoodies), By Printing Technique (3D Vacuum, Small Format Heat Press), By Distribution Channel, And Segment Forecasts, 2022 - 2030 |
||||||
|
|
|||||||
|
● お客様のご希望に応じて、既存データの加工や未掲載情報(例:国別セグメント)の追加などの対応が可能です。 詳細はお問い合わせください。 |
|||||||


| 昇華プリント式アパレルの市場規模・シェア・動向分析レポート製品別(Tシャツ、パーカー)、プリント技術別(3Dバキューム、小型ヒートプレス)、流通チャネル別、セグメント別予測、2022年~2030年 |
|
出版日: 2022年11月07日
発行: Grand View Research
ページ情報: 英文 113 Pages
納期: 2~10営業日
|
- 全表示
- 概要
- 図表
- 目次
昇華プリント式アパレルの市場成長と動向
Grand View Research, Inc.の最新レポートによると、昇華プリント式アパレルの世界市場規模は2030年までに106億7000万米ドルに達し、予測期間中に12.3%のCAGRを記録すると予測されています。デジタル印刷、スローガン、野心の引用、写真作品などを服に施し、カスタマイズしたデザイナーズアパレルの人気が高まっていることが、業界の成長を促す主な要因の1つとなっています。さらに、以前はアパレルがより良い快適さと製品の品質のために着用されていたところ、服は現在、ファッションアクセサリーとしても考えられており、消費者はカスタム服でフルカラーをカバーする無限のデザインの可能性を得るためにアパレルを探しており、それによって製品需要を推進しています。
過去数年間、数多くの企業が高度なファブリック技術と強化された機能を備えた製品を提供してきました。これらの衣料品は軽量で汎用性が高く、さまざまな作業環境に適しています。例えば、米国を拠点とするSix Six Apparelは、ひび割れや色褪せのない永久的なグラフィックインプリントで、カスタマイズされたロゴやデザインのアパレルを幅広く提供しています。近年、多くの企業で採用が進んでいるのが、写真のような高品質な仕上がりが得られる昇華プリント技術です。この技術は、熱転写によって、異なる量の着色染料顔料をキャリアフィルムからPVCプリント表面に移動させ、染料を化学的に結合させるものです。
摩擦抵抗低減技術やオーバーコート素材の改良により、衣類のシワの発生を抑え、通気性を確保することができます。2021年の売上高シェアは、昇華プリント式Tシャツ部門が最も大きいです。中国、インド、ドイツなどの国々では、政府によるスポーツ関連への投資によりスポーツ人気が高まっており、今後数年間で製品需要が増加すると予測されます。さらに、ほぼすべてのスポーツのチームやクラブが、独自のロゴやデザインを施したカスタムデザインのTシャツやジャージをデザインし、着用するようになりました。
様々なスポーツクラブが、チームの知名度を上げ、チームプレーヤーやファンにユニークな外観を提供するために、この動向に追随しています。業界の主要企業は、各地域の生産施設を拡張することで存在感を高めようとしています。例えば、2019年5月、スクリーン印刷や昇華などの印刷技術によるカスタマイズアパレルの製造を手がけるカナダのギルダンは、バングラデシュに4500万米ドルを投じて土地を購入し、関連の縫製作業とともに2つの大型繊維施設を設立する計画を発表しました。
昇華プリント式アパレル市場レポートハイライト
プリント写真やグラデーション調のカスタマイズされた衣服への支出増を背景に、世界の産業は成長しています。
2021年、北米が最大の地域となっています。持続可能な製品に関する意識は、この上昇で著しく高まっており、そのため昇華プリント式アパレルのデザイナーやメーカーは、持続可能な方法で調達されたアパレルをポートフォリオに含めることに力を入れています。
2021年の全体収益では、Tシャツセグメントが最大のシェアを占めています。このセグメントの成長は、世界中のスポーツ産業におけるカスタムTシャツの高い需要に起因しています。
小型フォーマットヒートプレスは、2021年に最大のセグメントとして浮上し、予測期間中に最速のCAGRでさらに拡大すると予測されます。
小型フォーマットのヒートプレス機は、趣味や小規模なビジネスに最適です。これらは、小さな素材にデザインやパターンを転写する携帯用ヒートプレス機です。
目次
第1章 調査手法と範囲
- 市場セグメンテーションと範囲
- 市場の定義
- 情報調達
- 購入したデータベース
- GVRの内部データベース
- 二次製品とサードパーティの視点
- 1次調査
- 情報分析
- データ分析モデル
- 市場形成とデータ可視化
- データの検証と公開
第2章 エグゼクティブサマリー
- 市場の見通し
- 製品の見通し
- 印刷技術の展望
- 流通経路の見通し
- 地域の見通し
第3章 安全眼鏡市場の変数、動向、範囲
- 市場イントロダクション
- 浸透と成長の見通しのマッピング
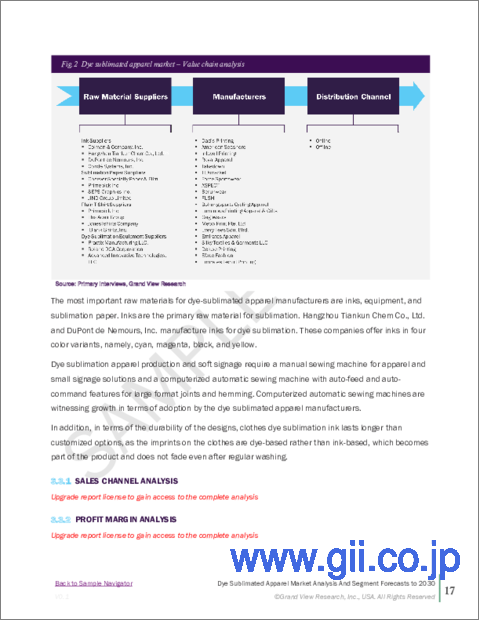
- 業界バリューチェーン分析
- 販売・小売チャネル分析
- 利益率分析
- 市場力学
- 市場促進要因分析
- 市場抑制要因分析
- 業界の課題
- 業界の機会
- 事業環境分析
- 業界分析- ポーターズ
- サプライヤーの力
- 買い手の交渉力
- 代替の脅威
- 新規参入者からの脅威
- 競争企業間の敵対関係
- 業界分析- ポーターズ
- 昇華プリント式アパレル市場のロードマップ
- 市場参入戦略
- COVID-19の昇華プリント式アパレル市場への影響
第4章 消費者行動分析
- 消費者の動向と好み
- 購入決定に影響を与える要因
- 消費者製品の採用
- 所見と推奨事項
- 昇華プリント式アパレル市場:製品推定・動向分析
- 製品変動分析と市場シェア、2021年と2030年
- ボトムウェア
- パーカー
- Tシャツ
- その他
第5章 昇華プリント式アパレル市場:印刷技術の推定・動向分析
- 印刷技術の変動分析と市場シェア、2021年と2030年
- スモールフォーマットヒートプレス
- カレンダーヒートプレス
- フラットベッドヒートプレス
- 3D真空熱プレス
第6章 昇華プリント式アパレル市場:流通チャネルの推定・動向分析
- 流通チャネルの変動分析と市場シェア、2021年と2030年
- オフライン
- オンライン
第7章 昇華プリント式アパレル市場:地域推定・動向分析
- 地域別変動分析と市場シェア、2021年と2030年
- 北米
- 米国
- 欧州
- 英国
- ドイツ
- アジア太平洋地域
- 中国
- インド
- 中南米
- ブラジル
- 中東とアフリカ
- 南アフリカ
第8章 競合分析
- 主要な世界プレーヤー、最近の動向、業界への影響
- 主要企業/競合の分類(主要なイノベーター、市場リーダー、新興企業)
- ベンダー情勢
- 主要企業の市場シェア分析、2021年
第9章 企業プロファイル
- Dad's Printing
- 会社概要
- 財務実績
- 製品のベンチマーク
- 戦略的イニシアチブ
- Inkwell Printing
- 会社概要
- 財務実績
- 製品のベンチマーク
- 戦略的イニシアチブ
- Royal Apparel.
- 会社概要
- 財務実績
- 製品のベンチマーク
- 戦略的イニシアチブ
- TEXmarket
- 会社概要
- 財務実績
- 製品のベンチマーク
- 戦略的イニシアチブ
- ASPECT
- 会社概要
- 財務実績
- 製品のベンチマーク
- 戦略的イニシアチブ
- FUSH
- 会社概要
- 財務実績
- 製品のベンチマーク
- 戦略的イニシアチブ
- Printful, Inc.
- 会社概要
- 財務実績
- 製品のベンチマーク
- 戦略的イニシアチブ
- ALE CLOTHING
- 会社概要
- 財務実績
- 製品のベンチマーク
- 戦略的イニシアチブ
- Berunwear
- 会社概要
- 財務実績
- 製品のベンチマーク
- 戦略的イニシアチブ
- Emirates Apparel
- 会社概要
- 財務実績
- 製品のベンチマーク
- 戦略的イニシアチブ
List of Tables
- 1. Dye sublimated apparel market - key market driver analysis
- 2. Dye sublimated apparel market - key market restraint analysis
- 3. Global dye sublimated bottomwear market estimates and forecast, 2017 - 2030 (USD Million)
- 4. Global dye sublimated hoodies market estimates and forecast, 2017 - 2030 (USD Million)
- 5. Global dye sublimated t-shirts market estimates and forecast, 2017 - 2030 (USD Million)
- 6. Global other dye sublimated apparel market estimates and forecast, 2017 - 2030 (USD Million)
- 7. Global small format heat press dye sublimated apparel market estimates and forecast, 2017 - 2030 (USD Million)
- 8. Global dye sublimated apparel market estimates and forecast for construction, 2017 - 2030 (USD Million)
- 9. Global calendar heat press dye sublimated apparel market estimates and forecast, 2017 - 2030 (USD Million)
- 10. Global flatbed heat press dye sublimated apparel market estimates and forecast, 2017 - 2030 (USD Million)
- 11. Global 3D vacuum heat press dye sublimated apparel market estimates and forecast, 2017 - 2030 (USD Million)
- 12. Global dye sublimated apparel market estimates and forecast through online channel, 2017 - 2030 (USD Million)
- 13. Global dye sublimated apparel market estimates and forecast through offline channel, 2017 - 2030 (USD Million)
- 14. North America dye sublimated apparel market estimates and forecast, 2017 - 2030 (USD Million)
- 15. North America dye sublimated apparel market estimates and forecast, by product, 2017 - 2030 (USD Million)
- 16. North America dye sublimated apparel market estimates and forecast, by printing technique, 2017 - 2030 (USD Million)
- 17. North America dye sublimated apparel market estimates and forecast, by distribution channel, 2017 - 2030 (USD Million)
- 18. U.S. dye sublimated apparel market estimates and forecast, 2017 - 2030 (USD Million)
- 19. U.S. dye sublimated apparel market estimates and forecast by product, 2017 - 2030 (USD Million)
- 20. U.S. dye sublimated apparel market estimates and forecast by printing technique, 2017 - 2030 (USD Million)
- 21. U.S. dye sublimated apparel market estimates and forecast by distribution channel, 2017 - 2030 (USD Million)
- 22. Europe dye sublimated apparel market estimates and forecast, 2017 - 2030 (USD Million)
- 23. Europe dye sublimated apparel market estimates and forecast by product, 2017 - 2030 (USD Million)
- 24. Europe dye sublimated apparel market estimates and forecast by printing technique, 2017 - 2030 (USD Million)
- 25. Europe dye sublimated apparel market estimates and forecast by distribution channel, 2017 - 2030 (USD Million)
- 26. U.K. dye sublimated apparel market estimates and forecast, 2017 - 2030 (USD Million)
- 27. U.K. dye sublimated apparel market estimates and forecast by product, 2017 - 2030 (USD Million)
- 28. U.K. dye sublimated apparel market estimates and forecast by printing technique, 2017 - 2030 (USD Million)
- 29. U.K. dye sublimated apparel market estimates and forecast by distribution channel, 2017 - 2030 (USD Million)
- 30. Germany dye sublimated apparel market estimates and forecast, 2017 - 2030 (USD Million)
- 31. Germany dye sublimated apparel market estimates and forecast by product, 2017 - 2030 (USD Million)
- 32. Germany dye sublimated apparel market estimates and forecast by printing technique, 2017 - 2030 (USD Million)
- 33. Germany dye sublimated apparel market estimates and forecast by distribution channel, 2017 - 2030 (USD Million)
- 34. Asia Pacific dye sublimated apparel market estimates and forecast, 2017 - 2030 (USD Million)
- 35. Asia Pacific dye sublimated apparel market estimates and forecast by product, 2017 - 2030 (USD Million)
- 36. Asia Pacific dye sublimated apparel market estimates and forecast by printing technique, 2017 - 2030 (USD Million)
- 37. Asia Pacific dye sublimated apparel market estimates and forecast by distribution channel, 2017 - 2030 (USD Million)
- 38. China dye sublimated apparel market estimates and forecast, 2017 - 2030 (USD Million)
- 39. China dye sublimated apparel market estimates and forecast by product, 2017 - 2030 (USD Million)
- 40. China dye sublimated apparel market estimates and forecast by printing technique, 2017 - 2030 (USD Million)
- 41. China dye sublimated apparel market estimates and forecast by distribution channel, 2017 - 2030 (USD Million)
- 42. India dye sublimated apparel market estimates and forecast, 2017 - 2030 (USD Million)
- 43. India dye sublimated apparel market estimates and forecast by product, 2017 - 2030 (USD Million)
- 44. India dye sublimated apparel market estimates and forecast by printing technique, 2017 - 2030 (USD Million)
- 45. Central & South America dye sublimated apparel market estimates and forecast, 2017 - 2030 (USD Million)
- 46. Central & South America dye sublimated apparel market estimates and forecast by product, 2017 - 2030 (USD Million)
- 47. Central & South America dye sublimated apparel market estimates and forecast by printing technique, 2017 - 2030 (USD Million)
- 48. Central & South America dye sublimated apparel market estimates and forecast by distribution channel, 2017 - 2030 (USD Million)
- 49. Brazil dye sublimated apparel market estimates and forecast, 2017 - 2030 (USD Million)
- 50. Brazil dye sublimated apparel market estimates and forecast by product, 2017 - 2030 (USD Million)
- 51. Brazil dye sublimated apparel market estimates and forecast by printing technique, 2017 - 2030 (USD Million)
- 52. Middle East & Africa dye sublimated apparel market estimates and forecast, 2017 - 2030 (USD Million)
- 53. Middle East & Africa dye sublimated apparel market estimates and forecast by product, 2017 - 2030 (USD Million)
- 54. Middle East & Africa dye sublimated apparel market estimates and forecast by printing technique, 2017 - 2030 (USD Million)
- 55. Middle East & Africa dye sublimated apparel market estimates and forecast by distribution channel, 2017 - 2030 (USD Million)
- 56. South Africa dye sublimated apparel market estimates and forecast, 2017 - 2030 (USD Million)
- 57. South Africa dye sublimated apparel market estimates and forecast by product, 2017 - 2030 (USD Million)
- 58. South Africa dye sublimated apparel market estimates and forecast by printing technique, 2017 - 2030 (USD Million)
- 59. Vendor landscape
List of Figures
- 1. Dye sublimated apparel market snapshot
- 2. Dye sublimated apparel market segmentation & scope
- 3. Dye sublimated apparel market penetration & growth prospect mapping
- 4. Dye sublimated apparel market value chain analysis
- 5. Dye sublimated apparel market dynamics
- 6. Dye sublimated apparel market porter's analysis
- 7. Dye sublimated apparel market: Product movement analysis
- 8. Dye sublimated apparel market: Printing technique movement analysis
- 9. Dye sublimated apparel market: Distribution channel movement analysis
- 10. Dye sublimated apparel market: Regional movement analysis
Dye Sublimated Apparel Market Growth & Trends:
The global dye sublimated apparel market size is expected to reach USD 10.67 billion by 2030, registering a CAGR of 12.3% over the forecast period, according to a new report by Grand View Research, Inc. Increasing popularity of customized designers' apparel with digital printing, slogans, ambition quotations, and photo works on clothes is among the major factor driving the growth of the industry. Furthermore, where apparel was previously worn for better comfort and product quality, clothes are now also considered a fashion accessory, where consumers have been looking for apparel to get unlimited design possibilities with full-color coverage with custom clothes, thereby driving the product demand.
Over the past few years, numerous companies have been offering products with advanced fabric technologies and enhanced features. These apparels are lightweight, versatile, and suitable for various work environments. For instance, Six Six Apparel, a U.S.-based company, provides a wide range of customized logo and design apparel with a permanent graphic imprint that does not crack or fade easily. In recent years, the dye sublimation printing technique has been increasingly adopted by many companies due to its high-quality photographic results. This technique utilizes thermal transfer to shift different amounts of colored dye pigments from a carrier film to the PVC printing surface, to which the dyes bond chemically.
Reduction in frictional resistance technology and improvements in the overcoat materials result in a reduction in the occurrence of wrinkles in clothes and ensure the breathability of clothes. Dye sublimated t-shirt segment accounted for the largest revenue share in 2021. With the increased popularity of sports in countries, such as China, India, and Germany, due to investments by governments in sports-related activities, the product demand is anticipated to increase in the years to come. Furthermore, sports teams and clubs of almost all sports have started to design and wear custom-designed t-shirts and jerseys with their unique logos and designs.
Various sporting clubs are following this trend to increase the visibility of their teams and to provide a unique appearance to their team players and fans. Major companies in the industry are trying to increase their presence in by expanding their production facilities in various regions. For instance, in May 2019, Gildan, a Canada-based company involved in the manufacturing of customized apparel via printing technologies, such as screen printing and sublimation, announced its plan to invest USD 45 million to purchase land in Bangladesh and establish two large textile facilities along with related sewing operations.
Dye Sublimated Apparel Market Report Highlights:
- The global industry is growing on account of increasing spending on customized clothes with print photographs and gradient tones
- In 2021, North America was the largest region. The awareness about sustainable products is growing significantly in this rising, due to which dye-sublimated apparel designers and manufacturers are putting efforts in including sustainably-sourced apparel in their portfolios
- The t-shirts segment accounted for the largest share of the overall revenue in 2021. The segment growth is attributed to the high demand for custom t-shirts in the sports industry across the globe
- Small format heat press emerged as the largest segment in 2021 and is projected to expand further at the fastest CAGR over the forecast period
- Small-format heat press machines are ideal for hobbyists and small businesses. These are portable heat presses that transfer designs and patterns to small materials
Table of Contents
Chapter 1. Methodology and Scope
- 1.1. Market Segmentation & Scope
- 1.2. Market Definition
- 1.3. Information Procurement
- 1.3.1. Purchased Database
- 1.3.2. GVR's Internal Database
- 1.3.3. Secondary Products & Third-Party Perspectives
- 1.3.4. Primary Research
- 1.4. Information Analysis
- 1.4.1. Data Analysis Models
- 1.5. Market Formulation & Data Visualization
- 1.6. Data Validation & Publishing
Chapter 2. Executive Summary
- 2.1. Market Outlook
- 2.2. Product Outlook
- 2.3. Printing Technique Outlook
- 2.4. Distribution Channel Outlook
- 2.5. Regional Outlook
Chapter 3. Safety eyewear Market Variables, Trends & Scope
- 3.1. Market Introduction
- 3.2. Penetration & Growth Prospect Mapping
- 3.3. Industry Value Chain Analysis
- 3.3.1. Sales/Retail Channel Analysis
- 3.3.2. Profit Margin Analysis
- 3.4. Market Dynamics
- 3.4.1. Market Driver Analysis
- 3.4.2. Market Restraint Analysis
- 3.4.3. Industry Challenges
- 3.4.4. Industry Opportunities
- 3.5. Business Environment Analysis
- 3.5.1. Industry Analysis - Porter's
- 3.5.1.1. Supplier Power
- 3.5.1.2. Buyer Power
- 3.5.1.3. Substitution Threat
- 3.5.1.4. Threat from New Entrants
- 3.5.1.5. Competitive Rivalry
- 3.5.1. Industry Analysis - Porter's
- 3.6. Roadmap of the dye sublimated apparel market
- 3.7. Market Entry Strategies
- 3.8. Impact of COVID-19 on the dye sublimated apparel market
Chapter 4. Consumer Behavior Analysis
- 4.1. Consumer Trends and Preferences
- 4.2. Factors Affecting Buying Decision
- 4.3. Consumer Product Adoption
- 4.4. Observations & Recommendations
- 4.5. Dye Sublimated Apparel Market: Product Estimates & Trend Analysis
- 4.6. Product Movement Analysis & Market Share, 2021 & 2030
- 4.7. Bottomwear
- 4.7.1. Market estimates and forecast, 2017 - 2030 (USD Million)
- 4.8. Hoodies
- 4.8.1. Market estimates and forecast, 2017 - 2030 (USD Million)
- 4.9. T-Shirts
- 4.9.1. Market estimates and forecast, 2017 - 2030 (USD Million)
- 4.10. Others
- 4.10.1. Market estimates and forecast, 2017 - 2030 (USD Million)
Chapter 5. Dye Sublimated Apparel Market: Printing Technique Estimates & Trend Analysis
- 5.1. Printing Technique Movement Analysis & Market Share, 2021 & 2030
- 5.2. Small Format Heat Press
- 5.2.1. Market estimates and forecast, 2017 - 2030 (USD Million)
- 5.3. Calendar Heat Press
- 5.3.1. Market estimates and forecast, 2017 - 2030 (USD Million)
- 5.4. Flatbed Heat Press
- 5.4.1. Market estimates and forecast, 2017 - 2030 (USD Million)
- 5.5. 3D Vacuum Heat Press
- 5.5.1. Market estimates and forecast, 2017 - 2030 (USD Million)
Chapter 6. Dye Sublimated Apparel Market: Distribution Channel Estimates & Trend Analysis
- 6.1. Distribution Channel Movement Analysis & Market Share, 2021 & 2030
- 6.2. Offline
- 6.2.1. Market estimates and forecast, 2017 - 2030 (USD Million)
- 6.3. Online
- 6.3.1. Market estimates and forecast, 2017 - 2030 (USD Million)
Chapter 7. Dye Sublimated Apparel Market: Regional Estimates & Trend Analysis
- 7.1. Regional Movement Analysis & Market Share, 2021 & 2030
- 7.2. North America
- 7.2.1. Market estimates and forecast, 2017 - 2030 (USD Million)
- 7.2.2. Market estimates and forecast, by product, 2017 - 2030 (USD Million)
- 7.2.3. Market estimates and forecast, by printing technique, 2017 - 2030 (USD Million)
- 7.2.4. Market estimates and forecast, by distribution channel, 2017 - 2030 (USD Million)
- 7.2.5. U.S.
- 7.2.5.1. Market estimates and forecast, 2017 - 2030 (USD Million)
- 7.2.5.2. Market estimates and forecast, by product, 2017 - 2030 (USD Million)
- 7.2.5.3. Market estimates and forecast, by printing technique, 2017 - 2030 (USD Million)
- 7.2.5.4. Market estimates and forecast, by distribution channel, 2017 - 2030 (USD Million)
- 7.3. Europe
- 7.3.1. Market estimates and forecast, 2017 - 2030 (USD Million)
- 7.3.2. Market estimates and forecast, by product, 2017 - 2030 (USD Million)
- 7.3.3. Market estimates and forecast, by printing technique, 2017 - 2030 (USD Million)
- 7.3.4. Market estimates and forecast, by distribution channel, 2017 - 2030 (USD Million)
- 7.3.5. U.K.
- 7.3.5.1. Market estimates and forecast, 2017 - 2030 (USD Million)
- 7.3.5.2. Market estimates and forecast, by product, 2017 - 2030 (USD Million)
- 7.3.5.3. Market estimates and forecast, by printing technique, 2017 - 2030 (USD Million)
- 7.3.5.4. Market estimates and forecast, by distribution channel, 2017 - 2030 (USD Million)
- 7.3.6. Germany
- 7.3.6.1. Market estimates and forecast, 2017 - 2030 (USD Million)
- 7.3.6.2. Market estimates and forecast, by product, 2017 - 2030 (USD Million)
- 7.3.6.3. Market estimates and forecast, by printing technique, 2017 - 2030 (USD Million)
- 7.3.6.4. Market estimates and forecast, by distribution channel, 2017 - 2030 (USD Million)
- 7.4. Asia Pacific
- 7.4.1. Market estimates and forecast, 2017 - 2030 (USD Million)
- 7.4.2. Market estimates and forecast, by product, 2017 - 2030 (USD Million)
- 7.4.3. Market estimates and forecast, by printing technique, 2017 - 2030 (USD Million)
- 7.4.4. Market estimates and forecast, by distribution channel, 2017 - 2030 (USD Million)
- 7.4.5. China
- 7.4.5.1. Market estimates and forecast, 2017 - 2030 (USD Million)
- 7.4.5.2. Market estimates and forecast, by product, 2017 - 2030 (USD Million)
- 7.4.5.3. Market estimates and forecast, by printing technique, 2017 - 2030 (USD Million)
- 7.4.5.4. Market estimates and forecast, by distribution channel, 2017 - 2030 (USD Million)
- 7.4.6. India
- 7.4.6.1. Market estimates and forecast, 2017 - 2030 (USD Million)
- 7.4.6.2. Market estimates and forecast, by product, 2017 - 2030 (USD Million)
- 7.4.6.3. Market estimates and forecast, by printing technique, 2017 - 2030 (USD Million)
- 7.4.6.4. Market estimates and forecast, by distribution channel, 2017 - 2030 (USD Million)
- 7.5. Central & South America
- 7.5.1. Market estimates and forecast, 2017 - 2030 (USD Million)
- 7.5.2. Market estimates and forecast, by product, 2017 - 2030 (USD Million)
- 7.5.3. Market estimates and forecast, by printing technique, 2017 - 2030 (USD Million)
- 7.5.4. Market estimates and forecast, by distribution channel, 2017 - 2030 (USD Million)
- 7.5.5. Brazil
- 7.5.5.1. Market estimates and forecast, 2017 - 2030 (USD Million)
- 7.5.5.2. Market estimates and forecast, by product, 2017 - 2030 (USD Million)
- 7.5.5.3. Market estimates and forecast, by printing technique, 2017 - 2030 (USD Million)
- 7.5.5.4. Market estimates and forecast, by distribution channel, 2017 - 2030 (USD Million)
- 7.6. Middle East & Africa
- 7.6.1. Market estimates and forecast, 2017 - 2030 (USD Million)
- 7.6.2. Market estimates and forecast, by product, 2017 - 2030 (USD Million)
- 7.6.3. Market estimates and forecast, by printing technique, 2017 - 2030 (USD Million)
- 7.6.4. Market estimates and forecast, by distribution channel, 2017 - 2030 (USD Million)
- 7.6.5. South Africa
- 7.6.5.1. Market estimates and forecast, 2017 - 2030 (USD Million)
- 7.6.5.2. Market estimates and forecast, by product, 2017 - 2030 (USD Million)
- 7.6.5.3. Market estimates and forecast, by printing technique, 2017 - 2030 (USD Million)
- 7.6.5.4. Market estimates and forecast, by distribution channel, 2017 - 2030 (USD Million)
Chapter 8. Competitive Analysis
- 8.1. Key global players, recent developments & their impact on the industry
- 8.2. Key Company/Competition Categorization (Key innovators, Market leaders, Emerging players)
- 8.3. Vendor Landscape
- 8.3.1. Key company market share analysis, 2021
Chapter 9. Company Profiles
- 9.1. Dad's Printing
- 9.1.1. Company Overview
- 9.1.2. Financial Performance
- 9.1.3. Product Benchmarking
- 9.1.4. Strategic Initiatives
- 9.2. Inkwell Printing
- 9.2.1. Company Overview
- 9.2.2. Financial Performance
- 9.2.3. Product Benchmarking
- 9.2.4. Strategic Initiatives
- 9.3. Royal Apparel.
- 9.3.1. Company Overview
- 9.3.2. Financial Performance
- 9.3.3. Product Benchmarking
- 9.3.4. Strategic Initiatives
- 9.4. TEXmarket
- 9.4.1. Company Overview
- 9.4.2. Financial Performance
- 9.4.3. Product Benchmarking
- 9.4.4. Strategic Initiatives
- 9.5. ASPECT
- 9.5.1. Company Overview
- 9.5.2. Financial Performance
- 9.5.3. Product Benchmarking
- 9.5.4. Strategic Initiatives
- 9.6. FUSH
- 9.6.1. Company Overview
- 9.6.2. Financial Performance
- 9.6.3. Product Benchmarking
- 9.6.4. Strategic Initiatives
- 9.7. Printful, Inc.
- 9.7.1. Company Overview
- 9.7.2. Financial Performance
- 9.7.3. Product Benchmarking
- 9.7.4. Strategic Initiatives
- 9.8. ALE CLOTHING
- 9.8.1. Company Overview
- 9.8.2. Financial Performance
- 9.8.3. Product Benchmarking
- 9.8.4. Strategic Initiatives
- 9.9. Berunwear
- 9.9.1. Company Overview
- 9.9.2. Financial Performance
- 9.9.3. Product Benchmarking
- 9.9.4. Strategic Initiatives
- 9.10. Emirates Apparel
- 9.10.1. Company Overview
- 9.10.2. Financial Performance
- 9.10.3. Product Benchmarking
- 9.10.4. Strategic Initiatives