|
|
市場調査レポート
商品コード
1133263
ゴム手袋の市場規模、シェア、動向分析レポート:素材別(ラテックス、ニトリル)、タイプ別(粉末、粉末なし)、流通チャネル別(オンライン、実店舗)、製品別、最終用途別、セグメント別予測、2022年~2030年Rubber Gloves Market Size, Share & Trends Analysis Report By Material (Latex, Nitrile), By Type (Powdered, Powder-free), By Distribution Channel (Online, Physical), By Product, By End-use, And Segment Forecasts, 2022 - 2030 |
||||||
|
|
|||||||
|
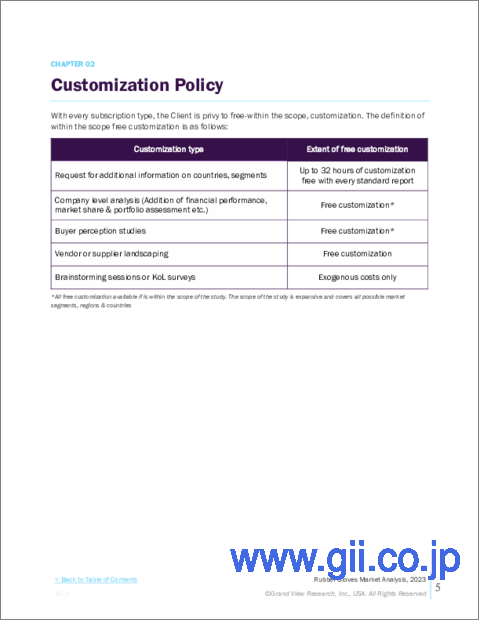
● お客様のご希望に応じて、既存データの加工や未掲載情報(例:国別セグメント)の追加などの対応が可能です。 詳細はお問い合わせください。 |
|||||||


| ゴム手袋の市場規模、シェア、動向分析レポート:素材別(ラテックス、ニトリル)、タイプ別(粉末、粉末なし)、流通チャネル別(オンライン、実店舗)、製品別、最終用途別、セグメント別予測、2022年~2030年 |
|
出版日: 2022年09月05日
発行: Grand View Research
ページ情報: 英文 150 Pages
納期: 2~10営業日
|
- 全表示
- 概要
- 図表
- 目次
ゴム手袋の市場成長と動向
Grand View Research, Incの最新レポートによると、ゴム手袋の世界市場規模は2030年までに182億8000万米ドルに達し、予測期間中にCAGR3.9%で拡大すると予測されています。ドイツ、イタリア、インド、オーストラリア、英国などの国々で医療に対する政府支出が増加していることが、予測期間中の業界拡大を後押ししそうです。COVID-19の世界の流行は、ガウン、手袋、顔面シールド、マスクなどの個人用保護具(PPE)の必要性を増大させました。世界各国の政府は、市場での十分な供給を確保し、将来のウイルス拡散を回避するために、ゴム手袋メーカーと連携しています。
自動車、石油・ガス、建設、クリーンルーム、金属・設備、化学などの産業における製品使用の増加が、業界の成長を促進しています。これは、労働安全衛生局(OSHA)のような、労働者の安全を管理する強力な規則が多数の国に存在することと、職場の危険に関連する高い費用に起因します。ベーカリーやパッケージ商品、レストランなど、飲食品分野の事業者が自社製品を直接触れないようにすることに注力するにつれ、製品需要は増加すると予測されます。これは、食品衛生や、食品の劣化や誤用による病気の予防に対する消費者の意識が高まっていることと関係していると思われます。
職場の危険に関する厳しい規制や高いコストを理由に、職場における労働者の安全とセキュリティの重要性に関する業界関係者の意識が高まっていることが、業界の成長を促進すると予想されます。アジア太平洋および中東地域の産業界における雇用の増加により、労働者の安全の重要性は著しく高まっています。同市場のメーカーは、製品ラインの拡充や生産能力増強のために、提携や合併、買収を模索しています。また、石油・ガス、ヘルスケア、製薬などの重要な最終用途産業からの需要増に対応するため、製造設備の増強にも力を入れています。
ゴム手袋市場レポートハイライト
天然ゴムセグメントは、高弾性や耐薬品性などの特徴から医療や飲食品分野で広く使用されており、2021年の売上高シェアは最大となっています。
使い捨てゴム手袋は、低コストと使い捨てという特徴から、2022年から2030年にかけて大きなCAGRを記録すると予測されています。
パウダーフリー製品は、湿気の多い環境での使用に適しており、皮膚感染を引き起こす可能性のあるパウダー付き手袋の使用を禁止する厳しい規制が存在するため、2022年から2030年まで最も速いCAGRで上昇すると予想されます。
感染症や手指の怪我を最小限に抑えるため、重工業分野での製品採用が多いことから、2021年の売上シェアは欧州が最大となりました。
さらに、イタリア、ウクライナ、フランス、クロアチアなどの国々でCOVID-19の大流行による大きな需要が、この地域の成長を支えています。
市場参入企業が競争優位性を獲得するための戦略には、サプライチェーンの開拓、パートナーシップ、バリューチェーンの統合、流通網の拡大などが含まれる
目次
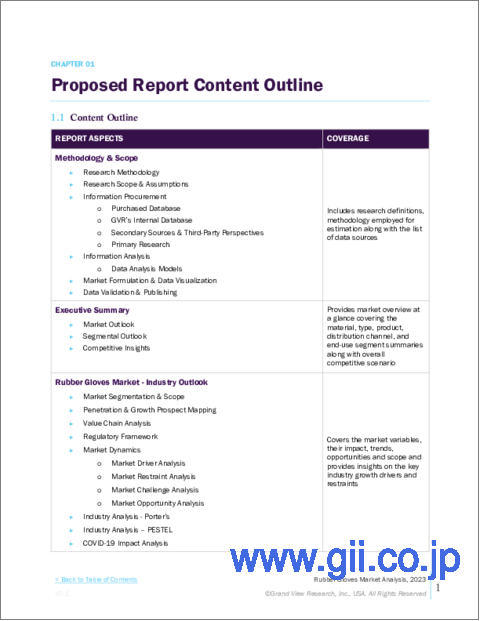
第1章 調査手法と範囲
- 調査手法
- 調査範囲と前提
- 情報調達
- 購入したデータベース
- GVRの内部データベース
- 二次情報と第三者の視点
- 1次調査
- 情報分析
- データ分析モデル
- 市場形成とデータ可視化
- データの検証と公開
第2章 エグゼクティブサマリー
- 市場の見通し
- セグメント別見通し
- 競合考察
第3章 市場変数、動向、および範囲
- 市場セグメンテーションと範囲
- 浸透と成長の見通しのマッピング
- 業界バリューチェーン分析
- 規制の枠組み
- 技術フレームワーク
- ゴム手袋市場-市場力学
- 市場促進要因分析
- 市場抑制要因分析
- 業界の課題
- ビジネス環境ツール分析:ゴム手袋市場
- ポーターのファイブフォース分析
- 供給企業の交渉力
- 買い手の交渉力
- 代替の脅威
- 新規参入業者の脅威
- 競争企業間の敵対関係
- PESTLE分析
- 政治情勢
- 経済情勢
- 社会情勢
- テクノロジー情勢
- 環境情勢
- 法的情勢
- 主な戦略的提携
- 合併と買収
- 合弁事業
- ポーターのファイブフォース分析
第4章 COVID-19の影響分析
第5章 ゴム手袋市場:材料の推定・動向分析
- ゴム手袋市場:物質変動分析、2021年および2030年
- 天然ゴム・ラテックス
- ニトリル
- ネオプレン
- その他
第6章 ゴム手袋市場:流通チャネルの推定・動向分析
- ゴム手袋市場:流通チャネルの変動分析、2021年および2030年
- 物理的
- オンライン
第7章 ゴム手袋市場:タイプの推定・動向分析
- ゴム手袋市場:タイプの変動分析、2021年および2030年
- 粉状
- パウダーフリー
第8章 ゴム手袋市場:製品の推定・動向分析
- ゴム手袋市場:製品変動分析、2021 &2030
- 使い捨て
- 耐久性
第9章 ゴム手袋市場:最終用途の推定・動向分析
- ゴム手袋市場:最終用途の変動分析、2021年および2030年
- 医療・ヘルスケア
- 自動車
- 石油ガス
- 飲食品
- 金属・機械
- 化学・石油化学
- 医薬品
- クリーンルーム
- その他
第10章 ゴム手袋市場:地域推定・動向分析
- 地域別変動分析と市場シェア、2021年と2030年
- ゴム手袋市場:地域の変動分析、2021年および2030年
- 北米
- 米国
- カナダ
- メキシコ
- 欧州
- ドイツ
- イタリア
- ロシア
- 英国
- フランス
- スペイン
- アジア太平洋地域
- 中国
- インド
- 日本
- 韓国
- インドネシア
- マレーシア
- オーストラリア
- タイ
- 中南米
- ブラジル
- アルゼンチン
- 中東とアフリカ
- アラブ首長国連邦
- サウジアラビア
- 南アフリカ
第11章 競合情勢
- 主要な世界企業、そのイニシアチブ、および市場への影響
- 主要企業/競合の分類
- 戦略的枠組み
- 公開会社
- 会社の市況分析
- 競合ダッシュボード分析
- 非公開会社
- 主要な新興企業とその地理的プレゼンスのリスト
第12章 企業プロファイル
- Ansell Ltd.
- 会社概要
- 財務実績
- 製品のベンチマーク
- 戦略的イニシアチブ
- Top Glove Corporation Bhd
- 会社概要
- 財務実績
- 製品のベンチマーク
- 戦略的イニシアチブ
- Hartalega Holdings Berhad
- 会社概要
- 財務実績
- 製品のベンチマーク
- 戦略的イニシアチブ
- Unigloves(UK)Ltd.
- 会社概要
- 財務実績
- 製品のベンチマーク
- 戦略的イニシアチブ
- The Glove Company
- 会社概要
- 財務実績
- 製品のベンチマーク
- 戦略的イニシアチブ
- MAPA Professional
- 会社概要
- 財務実績
- 製品のベンチマーク
- 戦略的イニシアチブ
- Adenna LLC
- 会社概要
- 財務実績
- 製品のベンチマーク
- 戦略的イニシアチブ
- MCR Safety
- 会社概要
- 財務実績
- 製品のベンチマーク
- 戦略的イニシアチブ
- Atlantic Safety Products, Inc.
- 会社概要
- 財務実績
- 製品のベンチマーク
- 戦略的イニシアチブ
- Globus(Shetland)Ltd
- 会社概要
- 財務実績
- 製品のベンチマーク
- 戦略的イニシアチブ
- Supermax Corporation Berhad
- 会社概要
- 財務実績
- 製品のベンチマーク
- 戦略的イニシアチブ
- Kossan Rubber Industries Bhd
- 会社概要
- 財務実績
- 製品のベンチマーク
- 戦略的イニシアチブ
- Ammex Corporation
- 会社概要
- 財務実績
- 製品のベンチマーク
- 戦略的イニシアチブ
- Kimberly-Clark Corporation
- 会社概要
- 財務実績
- 製品のベンチマーク
- 戦略的イニシアチブ
- Sempermed USA, Inc.
- 会社概要
- 財務実績
- 製品のベンチマーク
- 戦略的イニシアチブ
List of Tables
- Table 1 Natural rubber/latex gloves market estimates and forecasts, 2017 - 2030 (USD Million)
- Table 2 Nitrile rubber gloves market estimates and forecasts, 2017 - 2030 (USD Million)
- Table 3 Neoprene rubber gloves market estimates and forecasts, 2017 - 2030 (USD Million)
- Table 4 Other rubber gloves market estimates and forecasts, 2017 - 2030 (USD Million)
- Table 5 Disposable rubber gloves market estimates and forecasts, 2017 - 2030 (USD Million)
- Table 6 Durable rubber gloves market estimates and forecasts, 2017 - 2030 (USD Million)
- Table 7 Powered rubber gloves market estimates and forecasts, 2017 - 2030 (USD Million)
- Table 8 Powder-free rubber gloves market estimates and forecasts, 2017 - 2030 (USD Million)
- Table 9 Rubber gloves market estimates and forecasts, by physical distribution channel, 2017 - 2030 (USD Million)
- Table 10 Rubber gloves market estimates and forecasts, by online distribution channel, 2017 - 2030 (USD Million)
- Table 11 Rubber gloves market estimates and forecasts, in medical & healthcare, 2017 - 2030 (USD Million)
- Table 12 Rubber gloves market estimates and forecasts, in automotive, 2017 - 2030 (USD Million)
- Table 13 Rubber gloves market estimates and forecasts, in oil & gas, 2017 - 2030 (USD Million)
- Table 14 Rubber gloves market estimates and forecasts, in food & beverage, 2017 - 2030 (USD Million)
- Table 15 Rubber gloves market estimates and forecasts, in metal & machinery, 2017 - 2030 (USD Million)
- Table 16 Rubber gloves market estimates and forecasts, in chemical & petrochemical, 2017 - 2030 (USD Million)
- Table 17 Rubber gloves market estimates and forecasts, in pharmaceutical, 2017 - 2030 (USD Million)
- Table 18 Rubber gloves market estimates and forecasts, in a cleanroom, 2017 - 2030 (USD Million)
- Table 19 Rubber gloves market estimates and forecasts, in others, 2017 - 2030 (USD Million)
- Table 20 North America rubber gloves market estimates and forecasts, 2017 - 2030 (USD Million)
- Table 21 North America rubber gloves market estimates and forecasts, by material, 2017 - 2030 (USD Million)
- Table 22 North America rubber gloves market estimates and forecasts, by distribution channel, 2017 - 2030 (USD Million)
- Table 23 North America rubber gloves market estimates and forecasts, by type, 2017 - 2030 (USD Million)
- Table 24 North America rubber gloves market estimates and forecasts, by product, 2017 - 2030 (USD Million)
- Table 25 North America rubber gloves market estimates and forecasts, by end-use, 2017 - 2030 (USD Million)
- Table 26 U.S. rubber gloves market estimates and forecasts, 2017 - 2030 (USD Million)
- Table 27 U.S. rubber gloves market estimates and forecasts, by material, 2017 - 2030 (USD Million)
- Table 28 U.S. rubber gloves market estimates and forecasts, by distribution channel, 2017 - 2030 (USD Million)
- Table 29 U.S. rubber gloves market estimates and forecasts, by type, 2017 - 2030 (USD Million)
- Table 30 U.S. rubber gloves market estimates and forecasts, by product, 2017 - 2030 (USD Million)
- Table 31 U.S. rubber gloves market estimates and forecasts, by end-use, 2017 - 2030 (USD Million)
- Table 32 Canada rubber gloves market estimates and forecasts, 2017 - 2030 (USD Million)
- Table 33 Canada rubber gloves market estimates and forecasts, by material, 2017 - 2030 (USD Million)
- Table 34 Canada rubber gloves market estimates and forecasts, by distribution channel, 2017 - 2030 (USD Million)
- Table 35 Canada rubber gloves market estimates and forecasts, by type, 2017 - 2030 (USD Million)
- Table 36 Canada rubber gloves market estimates and forecasts, by product, 2017 - 2030 (USD Million)
- Table 37 Canada rubber gloves market estimates and forecasts, by end-use, 2017 - 2030 (USD Million)
- Table 38 Mexico rubber gloves market estimates and forecasts, 2017 - 2030 (USD Million)
- Table 39 Mexico rubber gloves market estimates and forecasts, by material, 2017 - 2030 (USD Million)
- Table 40 Mexico rubber gloves market estimates and forecasts, by distribution channel, 2017 - 2030 (USD Million)
- Table 41 Mexico rubber gloves market estimates and forecasts, by type, 2017 - 2030 (USD Million)
- Table 42 Mexico rubber gloves market estimates and forecasts, by product, 2017 - 2030 (USD Million)
- Table 43 Mexico rubber gloves market estimates and forecasts, by end-use, 2017 - 2030 (USD Million)
- Table 44 Europe rubber gloves market estimates and forecasts, 2017 - 2030 (USD Million)
- Table 45 Europe rubber gloves market estimates and forecasts, by material, 2017 - 2030 (USD Million)
- Table 46 Europe rubber gloves market estimates and forecasts, by distribution channel, 2017 - 2030 (USD Million)
- Table 47 Europe rubber gloves market estimates and forecasts, by type, 2017 - 2030 (USD Million)
- Table 48 Table 50 Europe rubber gloves market estimates and forecasts, by product, 2017 - 2030 (USD Million)
- Table 49 Europe rubber gloves market estimates and forecasts, by end-use, 2017 - 2030 (USD Million)
- Table 50 Germany rubber gloves market estimates and forecasts, 2017 - 2030 (USD Million)
- Table 51 Germany rubber gloves market estimates and forecasts, by material, 2017 - 2030 (USD Million)
- Table 52 Germany rubber gloves market estimates and forecasts, by distribution channel, 2017 - 2030 (USD Million)
- Table 53 Germany rubber gloves market estimates and forecasts, by type, 2017 - 2030 (USD Million)
- Table 54 Germany rubber gloves market estimates and forecasts, by product, 2017 - 2030 (USD Million)
- Table 55 Germany rubber gloves market estimates and forecasts, by end-use, 2017 - 2030 (USD Million)
- Table 56 U.K. rubber gloves market estimates and forecasts, 2017 - 2030 (USD Million)
- Table 57 U.K. rubber gloves market estimates and forecasts, by material, 2017 - 2030 (USD Million)
- Table 58 U.K. rubber gloves market estimates and forecasts, by distribution channel, 2017 - 2030 (USD Million)
- Table 59 U.K. rubber gloves market estimates and forecasts, by type, 2017 - 2030 (USD Million)
- Table 60 U.K. rubber gloves market estimates and forecasts, by product, 2017 - 2030 (USD Million)
- Table 61 U.K. rubber gloves market estimates and forecasts, by end-use, 2017 - 2030 (USD Million)
- Table 62 France rubber gloves market estimates and forecasts, 2017 - 2030 (USD Million)
- Table 63 France rubber gloves market estimates and forecasts, by material, 2017 - 2030 (USD Million)
- Table 64 France rubber gloves market estimates and forecasts, by distribution channel, 2017 - 2030 (USD Million)
- Table 65 France rubber gloves market estimates and forecasts, by type, 2017 - 2030 (USD Million)
- Table 66 France rubber gloves market estimates and forecasts, by product, 2017 - 2030 (USD Million)
- Table 67 France rubber gloves market estimates and forecasts, by end-use, 2017 - 2030 (USD Million)
- Table 68 Russia rubber gloves market estimates and forecasts, 2017 - 2030 (USD Million)
- Table 69 Russia rubber gloves market estimates and forecasts, by material, 2017 - 2030 (USD Million)
- Table 70 Russia rubber gloves market estimates and forecasts, by distribution channel, 2017 - 2030 (USD Million)
- Table 71 Russia rubber gloves market estimates and forecasts, by type, 2017 - 2030 (USD Million)
- Table 72 Russia rubber gloves market estimates and forecasts, by product, 2017 - 2030 (USD Million)
- Table 73 Russia rubber gloves market estimates and forecasts, by end-use, 2017 - 2030 (USD Million)
- Table 74 Italy rubber gloves market estimates and forecasts, 2017 - 2030 (USD Million)
- Table 75 Italy rubber gloves market estimates and forecasts, by material, 2017 - 2030 (USD Million)
- Table 76 Italy rubber gloves market estimates and forecasts, by distribution channel, 2017 - 2030 (USD Million)
- Table 77 Italy rubber gloves market estimates and forecasts, by type, 2017 - 2030 (USD Million)
- Table 78 Italy rubber gloves market estimates and forecasts, by product, 2017 - 2030 (USD Million)
- Table 79 Italy rubber gloves market estimates and forecasts, by end-use, 2017 - 2030 (USD Million)
- Table 80 Spain rubber gloves market estimates and forecasts, 2017 - 2030 (USD Million)
- Table 81 Spain rubber gloves market estimates and forecasts, by material, 2017 - 2030 (USD Million)
- Table 82 Spain rubber gloves market estimates and forecasts, by distribution channel, 2017 - 2030 (USD Million)
- Table 83 Spain rubber gloves market estimates and forecasts, by type, 2017 - 2030 (USD Million)
- Table 84 Spain rubber gloves market estimates and forecasts, by product, 2017 - 2030 (USD Million)
- Table 85 Spain rubber gloves market estimates and forecasts, by end-use, 2017 - 2030 (USD Million)
- Table 86 Asia Pacific rubber gloves market estimates and forecasts, 2017 - 2030 (USD Million)
- Table 87 Asia Pacific rubber gloves market estimates and forecasts, by material, 2017 - 2030 (USD Million)
- Table 88 Asia Pacific rubber gloves market estimates and forecasts, by distribution channel, 2017 - 2030 (USD Million)
- Table 89 Asia Pacific rubber gloves market estimates and forecasts, by type, 2017 - 2030 (USD Million)
- Table 90 Asia Pacific rubber gloves market estimates and forecasts, by product, 2017 - 2030 (USD Million)
- Table 91 Asia Pacific rubber gloves market estimates and forecasts, by end-use, 2017 - 2030 (USD Million)
- Table 92 China rubber gloves market estimates and forecasts, 2017 - 2030 (USD Million)
- Table 93 China rubber gloves market estimates and forecasts, by material, 2017 - 2030 (USD Million)
- Table 94 China rubber gloves market estimates and forecasts, by distribution channel, 2017 - 2030 (USD Million)
- Table 95 China rubber gloves market estimates and forecasts, by type, 2017 - 2030 (USD Million)
- Table 96 China rubber gloves market estimates and forecasts, by product, 2017 - 2030 (USD Million)
- Table 97 China rubber gloves market estimates and forecasts, by end-use, 2017 - 2030 (USD Million)
- Table 98 India rubber gloves market estimates and forecasts, 2017 - 2030 (USD Million)
- Table 99 India rubber gloves market estimates and forecasts, by material, 2017 - 2030 (USD Million)
- Table 100 India rubber gloves market estimates and forecasts, by distribution channel, 2017 - 2030 (USD Million)
- Table 101 India rubber gloves market estimates and forecasts, by type, 2017 - 2030 (USD Million)
- Table 102 India rubber gloves market estimates and forecasts, by product, 2017 - 2030 (USD Million)
- Table 103 India rubber gloves market estimates and forecasts, by end-use, 2017 - 2030 (USD Million)
- Table 104 Japan rubber gloves market estimates and forecasts, 2017 - 2030 (USD Million)
- Table 105 Japan rubber gloves market estimates and forecasts, by material, 2017 - 2030 (USD Million)
- Table 106 Japan rubber gloves market estimates and forecasts, by distribution channel, 2017 - 2030 (USD Million)
- Table 107 Japan rubber gloves market estimates and forecasts, by type, 2017 - 2030 (USD Million)
- Table 108 Japan rubber gloves market estimates and forecasts, by product, 2017 - 2030 (USD Million)
- Table 109 Japan rubber gloves market estimates and forecasts, by end-use, 2017 - 2030 (USD Million)
- Table 110 Australia rubber gloves market estimates and forecasts, 2017 - 2030 (USD Million)
- Table 111 Australia rubber gloves market estimates and forecasts, by material, 2017 - 2030 (USD Million)
- Table 112 Australia rubber gloves market estimates and forecasts, by distribution channel, 2017 - 2030 (USD Million)
- Table 113 Australia rubber gloves market estimates and forecasts, by type, 2017 - 2030 (USD Million)
- Table 114 Australia rubber gloves market estimates and forecasts, by product, 2017 - 2030 (USD Million)
- Table 115 Australia rubber gloves market estimates and forecasts, by end-use, 2017 - 2030 (USD Million)
- Table 116 South Korea rubber gloves market estimates and forecasts, 2017 - 2030 (USD Million)
- Table 117 South Korea rubber gloves market estimates and forecasts, by material, 2017 - 2030 (USD Million)
- Table 118 South Korea rubber gloves market estimates and forecasts, by distribution channel, 2017 - 2030 (USD Million)
- Table 119 South Korea rubber gloves market estimates and forecasts, by type, 2017 - 2030 (USD Million)
- Table 120 South Korea rubber gloves market estimates and forecasts, by product, 2017 - 2030 (USD Million)
- Table 121 South Korea rubber gloves market estimates and forecasts, by end-use, 2017 - 2030 (USD Million)
- Table 122 Indonesia rubber gloves market estimates and forecasts, 2017 - 2030 (USD Million)
- Table 123 Indonesia rubber gloves market estimates and forecasts, by material, 2017 - 2030 (USD Million)
- Table 124 Indonesia rubber gloves market estimates and forecasts, by distribution channel, 2017 - 2030 (USD Million)
- Table 125 Indonesia rubber gloves market estimates and forecasts, by type, 2017 - 2030 (USD Million)
- Table 126 Indonesia rubber gloves market estimates and forecasts, by product, 2017 - 2030 (USD Million)
- Table 127 Indonesia rubber gloves market estimates and forecasts, by end-use, 2017 - 2030 (USD Million)
- Table 128 Malaysia rubber gloves market estimates and forecasts, 2017 - 2030 (USD Million)
- Table 129 Malaysia rubber gloves market estimates and forecasts, by material, 2017 - 2030 (USD Million)
- Table 130 Malaysia rubber gloves market estimates and forecasts, by distribution channel, 2017 - 2030 (USD Million)
- Table 131 Malaysia rubber gloves market estimates and forecasts, by type, 2017 - 2030 (USD Million)
- Table 132 Malaysia rubber gloves market estimates and forecasts, by product, 2017 - 2030 (USD Million)
- Table 133 Malaysia rubber gloves market estimates and forecasts, by end-use, 2017 - 2030 (USD Million)
- Table 134 Thailand rubber gloves market estimates and forecasts, 2017 - 2030 (USD Million)
- Table 135 Thailand rubber gloves market estimates and forecasts, by material, 2017 - 2030 (USD Million)
- Table 136 Thailand rubber gloves market estimates and forecasts, by distribution channel, 2017 - 2030 (USD Million)
- Table 137 Thailand rubber gloves market estimates and forecasts, by type, 2017 - 2030 (USD Million)
- Table 138 Thailand rubber gloves market estimates and forecasts, by product, 2017 - 2030 (USD Million)
- Table 139 Thailand rubber gloves market estimates and forecasts, by end-use, 2017 - 2030 (USD Million)
- Table 140 Central & South America rubber gloves market estimates and forecasts, 2017 - 2030 (USD Million)
- Table 141 Central & South America rubber gloves market estimates and forecasts, by material, 2017 - 2030 (USD Million)
- Table 142 Central & South America rubber gloves market estimates and forecasts, by distribution channel, 2017 - 2030 (USD Million)
- Table 143 Central & South America rubber gloves market estimates and forecasts, by type, 2017 - 2030 (USD Million)
- Table 144 Central & South America rubber gloves market estimates and forecasts, by product, 2017 - 2030 (USD Million)
- Table 145 Central & South America rubber gloves market estimates and forecasts, by end-use, 2017 - 2030 (USD Million)
- Table 146 Brazil rubber gloves market estimates and forecasts, 2017 - 2030 (USD Million)
- Table 147 Brazil rubber gloves market estimates and forecasts, by material, 2017 - 2030 (USD Million)
- Table 148 Brazil rubber gloves market estimates and forecasts, by distribution channel, 2017 - 2030 (USD Million)
- Table 149 Brazil rubber gloves market estimates and forecasts, by type, 2017 - 2030 (USD Million)
- Table 150 Brazil rubber gloves market estimates and forecasts, by product, 2017 - 2030 (USD Million)
- Table 151 Brazil rubber gloves market estimates and forecasts, by end-use, 2017 - 2030 (USD Million)
- Table 152 Argentina rubber gloves market estimates and forecasts, 2017 - 2030 (USD Million)
- Table 153 Argentina rubber gloves market estimates and forecasts, by material, 2017 - 2030 (USD Million)
- Table 154 Argentina rubber gloves market estimates and forecasts, by distribution channel, 2017 - 2030 (USD Million)
- Table 155 Argentina rubber gloves market estimates and forecasts, by type, 2017 - 2030 (USD Million)
- Table 156 Argentina rubber gloves market estimates and forecasts, by product, 2017 - 2030 (USD Million)
- Table 157 Argentina rubber gloves market estimates and forecasts, by end-use, 2017 - 2030 (USD Million)
- Table 158 Middle East & Africa rubber gloves market estimates and forecasts, 2017 - 2030 (USD Million)
- Table 159 Middle East & Africa rubber gloves market estimates and forecasts, by material, 2017 - 2030 (USD Million)
- Table 160 Middle East & Africa rubber gloves market estimates and forecasts, by distribution channel, 2017 - 2030 (USD Million)
- Table 161 Middle East & Africa rubber gloves market estimates and forecasts, by type, 2017 - 2030 (USD Million)
- Table 162 Middle East & Africa rubber gloves market estimates and forecasts, by product, 2017 - 2030 (USD Million)
- Table 163 Middle East & Africa rubber gloves market estimates and forecasts, by end-use, 2017 - 2030 (USD Million)
- Table 164 Saudi Arabia rubber gloves market estimates and forecasts, 2017 - 2030 (USD Million)
- Table 165 Saudi Arabia rubber gloves market estimates and forecasts, by material, 2017 - 2030 (USD Million)
- Table 166 Saudi Arabia rubber gloves market estimates and forecasts, by distribution channel, 2017 - 2030 (USD Million)
- Table 167 Saudi Arabia rubber gloves market estimates and forecasts, by type, 2017 - 2030 (USD Million)
- Table 168 Saudi Arabia rubber gloves market estimates and forecasts, by product, 2017 - 2030 (USD Million)
- Table 169 Saudi Arabia rubber gloves market estimates and forecasts, by end-use, 2017 - 2030 (USD Million)
- Table 170 UAE rubber gloves market estimates and forecasts, 2017 - 2030 (USD Million)
- Table 171 UAE rubber gloves market estimates and forecasts, by material, 2017 - 2030 (USD Million)
- Table 172 UAE rubber gloves market estimates and forecasts, by distribution channel, 2017 - 2030 (USD Million)
- Table 173 UAE rubber gloves market estimates and forecasts, by type, 2017 - 2030 (USD Million)
- Table 174 UAE rubber gloves market estimates and forecasts, by product, 2017 - 2030 (USD Million)
- Table 175 UAE rubber gloves market estimates and forecasts, by end-use, 2017 - 2030 (USD Million)
- Table 176 South Africa rubber gloves market estimates and forecasts, 2017 - 2030 (USD Million)
- Table 177 South Africa rubber gloves market estimates and forecasts, by material, 2017 - 2030 (USD Million)
- Table 178 South Africa rubber gloves market estimates and forecasts, by distribution channel, 2017 - 2030 (USD Million)
- Table 179 South Africa rubber gloves market estimates and forecasts, by type, 2017 - 2030 (USD Million)
- Table 180 South Africa rubber gloves market estimates and forecasts, by product, 2017 - 2030 (USD Million)
- Table 181 South Africa rubber gloves market estimates and forecasts, by end-use, 2017 - 2030 (USD Million)
List of Figures
- Fig. 1 Information Procurement
- Fig. 2 Primary Research Pattern
- Fig. 3 Primary Research Process
- Fig. 4 Market Research Approaches - Bottom-Up Approach
- Fig. 5 Market Research Approaches - Top Down Approach
- Fig. 6 Market Research Approaches - Combined Approach
- Fig. 7 Market Outlook
- Fig. 8 Segmental Outlook
- Fig. 9 Competitive Insights
- Fig. 10 Market Segmentation & Scope
- Fig. 11 Value Chain Analysis
- Fig. 12 Market Driver Analysis
- Fig. 13 Market Restraint Analysis
- Fig. 14 Market Opportunity Analysis
- Fig. 15 Market Challenges Analysis
- Fig. 16 Rubber Gloves Market: Material Movement Analysis, 2021 & 2030
- Fig. 17 Rubber Gloves Market: Type Movement Analysis, 2021 & 2030
- Fig. 18 Rubber Gloves Market: Product Movement Analysis, 2021 & 2030
- Fig. 19 Rubber Gloves Market: Distribution Channel Movement Analysis, 2021 & 2030
- Fig. 20 Rubber Gloves Market: End-Use Movement Analysis, 2021 & 2030
- Fig. 21 Key Company/Competition Categorization
- Fig. 22 Competitive Dashboard Analysis
- Fig. 23 Company Market Position Analysis
Rubber Gloves Market Growth & Trends:
The global rubber gloves market size is expected to reach USD 18.28 billion by 2030, according to a new report by Grand View Research, Inc, expanding at a CAGR of 3.9% over the forecast period. Rising government spending on healthcare in countries, such as Germany, Italy, India, Australia, and the U.K., is likely to boost industry expansion over the forecasted period. The global COVID-19 pandemic augmented the need for Personal Protective Equipment (PPE), such as gowns, gloves, face shields, and masks. Governments from across the world are coordinating with rubber glove makers to ensure enough supply in the market and avoid future virus spread.
Rising product usage in industries, such as automotive, oil & gas, construction, clean room, metal & equipment, and chemicals, is driving the industry growth. This is due to the presence of strong rules governing worker safety in numerous nations, such as the Occupational Safety and Health Administration (OSHA), as well as the high expenses associated with workplace dangers. The product demand is predicted to increase as more food & beverage sector operators, such as bakeries, packaged goods, and restaurants, focus on making their products free of direct touch. This can be related to increased consumer awareness about food hygiene and the prevention of illnesses caused by food deterioration and misuse.
Increasing awareness among industry participants regarding the importance of worker safety and security at workplaces, on account of the stringent regulations and high costs associated with workplace hazards, is anticipated to drive industry growth. The importance of worker safety has significantly increased owing to the growing employment in industries across the Asia Pacific and the Middle East regions. Manufacturers in the market are seeking collaborations, mergers, and acquisitions to expand their product lines and increase production capacity. They are also focusing on increasing their manufacturing facilities to accommodate rising demand from critical end-use industries, such as oil & gas, healthcare, and pharmaceutical.
Rubber Gloves Market Report Highlights:
- The natural rubber segment accounted for the maximum revenue share in 2021 due to widespread use of these products in the medical and food & beverage sectors on account of their features, such as high elasticity and chemical resistance
- The adoption of disposable rubber gloves is estimated to witness a significant CAGR from 2022 to 2030 due to the low cost and single-use characteristic of these products
- The powder-free products segment is expected to rise at the fastest CAGR from 2022 to 2030 owing to the suitability of these products for use in damp environments and the presence of strict regulations prohibiting the use of powdered gloves, which can cause skin infections
- Europe accounted for the maximum revenue share in 2021 due to high product adoption in heavy-duty sectors to minimize infections and hand injuries
- Moreover, significant demand in nations, such as Italy, Ukraine, France, and Croatia, due to the COVID-19 pandemic supported the region's growth
- Market participants' strategies for gaining a competitive advantage include supply chain development, partnerships, value chain integration, and distribution network growth
Table of Contents
Chapter 1. Methodology and Scope
- 1.1. Research Methodology
- 1.2. Research Scope and Assumptions
- 1.3. Information Procurement
- 1.3.1. Purchased Database
- 1.3.2. GVR's Internal Database
- 1.3.3. Secondary Sources & Third-Party Perspectives
- 1.3.4. Primary Research
- 1.4. Information Analysis
- 1.4.1. Data Analysis Models
- 1.5. Market Formulation & Data Visualization
- 1.6. Data Validation & Publishing
Chapter 2. Executive Summary
- 2.1. Market Outlook
- 2.2. Segmental Outlook
- 2.3. Competitive Insights
Chapter 3. Market Variables, Trends, and Scope
- 3.1. Market Segmentation & Scope
- 3.2. Penetration & Growth Prospect Mapping
- 3.3. Industry Value Chain Analysis
- 3.4. Regulatory Framework
- 3.5. Technology Framework
- 3.6. Rubber Gloves Market - Market Dynamics
- 3.6.1. Market Driver Analysis
- 3.6.2. Market Restraint Analysis
- 3.6.3. Industry Challenges
- 3.7. Business Environmental Tools Analysis: Rubber Gloves Market
- 3.7.1. Porter's Five Forces Analysis
- 3.7.1.1. Bargaining Power of Suppliers
- 3.7.1.2. Bargaining Power of Buyers
- 3.7.1.3. Threat of Substitution
- 3.7.1.4. Threat of New Entrants
- 3.7.1.5. Competitive Rivalry
- 3.7.2. PESTLE Analysis
- 3.7.2.1. Political Landscape
- 3.7.2.2. Economic Landscape
- 3.7.2.3. Social Landscape
- 3.7.2.4. Technology Landscape
- 3.7.2.5. Environmental Landscape
- 3.7.2.6. Legal Landscape
- 3.7.3. Major Strategic Alliances
- 3.7.3.1. Mergers & Acquisitions
- 3.7.3.2. Joint Ventures
- 3.7.1. Porter's Five Forces Analysis
Chapter 4. COVID-19 Impact Analysis
Chapter 5. Rubber Gloves Market: Material Estimates & Trend Analysis
- 5.1. Rubber Gloves Market: Material Movement Analysis, 2021 & 2030
- 5.2. Natural Rubber/Latex
- 5.2.1. Market estimates and forecasts, 2017 - 2030 (USD Million)
- 5.3. Nitrile
- 5.3.1. Market estimates and forecasts, 2017 - 2030 (USD Million)
- 5.4. Neoprene
- 5.4.1. Market estimates and forecasts, 2017 - 2030 (USD Million)
- 5.5. Others
- 5.5.1. Market estimates and forecasts, 2017 - 2030 (USD Million)
Chapter 6. Rubber Gloves Market: Distribution Channel Estimates & Trend Analysis
- 6.1. Rubber Gloves Market: Distribution Channel Movement Analysis, 2021 & 2030
- 6.2. Physical
- 6.2.1. Market estimates and forecasts, 2017 - 2030 (USD Million)
- 6.3. Online
- 6.3.1. Market estimates and forecasts, 2017 - 2030 (USD Million)
Chapter 7. Rubber Gloves Market: Type Estimates & Trend Analysis
- 7.1. Rubber Gloves Market: Type Movement Analysis, 2021 & 2030
- 7.2. Powdered
- 7.2.1. Market estimates and forecasts, 2017 - 2030 (USD Million)
- 7.3. Powder-free
- 7.3.1. Market estimates and forecasts, 2017 - 2030 (USD Million)
Chapter 8. Rubber Gloves Market: Product Estimates & Trend Analysis
- 8.1. Rubber Gloves Market: Product Movement Analysis, 2021 & 2030
- 8.2. Disposable
- 8.2.1. Market estimates and forecasts, 2017 - 2030 (USD Million)
- 8.3. Durable
- 8.3.1. Market estimates and forecasts, 2017 - 2030 (USD Million)
Chapter 9. Rubber Gloves Market: End-use Estimates & Trend Analysis
- 9.1. Rubber Gloves Market: End-use Movement Analysis, 2021 & 2030
- 9.2. Medical & Healthcare
- 9.2.1. Market estimates and forecasts, 2017 - 2030 (USD Million)
- 9.3. Automotive
- 9.3.1. Market estimates and forecasts, 2017 - 2030 (USD Million)
- 9.4. Oil & Gas
- 9.4.1. Market estimates and forecasts, 2017 - 2030 (USD Million)
- 9.5. Food & Beverage
- 9.5.1. Market estimates and forecasts, 2017 - 2030 (USD Million)
- 9.6. Metal & Machinery
- 9.6.1. Market estimates and forecasts, 2017 - 2030 (USD Million)
- 9.7. Chemical & Petrochemical
- 9.7.1. Market estimates and forecasts, 2017 - 2030 (USD Million)
- 9.8. Pharmaceutical
- 9.8.1. Market estimates and forecasts, 2017 - 2030 (USD Million)
- 9.9. Cleanroom
- 9.9.1. Market estimates and forecasts, 2017 - 2030 (USD Million)
- 9.10. Others
- 9.10.1. Market estimates and forecasts, 2017 - 2030 (USD Million)
Chapter 10. Rubber Gloves Market: Regional Estimates & Trend Analysis
- 10.1. Regional Movement Analysis & Market Share, 2021 & 2030
- 10.2. Rubber Gloves Market: Regional Movement Analysis, 2021 & 2030
- 10.3. North America
- 10.3.1. Market estimates and forecasts, 2017 - 2030 (USD Million)
- 10.3.2. Market estimates and forecasts, by product, 2017 - 2030 (USD Million)
- 10.3.3. Market estimates and forecasts, by distribution channel, 2017 - 2030 (USD Million)
- 10.3.4. Market estimates and forecasts, by type, 2017 - 2030 (USD Million)
- 10.3.5. Market estimates and forecasts, by material, 2017 - 2030 (USD Million)
- 10.3.6. Market estimates and forecasts, by end-use, 2017 - 2030 (USD Million)
- 10.3.7. U.S.
- 10.3.7.1. Market estimates and forecasts, 2017 - 2030 (USD Million)
- 10.3.7.2. Market estimates and forecasts, by product, 2017 - 2030 (USD Million)
- 10.3.7.3. Market estimates and forecasts, by distribution channel, 2017 - 2030 (USD Million)
- 10.3.7.4. Market estimates and forecasts, by type, 2017 - 2030 (USD Million)
- 10.3.7.5. Market estimates and forecasts, by material, 2017 - 2030 (USD Million)
- 10.3.7.6. Market estimates and forecasts, by end-use, 2017 - 2030 (USD Million)
- 10.3.8. Canada
- 10.3.8.1. Market estimates and forecasts, 2017 - 2030 (USD Million)
- 10.3.8.2. Market estimates and forecasts, by product, 2017 - 2030 (USD Million)
- 10.3.8.3. Market estimates and forecasts, by distribution channel, 2017 - 2030 (USD Million)
- 10.3.8.4. Market estimates and forecasts, by type, 2017 - 2030 (USD Million)
- 10.3.8.5. Market estimates and forecasts, by material, 2017 - 2030 (USD Million)
- 10.3.8.6. Market estimates and forecasts, by end-use, 2017 - 2030 (USD Million)
- 10.3.9. Mexico
- 10.3.9.1. Market estimates and forecasts, 2017 - 2030 (USD Million)
- 10.3.9.2. Market estimates and forecasts, by product, 2017 - 2030 (USD Million)
- 10.3.9.3. Market estimates and forecasts, by distribution channel, 2017 - 2030 (USD Million)
- 10.3.9.4. Market estimates and forecasts, by type, 2017 - 2030 (USD Million)
- 10.3.9.5. Market estimates and forecasts, by material, 2017 - 2030 (USD Million)
- 10.3.9.6. Market estimates and forecasts, by end-use, 2017 - 2030 (USD Million)
- 10.4. Europe
- 10.4.1. Market estimates and forecasts, 2017 - 2030 (USD Million)
- 10.4.2. Market estimates and forecasts, by product, 2017 - 2030 (USD Million)
- 10.4.3. Market estimates and forecasts, by distribution channel, 2017 - 2030 (USD Million)
- 10.4.4. Market estimates and forecasts, by type, 2017 - 2030 (USD Million)
- 10.4.5. Market estimates and forecasts, by material, 2017 - 2030 (USD Million)
- 10.4.6. Market estimates and forecasts, by end-use, 2017 - 2030 (USD Million)
- 10.4.7. Germany
- 10.4.7.1. Market estimates and forecasts, 2017 - 2030 (USD Million)
- 10.4.7.2. Market estimates and forecasts, by product, 2017 - 2030 (USD Million)
- 10.4.7.3. Market estimates and forecasts, by distribution channel, 2017 - 2030 (USD Million)
- 10.4.7.4. Market estimates and forecasts, by type, 2017 - 2030 (USD Million)
- 10.4.7.5. Market estimates and forecasts, by material, 2017 - 2030 (USD Million)
- 10.4.7.6. Market estimates and forecasts, by end-use, 2017 - 2030 (USD Million)
- 10.4.8. Italy
- 10.4.8.1. Market estimates and forecasts, 2017 - 2030 (USD Million)
- 10.4.8.2. Market estimates and forecasts, by product, 2017 - 2030 (USD Million)
- 10.4.8.3. Market estimates and forecasts, by distribution channel, 2017 - 2030 (USD Million)
- 10.4.8.4. Market estimates and forecasts, by type, 2017 - 2030 (USD Million)
- 10.4.8.5. Market estimates and forecasts, by material, 2017 - 2030 (USD Million)
- 10.4.8.6. Market estimates and forecasts, by end-use, 2017 - 2030 (USD Million)
- 10.4.9. Russia
- 10.4.9.1. Market estimates and forecasts, 2017 - 2030 (USD Million)
- 10.4.9.2. Market estimates and forecasts, by product, 2017 - 2030 (USD Million)
- 10.4.9.3. Market estimates and forecasts, by distribution channel, 2017 - 2030 (USD Million)
- 10.4.9.4. Market estimates and forecasts, by type, 2017 - 2030 (USD Million)
- 10.4.9.5. Market estimates and forecasts, by material, 2017 - 2030 (USD Million)
- 10.4.9.6. Market estimates and forecasts, by end-use, 2017 - 2030 (USD Million)
- 10.4.10. U.K.
- 10.4.10.1. Market estimates and forecasts, 2017 - 2030 (USD Million)
- 10.4.10.2. Market estimates and forecasts, by product, 2017 - 2030 (USD Million)
- 10.4.10.3. Market estimates and forecasts, by distribution channel, 2017 - 2030 (USD Million)
- 10.4.10.4. Market estimates and forecasts, by type, 2017 - 2030 (USD Million)
- 10.4.10.5. Market estimates and forecasts, by material, 2017 - 2030 (USD Million)
- 10.4.10.6. Market estimates and forecasts, by end-use, 2017 - 2030 (USD Million)
- 10.4.11. France
- 10.4.11.1. Market estimates and forecasts, 2017 - 2030 (USD Million)
- 10.4.11.2. Market estimates and forecasts, by product, 2017 - 2030 (USD Million)
- 10.4.11.3. Market estimates and forecasts, by distribution channel, 2017 - 2030 (USD Million)
- 10.4.11.4. Market estimates and forecasts, by type, 2017 - 2030 (USD Million)
- 10.4.11.5. Market estimates and forecasts, by material, 2017 - 2030 (USD Million)
- 10.4.11.6. Market estimates and forecasts, by end-use, 2017 - 2030 (USD Million)
- 10.4.12. Spain
- 10.4.12.1. Market estimates and forecasts, 2017 - 2030 (USD Million)
- 10.4.12.2. Market estimates and forecasts, by product, 2017 - 2030 (USD Million)
- 10.4.12.3. Market estimates and forecasts, by distribution channel, 2017 - 2030 (USD Million)
- 10.4.12.4. Market estimates and forecasts, by type, 2017 - 2030 (USD Million)
- 10.4.12.5. Market estimates and forecasts, by material, 2017 - 2030 (USD Million)
- 10.4.12.6. Market estimates and forecasts, by end-use, 2017 - 2030 (USD Million)
- 10.5. Asia Pacific
- 10.5.1. Market estimates and forecasts, 2017 - 2030 (USD Million)
- 10.5.2. Market estimates and forecasts, by product, 2017 - 2030 (USD Million)
- 10.5.3. Market estimates and forecasts, by distribution channel, 2017 - 2030 (USD Million)
- 10.5.4. Market estimates and forecasts, by type, 2017 - 2030 (USD Million)
- 10.5.5. Market estimates and forecasts, by material, 2017 - 2030 (USD Million)
- 10.5.6. Market estimates and forecasts, by end-use, 2017 - 2030 (USD Million)
- 10.5.7. China
- 10.5.7.1. Market estimates and forecasts, 2017 - 2030 (USD Million)
- 10.5.7.2. Market estimates and forecasts, by product, 2017 - 2030 (USD Million)
- 10.5.7.3. Market estimates and forecasts, by distribution channel, 2017 - 2030 (USD Million)
- 10.5.7.4. Market estimates and forecasts, by type, 2017 - 2030 (USD Million)
- 10.5.7.5. Market estimates and forecasts, by material, 2017 - 2030 (USD Million)
- 10.5.7.6. Market estimates and forecasts, by end-use, 2017 - 2030 (USD Million)
- 10.5.8. India
- 10.5.8.1. Market estimates and forecasts, 2017 - 2030 (USD Million)
- 10.5.8.2. Market estimates and forecasts, by product, 2017 - 2030 (USD Million)
- 10.5.8.3. Market estimates and forecasts, by distribution channel, 2017 - 2030 (USD Million)
- 10.5.8.4. Market estimates and forecasts, by type, 2017 - 2030 (USD Million)
- 10.5.8.5. Market estimates and forecasts, by material, 2017 - 2030 (USD Million)
- 10.5.8.6. Market estimates and forecasts, by end-use, 2017 - 2030 (USD Million)
- 10.5.9. Japan
- 10.5.9.1. Market estimates and forecasts, 2017 - 2030 (USD Million)
- 10.5.9.2. Market estimates and forecasts, by product, 2017 - 2030 (USD Million)
- 10.5.9.3. Market estimates and forecasts, by distribution channel, 2017 - 2030 (USD Million)
- 10.5.9.4. Market estimates and forecasts, by type, 2017 - 2030 (USD Million)
- 10.5.9.5. Market estimates and forecasts, by material, 2017 - 2030 (USD Million)
- 10.5.9.6. Market estimates and forecasts, by end-use, 2017 - 2030 (USD Million)
- 10.5.10. South Korea
- 10.5.10.1. Market estimates and forecasts, 2017 - 2030 (USD Million)
- 10.5.10.2. Market estimates and forecasts, by product, 2017 - 2030 (USD Million)
- 10.5.10.3. Market estimates and forecasts, by distribution channel, 2017 - 2030 (USD Million)
- 10.5.10.4. Market estimates and forecasts, by type, 2017 - 2030 (USD Million)
- 10.5.10.5. Market estimates and forecasts, by material, 2017 - 2030 (USD Million)
- 10.5.10.6. Market estimates and forecasts, by end-use, 2017 - 2030 (USD Million)
- 10.5.11. Indonesia
- 10.5.11.1. Market estimates and forecasts, 2017 - 2030 (USD Million)
- 10.5.11.2. Market estimates and forecasts, by product, 2017 - 2030 (USD Million)
- 10.5.11.3. Market estimates and forecasts, by distribution channel, 2017 - 2030 (USD Million)
- 10.5.11.4. Market estimates and forecasts, by type, 2017 - 2030 (USD Million)
- 10.5.11.5. Market estimates and forecasts, by material, 2017 - 2030 (USD Million)
- 10.5.11.6. Market estimates and forecasts, by end-use, 2017 - 2030 (USD Million)
- 10.5.12. Malaysia
- 10.5.12.1. Market estimates and forecasts, 2017 - 2030 (USD Million)
- 10.5.12.2. Market estimates and forecasts, by product, 2017 - 2030 (USD Million)
- 10.5.12.3. Market estimates and forecasts, by distribution channel, 2017 - 2030 (USD Million)
- 10.5.12.4. Market estimates and forecasts, by type, 2017 - 2030 (USD Million)
- 10.5.12.5. Market estimates and forecasts, by material, 2017 - 2030 (USD Million)
- 10.5.12.6. Market estimates and forecasts, by end-use, 2017 - 2030 (USD Million)
- 10.5.13. Australia
- 10.5.13.1. Market estimates and forecasts, 2017 - 2030 (USD Million)
- 10.5.13.2. Market estimates and forecasts, by product, 2017 - 2030 (USD Million)
- 10.5.13.3. Market estimates and forecasts, by distribution channel, 2017 - 2030 (USD Million)
- 10.5.13.4. Market estimates and forecasts, by type, 2017 - 2030 (USD Million)
- 10.5.13.5. Market estimates and forecasts, by material, 2017 - 2030 (USD Million)
- 10.5.13.6. Market estimates and forecasts, by end-use, 2017 - 2030 (USD Million)
- 10.5.14. Thailand
- 10.5.14.1. Market estimates and forecasts, 2017 - 2030 (USD Million)
- 10.5.14.2. Market estimates and forecasts, by product, 2017 - 2030 (USD Million)
- 10.5.14.3. Market estimates and forecasts, by distribution channel, 2017 - 2030 (USD Million)
- 10.5.14.4. Market estimates and forecasts, by type, 2017 - 2030 (USD Million)
- 10.5.14.5. Market estimates and forecasts, by material, 2017 - 2030 (USD Million)
- 10.5.14.6. Market estimates and forecasts, by end-use, 2017 - 2030 (USD Million)
- 10.6. Central & South America
- 10.6.1. Market estimates and forecasts, 2017 - 2030 (USD Million)
- 10.6.2. Market estimates and forecasts, by product, 2017 - 2030 (USD Million)
- 10.6.3. Market estimates and forecasts, by distribution channel, 2017 - 2030 (USD Million)
- 10.6.4. Market estimates and forecasts, by type, 2017 - 2030 (USD Million)
- 10.6.5. Market estimates and forecasts, by material, 2017 - 2030 (USD Million)
- 10.6.6. Market estimates and forecasts, by end-use, 2017 - 2030 (USD Million)
- 10.6.7. Brazil
- 10.6.7.1. Market estimates and forecasts, 2017 - 2030 (USD Million)
- 10.6.7.2. Market estimates and forecasts, by product, 2017 - 2030 (USD Million)
- 10.6.7.3. Market estimates and forecasts, by distribution channel, 2017 - 2030 (USD Million)
- 10.6.7.4. Market estimates and forecasts, by type, 2017 - 2030 (USD Million)
- 10.6.7.5. Market estimates and forecasts, by material, 2017 - 2030 (USD Million)
- 10.6.7.6. Market estimates and forecasts, by end-use, 2017 - 2030 (USD Million)
- 10.6.8. Argentina
- 10.6.8.1. Market estimates and forecasts, 2017 - 2030 (USD Million)
- 10.6.8.2. Market estimates and forecasts, by product, 2017 - 2030 (USD Million)
- 10.6.8.3. Market estimates and forecasts, by distribution channel, 2017 - 2030 (USD Million)
- 10.6.8.4. Market estimates and forecasts, by type, 2017 - 2030 (USD Million)
- 10.6.8.5. Market estimates and forecasts, by material, 2017 - 2030 (USD Million)
- 10.6.8.6. Market estimates and forecasts, by end-use, 2017 - 2030 (USD Million)
- 10.7. Middle East & Africa
- 10.7.1. Market estimates and forecasts, 2017 - 2030 (USD Million)
- 10.7.2. Market estimates and forecasts, by product, 2017 - 2030 (USD Million)
- 10.7.3. Market estimates and forecasts, by distribution channel, 2017 - 2030 (USD Million)
- 10.7.4. Market estimates and forecasts, by type, 2017 - 2030 (USD Million)
- 10.7.5. Market estimates and forecasts, by material, 2017 - 2030 (USD Million)
- 10.7.6. Market estimates and forecasts, by end-use, 2017 - 2030 (USD Million)
- 10.7.7. UAE
- 10.7.7.1. Market estimates and forecasts, 2017 - 2030 (USD Million)
- 10.7.7.2. Market estimates and forecasts, by product, 2017 - 2030 (USD Million)
- 10.7.7.3. Market estimates and forecasts, by distribution channel, 2017 - 2030 (USD Million)
- 10.7.7.4. Market estimates and forecasts, by type, 2017 - 2030 (USD Million)
- 10.7.7.5. Market estimates and forecasts, by material, 2017 - 2030 (USD Million)
- 10.7.7.6. Market estimates and forecasts, by end-use, 2017 - 2030 (USD Million)
- 10.7.8. Saudi Arabia
- 10.7.8.1. Market estimates and forecasts, 2017 - 2030 (USD Million)
- 10.7.8.2. Market estimates and forecasts, by product, 2017 - 2030 (USD Million)
- 10.7.8.3. Market estimates and forecasts, by distribution channel, 2017 - 2030 (USD Million)
- 10.7.8.4. Market estimates and forecasts, by type, 2017 - 2030 (USD Million)
- 10.7.8.5. Market estimates and forecasts, by material, 2017 - 2030 (USD Million)
- 10.7.8.6. Market estimates and forecasts, by end-use, 2017 - 2030 (USD Million)
- 10.7.9. South Africa
- 10.7.9.1. Market estimates and forecasts, 2017 - 2030 (USD Million)
- 10.7.9.2. Market estimates and forecasts, by product, 2017 - 2030 (USD Million)
- 10.7.9.3. Market estimates and forecasts, by distribution channel, 2017 - 2030 (USD Million)
- 10.7.9.4. Market estimates and forecasts, by type, 2017 - 2030 (USD Million)
- 10.7.9.5. Market estimates and forecasts, by material, 2017 - 2030 (USD Million)
- 10.7.9.6. Market estimates and forecasts, by end-use, 2017 - 2030 (USD Million)
Chapter 11. Competitive Landscape
- 11.1. Key Global Players, Their Initiatives, & Its Impact on the Market
- 11.2. Key Company/Competition Categorization
- 11.3. Strategic Framework
- 11.4. Public Companies
- 11.4.1. Company Market Position Analysis
- 11.4.2. Competitive Dashboard Analysis
- 11.5. Private Companies
- 11.5.1. List of Key Emerging Companies and Their Geographical Presence
Chapter 12. Company Profiles
- 12.1. Ansell Ltd.
- 12.1.1. Company overview
- 12.1.2. Financial performance
- 12.1.3. Product benchmarking
- 12.1.4. Strategic initiatives
- 12.2. Top Glove Corporation Bhd
- 12.2.1. Company overview
- 12.2.2. Financial performance
- 12.2.3. Product benchmarking
- 12.2.4. Strategic initiatives
- 12.3. Hartalega Holdings Berhad
- 12.3.1. Company overview
- 12.3.2. Financial performance
- 12.3.3. Product benchmarking
- 12.3.4. Strategic initiatives
- 12.4. Unigloves (U.K.) Ltd.
- 12.4.1. Company overview
- 12.4.2. Financial performance
- 12.4.3. Product benchmarking
- 12.4.4. Strategic initiatives
- 12.5. The Glove Company
- 12.5.1. Company overview
- 12.5.2. Financial performance
- 12.5.3. Product benchmarking
- 12.5.4. Strategic initiatives
- 12.6. MAPA Professional
- 12.6.1. Company overview
- 12.6.2. Financial performance
- 12.6.3. Product benchmarking
- 12.6.4. Strategic initiatives
- 12.7. Adenna LLC
- 12.7.1. Company overview
- 12.7.2. Financial performance
- 12.7.3. Product benchmarking
- 12.7.4. Strategic initiatives
- 12.8. MCR Safety
- 12.8.1. Company overview
- 12.8.2. Financial performance
- 12.8.3. Product benchmarking
- 12.8.4. Strategic initiatives
- 12.9. Atlantic Safety Products, Inc.
- 12.9.1. Company overview
- 12.9.2. Financial performance
- 12.9.3. Product benchmarking
- 12.9.4. Strategic initiatives
- 12.10. Globus (Shetland) Ltd
- 12.10.1. Company overview
- 12.10.2. Financial performance
- 12.10.3. Product benchmarking
- 12.10.4. Strategic initiatives
- 12.11. Supermax Corporation Berhad
- 12.11.1. Company overview
- 12.11.2. Financial performance
- 12.11.3. Product benchmarking
- 12.11.4. Strategic initiatives
- 12.12. Kossan Rubber Industries Bhd
- 12.12.1. Company overview
- 12.12.2. Financial performance
- 12.12.3. Product benchmarking
- 12.12.4. Strategic initiatives
- 12.13. Ammex Corporation
- 12.13.1. Company overview
- 12.13.2. Financial performance
- 12.13.3. Product benchmarking
- 12.13.4. Strategic initiatives
- 12.14. Kimberly-Clark Corporation
- 12.14.1. Company overview
- 12.14.2. Financial performance
- 12.14.3. Product benchmarking
- 12.14.4. Strategic initiatives
- 12.15. Sempermed USA, Inc.
- 12.15.1. Company overview
- 12.15.2. Financial performance
- 12.15.3. Product benchmarking
- 12.15.4. Strategic initiatives