|
|
市場調査レポート
商品コード
1097036
水産飼料市場の規模、シェア、動向分析レポート:形態別(ドライ、ウェット)、添加物別(アミノ酸、抗生物質)、飼料別(フィニッシャー、グロワー)、用途別、地域別、セグメント別予測、2022年~2030年Aquafeed Market Size, Share & Trends Analysis Report By Form (Dry, Wet), By Additive (Amino Acid, Antibiotic), By Feed (Finisher, Grower), By Application, By Region, And Segment Forecasts, 2022 - 2030 |
||||||
|
|
|||||||
|
● お客様のご希望に応じて、既存データの加工や未掲載情報(例:国別セグメント)の追加などの対応が可能です。 詳細はお問い合わせください。 |
|||||||


| 水産飼料市場の規模、シェア、動向分析レポート:形態別(ドライ、ウェット)、添加物別(アミノ酸、抗生物質)、飼料別(フィニッシャー、グロワー)、用途別、地域別、セグメント別予測、2022年~2030年 |
|
出版日: 2022年06月07日
発行: Grand View Research
ページ情報: 英文 107 Pages
納期: 2~10営業日
|
- 全表示
- 概要
- 図表
- 目次
水産飼料市場の成長と動向
グランドビューリサーチ社の新しいレポートによると、世界の水産飼料市場は、2022年から2030年まで4.4%のCAGRを記録し、2030年までに1億220万米ドルに達すると予想されています。
この成長は、その豊富なタンパク質含有量により、特にコイ、ナマズ、サケ、エビなどの種による水産飼料の消費が増加していることが主な原因です。
世界市場の将来は、開発の各段階にわたってその全体的な成長で養殖種にとって重要であるエッセンシャルオイル、飼料酸性化剤、天然抽出物、口蓋垂を含む養殖飼料の受け入れの増加に依存しています。寄生虫によって引き起こされる様々な感染症に起因する広範な魚の死亡率は、抗寄生虫の消費のための需要を推進しています。
これらの飼料製品は、ナマズ、サケ、マス、ティラピア、エビ、オオクチバス、ウナギなど、様々な温水および冷水魚種によって消費されます。これらの水生生物用の飼料は、オメガ3脂肪酸とタンパク質の供給源となります。飼料の栄養価を高め、成長率の向上、様々な水生生物の死亡率の低下、タンパク質の消化率、免疫力の向上など、様々な効果をもたらします。
COVID-19の大流行は、世界の経済を麻痺させ、主要産業のサプライチェーンに深刻な影響を及ぼしました。水産飼料の原材料の流通がパンデミックの影響を受け、生産に支障をきたしました。また、ウイルスの蔓延を抑えるために厳重な封鎖が行われ、多くの製造・生産拠点が閉鎖されました。さらに、鶏肉を介したウイルス感染の噂もあり、市場に悪影響を及ぼしました。
水産飼料市場のレポートハイライト。
- 乾燥水産飼料は、生産が容易で、輸送が速く、保存期間が長く、養殖環境に素早く投入できるなどの特性から、CAGR 4.7%と最速の成長率を記録しました。
- 飼料用酸味料は、大腸菌やサルモネラ菌別引き起こされる病気から魚種を保護する能力があるため、6.7%の最速成長率となりました。これらの添加物は、その塩と一緒に有機酸から調製され、これらの水生種の胃酸レベルを維持するのに役立ちます。
- それは余分なビタミンやミネラルの摂取でそれらを負担することなく、動物の継続的な成長をサポートするように、その需要の増加のために、育成飼料タイプは、4.7%の高い成長率となりました。
- シーバスは、低カロリー・高タンパクであることから、食品分野での消費量が増加しており、高い成長率を示しています。肉食の魚で、オメガ3脂肪酸、タンパク質、セレンが豊富に含まれています。また、カリウム、水銀、マグネシウム、ビタミンB12、ビタミンB6も含まれています。
- アジア太平洋地域は、全体的な養殖産業の生産を強化し、最終的に市場を開発するのに役立ち、中国、インドのような国で、その良好な気候条件のために、CAGR 4.9%の最高の成長率となりました。
目次
第1章 調査手法と範囲
- 市場セグメンテーションと範囲
- 市場の定義
- 情報調達
- 購入したデータベース
- GVRの内部データベース
- 情報分析
- 市場の定式化とデータの視覚化
- データの検証と公開
- 調査範囲と前提条件
- データソースへのリスト
第2章 エグゼクティブサマリー
- 市場スナップショット
- セグメントの見通し
- 競合考察
第3章 水産飼料:市場の変数、動向、範囲
- 市場系統の見通し
- 世界の動物飼料市場の見通し
- 浸透と成長の見通しのマッピング、2018年から2030年
- 業界のバリューチェーン分析
- 原材料の動向
- 製造動向
- 販売チャネル分析
- ベンダー選択基準/消費者購入分析
- 規制と政策の情勢
- 価格動向分析、2018-2030
- 価格に影響を与える要因
- COVID-19パンデミックの影響
- 市場力学
- 市場促進要因分析
- 高タンパク含有食品に対する需要の増加
- 魚および魚製品の直接人間消費(DHC)の増加
- 市場制約分析
- 原材料価格の変動
- 市場機会分析
- 市場の課題分析
- 市場促進要因分析
- ビジネス環境分析
- ポーターの分析
- マクロ経済分析
第4章 水産飼料市場:フォームの推定・動向分析
- フォームの変動分析と市場シェア、2021年と2030年(千米ドル)
- 水産飼料の市場規模と予測、およびフォーム別の傾向分析、2018年から2030年(トン)(千米ドル)
- ドライ
- 乾燥飼料市場推計・予測、2018年から2030年(トン)(千米ドル)
- モイスト
- 湿った飼料市場推計・予測、2018年から2030年(トン)(千米ドル)
- ウェット
- ウェットフィード市場推計・予測、2018年から2030年(トン)(千米ドル)
- ドライ
第5章 水産飼料市場:添加剤の推定・動向分析
- 添加剤の変動分析と市場シェア、2021年と2030年(千米ドル)
- アミノ酸
- 水産飼料市場推計・予測、by Amino Acids、2018-2030(Tons)(USD Thousand)
- 抗生物質
- 水産飼料市場推計・予測、by Antibiotics、2018-2030(Tons)(USD Thousand)
- ビタミンとミネラル
- 水産飼料市場推計・予測、by Vitamins&Minerals、2018-2030(Tons)(USD Thousand)
- 飼料酸性化剤
- 水産飼料市場推計・予測、by Feed Acidifiers、2018-2030(Tons)(USD Thousand)
- 酸化防止剤
- 水産飼料市場推計・予測、by Antioxidants、2018-2030(Tons)(USD Thousand)
- 酵素
- 水産飼料市場推計・予測、by Enzymes、2018-2030(Tons)(USD Thousand)
- 抗寄生虫添加剤
- 水産飼料市場推計・予測、by Antiparasitic Additives、2018-2030(Tons)(USD Thousand)
- プロバイオティクスとプレバイオティクス
- 水産飼料市場推計・予測、by Probiotics&Prebiotics、2018-2030(Tons)(USD Thousand)
- その他
- 水産飼料市場推計・予測、by Others、2018-2030(Tons)(USD Thousand)
- アミノ酸
第6章 水産飼料フィード市場:フィードの推定・動向分析
- 飼料の変動分析と市場シェア、2021年と2030年(千米ドル)
- 水産飼料の市場規模と予測、およびフィード別の傾向分析、2018年から2030年(トン)(千米ドル)
- スターターフィード
- 水産飼料市場推計・予測、by Starter feed、2018-2030(Tons)(USD Thousand)
- 栽培飼料
- 水産飼料市場推計・予測、by Grower Feed、2018-2030(Tons)(USD Thousand)
- フィニッシャーフィード
- 水産飼料市場推計・予測、by finisher feed、2018-2030(Tons)(USD Thousand)
- ブローダーフィード
- 水産飼料市場推計・予測、by brooder feed、2018-2030(Tons)(USD Thousand)
- スターターフィード
第7章 水産飼料市場:アプリケーションの推定・動向分析
- アプリケーションの変動分析と市場シェア、2021年と2030年(千米ドル)
- 鯉
- 水産飼料市場推計・予測、in carp、2018-2030(Tons)(USD Thousand)
- ニジマス
- 水産飼料市場推計・予測、in rainbow trout、2018-2030(Tons)(USD Thousand)
- 鮭
- 水産飼料市場推計・予測、in salmon、2018-2030(Tons)(USD Thousand)
- 甲殻類
- 水産飼料市場推計・予測、in crustaceans、2018-2030(Tons)(USD Thousand)
- ティラピア
- 水産飼料市場推計・予測、in tilapia、2018-2030(Tons)(USD Thousand)
- ナマズ
- 水産飼料市場推計・予測、in catfish、2018-2030(Tons)(USD Thousand)
- シーバス
- 水産飼料市場推計・予測、in sea bass、2018-2030(Tons)(USD Thousand)
- ハタ
- 水産飼料市場推計・予測、in grouper、2018-2030(Tons)(USD Thousand)
- その他
- 水産飼料市場推計・予測、その他、2018-2030(Tons)(USD Thousand)
- 鯉
第8章 水産飼料市場:地域の推定・動向分析
- 世界の水産飼料の変動分析と市場シェア、2021年と2030年(千米ドル)
- 世界の水産飼料市場推計・予測、フォーム別、2018年から2030年(トン)(千米ドル)
- 世界の水産飼料市場推計・予測、添加剤別、2018年-2030年(トン)(千米ドル)
- 世界の水産飼料市場推計・予測、フィード別、2018年-2030年(トン)(千米ドル)
- 世界の水産飼料市場推計・予測、アプリケーション別、2018年から2030年(トン)(千米ドル)
- 北米
- 北米水産飼料市場推計・予測、フォーム別、2018年-2030年(トン)(千米ドル)
- 北米水産飼料市場推計・予測、添加剤別、2018年-2030年(トン)(千米ドル)
- 北米水産飼料市場推計・予測、フィード別、2018年-2030年(トン)(千米ドル)
- 北米水産飼料市場推計・予測、アプリケーション別、2018年-2030年(トン)(千米ドル)
- 米国
- 米国の水産飼料市場推計・予測、フォーム別、2018年から2030年(トン)(千米ドル)
- 米国の水産飼料市場推計・予測、添加剤別、2018年から2030年(トン)(千米ドル)
- 米国の水産飼料市場推計・予測、フィード別、2018年から2030年(トン)(千米ドル)
- 米国の水産飼料市場推計・予測、アプリケーション別、2018年から2030年(トン)(千米ドル)
- カナダ
- カナダ水産飼料市場推計・予測、フォーム別、2018年-2030年(トン)(千米ドル)
- カナダ水産飼料市場推計・予測、添加剤別、2018年-2030年(トン)(千米ドル)
- カナダ水産飼料市場推計・予測、フィード別、2018年-2030年(トン)(千米ドル)
- カナダ水産飼料市場推計・予測、アプリケーション別、2018年-2030年(トン)(千米ドル)
- メキシコ
- メキシコ水産飼料市場推計・予測、フォーム別、2018年-2030年(トン)(千米ドル)
- メキシコ水産飼料市場推計・予測、添加剤別、2018年-2030年(トン)(千米ドル)
- メキシコ水産飼料市場推計・予測、フィード別、2018年-2030年(トン)(千米ドル)
- メキシコ水産飼料市場推計・予測、アプリケーション別、2018年-2030年(トン)(千米ドル)
- 欧州
- 欧州水産飼料市場推計・予測、フォーム別、2018年-2030年(トン)(千米ドル)
- 欧州水産飼料市場推計・予測、添加剤別、2018年-2030年(トン)(千米ドル)
- 欧州水産飼料市場推計・予測、フィード別、2018年-2030年(トン)(千米ドル)
- 欧州水産飼料市場推計・予測、アプリケーション別、2018年-2030年(トン)(千米ドル)
- ドイツ
- ドイツ水産飼料市場推計・予測、フォーム別、2018年-2030年(トン)(千米ドル)
- ドイツ水産飼料市場推計・予測、添加剤別、2018年-2030年(トン)(千米ドル)
- ドイツ水産飼料市場推計・予測、フィード別、2018年-2030年(トン)(千米ドル)
- ドイツ水産飼料市場推計・予測、アプリケーション別、2018年-2030年(トン)(千米ドル)
- 英国
- 英国水産飼料市場推計・予測、フォーム別、2018年-2030年(トン)(千米ドル)
- UK水産飼料市場推計・予測、by Additives、2018-2030(Tons)(USD Thousand)
- UK水産飼料市場推計・予測、by Feed、2018-2030(Tons)(USD Thousand)
- 英国水産飼料市場推計・予測、アプリケーション別、2018年-2030年(トン)(千米ドル)
- フランス
- フランス水産飼料市場推計・予測、フォーム別、2018年-2030年(トン)(千米ドル)
- フランス水産飼料市場推計・予測、添加剤別、2018年-2030年(トン)(千米ドル)
- フランス水産飼料市場推計・予測、フィード別、2018年-2030年(トン)(千米ドル)
- フランス水産飼料市場推計・予測、アプリケーション別、2018年-2030年(トン)(千米ドル)
- イタリア
- イタリア水産飼料市場推計・予測、フォーム別、2018年-2030年(トン)(千米ドル)
- イタリア水産飼料and市場推計・予測、by Additives、2018-2030(Tons)(USD Thousand)
- イタリア水産飼料市場推計・予測、フィード別、2018年-2030年(トン)(千米ドル)
- イタリア水産飼料市場推計・予測、アプリケーション別、2018年-2030年(トン)(千米ドル)
- スペイン
- スペイン水産飼料市場推計・予測、フォーム別、2018年-2030年(トン)(千米ドル)
- スペイン水産飼料and市場推計・予測、by Additives、2018-2030(Tons)(USD Thousand)
- スペイン水産飼料市場推計・予測、フィード別、2018年-2030年(トン)(千米ドル)
- スペイン水産飼料市場推計・予測、アプリケーション別、2018年-2030年(トン)(千米ドル)
- デンマーク
- デンマーク水産飼料市場推計・予測、フォーム別、2018年-2030年(トン)(千米ドル)
- デンマーク水産飼料市場推計・予測、添加剤別、2018年-2030年(トン)(千米ドル)
- デンマーク水産飼料市場推計・予測、フィード別、2018年-2030年(トン)(千米ドル)
- デンマーク水産飼料市場推計・予測、アプリケーション別、2018年-2030年(トン)(千米ドル)
- アジア太平洋地域
- アジア太平洋水産飼料市場推計・予測、フォーム別、2018年-2030年(トン)(千米ドル)
- アジア太平洋水産飼料市場推計・予測、添加剤別、2018年-2030年(トン)(千米ドル)
- アジア太平洋水産飼料市場推計・予測、フィード別、2018年-2030年(トン)(千米ドル)
- アジア太平洋地域の水産飼料市場推計・予測、アプリケーション別、2018年から2030年(トン)(千米ドル)
- 中国
- 中国太平洋水産飼料市場推計・予測、フォーム別、2018年-2030年(トン)(千米ドル)
- 中国水産飼料市場推計・予測、添加剤別、2018年-2030年(トン)(千米ドル)
- 中国水産飼料市場推計・予測、フィード別、2018年-2030年(トン)(千米ドル)
- 中国水産飼料市場推計・予測、アプリケーション別、2018年-2030年(トン)(千米ドル)
- インド
- インド水産飼料市場推計・予測、フォーム別、2018年-2030年(トン)(千米ドル)
- インド水産飼料市場推計・予測、添加剤別、2018年-2030年(トン)(千米ドル)
- インド水産飼料市場推計・予測、フィード別、2018年-2030年(トン)(千米ドル)
- インド水産飼料市場推計・予測、アプリケーション別、2018年-2030年(トン)(千米ドル)
- 日本
- 日本水産飼料市場推計・予測、フォーム別、2018年-2030年(トン)(千米ドル)
- 日本水産飼料市場推計・予測、添加剤別、2018年-2030年(トン)(千米ドル)
- 日本水産飼料市場推計・予測、フィード別、2018年-2030年(トン)(千米ドル)
- 日本水産飼料市場推計・予測、アプリケーション別、2018年-2030年(トン)(千米ドル)
- ベトナム
- ベトナム水産飼料市場推計・予測、フォーム別、2018年-2030年(トン)(千米ドル)
- ベトナム水産飼料市場推計・予測、添加剤別、2018年-2030年(トン)(千米ドル)
- ベトナム水産飼料市場推計・予測、フィード別、2018年-2030年(トン)(千米ドル)
- ベトナム水産飼料市場推計・予測、アプリケーション別、2018年-2030年(トン)(千米ドル)
- タイ
- タイ水産飼料市場推計・予測、フォーム別、2018年-2030年(トン)(千米ドル)
- タイ水産飼料市場推計・予測、添加剤別、2018年-2030年(トン)(千米ドル)
- タイ水産飼料市場推計・予測、フィード別、2018年-2030年(トン)(千米ドル)
- タイ水産飼料市場推計・予測、アプリケーション別、2018年-2030年(トン)(千米ドル)
- インドネシア
- インドネシア水産飼料市場推計・予測、フォーム別、2018年-2030年(トン)(千米ドル)
- インドネシア水産飼料市場推計・予測、添加剤別、2018年-2030年(トン)(千米ドル)
- インドネシア水産飼料市場推計・予測、フィード別、2018年-2030年(トン)(千米ドル)
- インドネシア水産飼料市場推計・予測、アプリケーション別、2018年-2030年(トン)(千米ドル)
- オーストラリア
- オーストラリア水産飼料市場推計・予測、フォーム別、2018年-2030年(トン)(千米ドル)
- オーストラリア水産飼料市場推計・予測、添加剤別、2018年-2030年(トン)(千米ドル)
- オーストラリア水産飼料市場推計・予測、フィード別、2018年-2030年(トン)(千米ドル)
- オーストラリア水産飼料市場推計・予測、アプリケーション別、2018年-2030年(トン)(千米ドル)
- 中南米
- 中南米の水産飼料市場推計・予測、フォーム別、2018年-2030年(トン)(千米ドル)
- 中南米の水産飼料市場推計・予測、添加剤別、2018年から2030年(トン)(千米ドル)
- 中南米の水産飼料市場推計・予測、フィード別、2018年-2030年(トン)(千米ドル)
- 中南米の水産飼料市場推計・予測、アプリケーション別、2018年から2030年(トン)(千米ドル)
- ブラジル
- ブラジル水産飼料市場推計・予測、フォーム別、2018年-2030年(トン)(千米ドル)
- ブラジル水産飼料市場推計・予測、添加剤別、2018年-2030年(トン)(千米ドル)
- ブラジル水産飼料市場推計・予測、フィード別、2018年-2030年(トン)(千米ドル)
- ブラジルアメリカアクア水産飼料市場推計・予測、アプリケーション別、2018年-2030年(トン)(千米ドル)
- アルゼンチン
- アルゼンチン水産飼料市場推計・予測、フォーム別、2018年-2030年(トン)(千米ドル)
- アルゼンチン水産飼料市場推計・予測、添加剤別、2018年-2030年(トン)(千米ドル)
- アルゼンチン水産飼料市場推計・予測、フィード別、2018年-2030年(トン)(千米ドル)
- アルゼンチンアメリカアクア水産飼料市場推計・予測、アプリケーション別、2018年-2030年(トン)(千米ドル)
- チリ
- チリ水産飼料市場推計・予測、フォーム別、2018年-2030年(トン)(千米ドル)
- チリ水産飼料市場推計・予測、添加剤別、2018年-2030年(トン)(千米ドル)
- チリ水産飼料市場推計・予測、フィード別、2018年-2030年(トン)(千米ドル)
- チリアメリカアクア水産飼料市場推計・予測、アプリケーション別、2018年-2030年(トン)(千米ドル)
- エクアドル
- エクアドル水産飼料市場推計・予測、フォーム別、2018年-2030年(トン)(千米ドル)
- エクアドル水産飼料市場推計・予測、添加剤別、2018年-2030年(トン)(千米ドル)
- エクアドル水産飼料市場推計・予測、フィード別、2018年-2030年(トン)(千米ドル)
- エクアドルアメリカアクア水産飼料市場推計・予測、アプリケーション別、2018年-2030年(トン)(千米ドル)
- 中東とアフリカ
- 中東およびアフリカの水産飼料市場推計・予測、フォーム別、2018年から2030年(トン)(千米ドル)
- 中東およびアフリカの水産飼料市場推計・予測、添加剤別、2018年から2030年(トン)(千米ドル)
- 中東およびアフリカの水産飼料市場推計・予測、フィード別、2018年-2030年(トン)(千米ドル)
- 中東およびアフリカの水産飼料市場推計・予測、アプリケーション別、2018年-2030年(トン)(千米ドル)
- 南アフリカ
- 南アフリカ水産飼料市場推計・予測、フォーム別、2018年-2030年(トン)(千米ドル)
- 南アフリカの水産飼料市場推計・予測、添加剤別、2018年から2030年(トン)(千米ドル)
- 南アフリカ水産飼料市場推計・予測、フィード別、2018年-2030年(トン)(千米ドル)
- 南アフリカ水産飼料市場推計・予測、アプリケーション別、2018年-2030年(トン)(千米ドル)
- エジプト
- エジプト水産飼料市場推計・予測、フォーム別、2018年-2030年(トン)(千米ドル)
- エジプト水産飼料市場推計・予測、添加剤別、2018年-2030年(トン)(千米ドル)
- エジプト水産飼料市場推計・予測、フィード別、2018年-2030年(トン)(千米ドル)
- エジプト水産飼料市場推計・予測、アプリケーション別、2018年-2030年(トン)(千米ドル)
第9章 水産飼料市場:競合情勢
- 主要な市場参加者別最近の動向と影響分析
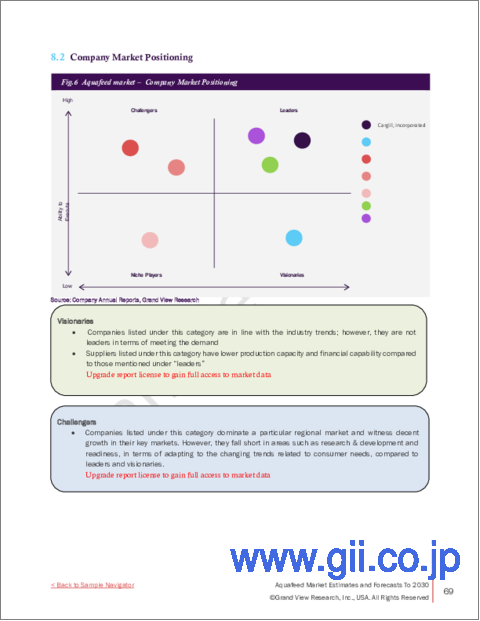
- 会社の市場ポジショニング
- ベンダー情勢
- 原材料サプライヤーのリスト
- 主要メーカーのリスト
- 主要サプライヤー/ディストリビューターのリスト
- 主要なエンドユーザーのリスト
- 競合環境
- 戦略的枠組み
第10章 水産飼料市場:企業プロファイル
- カーギル、組み込まれています
- 会社概要
- 財務実績
- 製品ポートフォリオ
- 戦略的イニシアチブ
- BioMarグループ
- 会社概要
- 財務実績
- 製品ポートフォリオ
- 戦略的イニシアチブ
- リドリーコーポレーションリミテッド
- 会社概要
- 財務実績
- 製品ポートフォリオ
- 戦略的イニシアチブ
- アラーアクア
- 会社概要
- 財務実績
- 製品ポートフォリオ
- 戦略的イニシアチブ
- ベネオ
- 会社概要
- 財務実績
- 製品のベンチマーク
- Alltech
- 会社概要
- 財務実績
- 製品ポートフォリオ
- StratEgicイニシアチブ
- AKER BIOMARINE
- 会社概要
- 財務実績
- 製品ポートフォリオ
- 戦略的イニシアチブ
- チャルーンポーカンドフーズPCL
- 会社概要
- 財務実績
- 製品ポートフォリオ
- 戦略的イニシアチブ
- スクレッティング
- 会社概要
- 財務実績
- 製品ポートフォリオ
- 戦略的イニシアチブ
- Purina Animal Nutrition LLC
- 会社概要
- 財務実績
- 製品ポートフォリオ
- StratEgicイニシアチブ
- ディバク養殖
- 会社概要
- 財務実績
- 製品ポートフォリオ
- INVEアクアカルチャー
- 会社概要
- 財務実績
- 製品ポートフォリオ
- StratEgicイニシアチブ
- アバンティフィードリミテッド
- 会社概要
- 財務実績
- 製品ポートフォリオ
- バイオシュタットインディアリミテッド
- 会社概要
- 財務実績
- 製品ポートフォリオ
- ウォーターベースリミテッド
- 会社概要
- 財務実績
- 製品ポートフォリオ
List of Tables
- Table 1 Dry Aquafeed Market Estimates and Forecasts, 2018 - 2030 (Tons) (USD Thousand)
- Table 2 Moist Aquafeed Market Estimates and Forecasts, 2018 - 2030 (Tons) (USD Thousand)
- Table 3 Wet Aquafeed Market Estimates and Forecasts, 2018 - 2030 (Tons) (USD Thousand)
- Table 4 Aquafeed Market Estimates and Forecasts, by Amino Acids, 2018 - 2030 (Tons) (USD Thousand)
- Table 5 Aquafeed Market Estimates and Forecasts, by Antibiotics, 2018 - 2030 (Tons) (USD Thousand)
- Table 6 Aquafeed Market Estimates and Forecasts, by Vitamins & Minerals, 2018 - 2030 (Tons) (USD Thousand)
- Table 7 Aquafeed Market Estimates and Forecasts, by Feed Acidifiers, 2018 - 2030 (Tons) (USD Thousand)
- Table 8 Aquafeed Market Estimates and Forecasts, by Antioxidants, 2018 - 2030 (Tons) (USD Thousand)
- Table 9 Aquafeed Market Estimates and Forecasts, by Enzymes, 2018 - 2030 (Tons) (USD Thousand)
- Table 10 Aquafeed Market Estimates and Forecasts, by Anti-Parasitic Additives, 2018 - 2030 (Tons) (USD Thousand)
- Table 11 Aquafeed Market Estimates and Forecasts, by Probiotics & Prebiotics, 2018 - 2030 (Tons) (USD Thousand)
- Table 12 Aquafeed Market Estimates and Forecasts, by Others, 2018 - 2030 (Tons) (USD Thousand)
- Table 13 Aquafeed Market Estimates and Forecasts, by Starter Feed, 2018 - 2030 (Tons) (USD Thousand)
- Table 14 Aquafeed Market Estimates and Forecasts, by Grower Feed, 2018 - 2030 (Tons) (USD Thousand)
- Table 15 Aquafeed Market Estimates and Forecasts, by Finisher Feed, 2018 - 2030 (Tons) (USD Thousand)
- Table 16 Aquafeed Market Estimates and Forecasts, by Brooder Feed, 2018 - 2030 (Tons) (USD Thousand)
- Table 17 Aquafeed Market Estimates and Forecasts, in Carp, 2018 - 2030 (Tons) (USD Thousand)
- Table 18 Aquafeed Market Estimates and Forecasts, in Rainbow Trout, 2018 - 2030 (Tons) (USD Thousand)
- Table 19 Aquafeed Market Estimates and Forecasts, in Salmon, 2018 - 2030 (Tons) (USD Thousand)
- Table 20 Aquafeed Market Estimates and Forecasts, in Crustaceans, 2018 - 2030 (Tons) (USD Thousand)
- Table 21 Aquafeed Market Estimates and Forecasts, in Tilapia, 2018 - 2030 (Tons) (USD Thousand)
- Table 22 Aquafeed Market Estimates and Forecasts, in Catfish, 2018 - 2030 (Tons) (USD Thousand)
- Table 23 Aquafeed Market Estimates and Forecasts, in Sea Bass, 2018 - 2030 (Tons) (USD Thousand)
- Table 24 Aquafeed Market Estimates and Forecasts, in Grouper, 2018 - 2030 (Tons) (USD Thousand)
- Table 25 Aquafeed Market Estimates and Forecasts, in Others, 2018 - 2030 (Tons) (USD Thousand)
- Table 26 Global Aquafeed Market Estimates and Forecasts, by Form, 2018 - 2030 (Tons)
- Table 27 Global Aquafeed Market Estimates and Forecasts, by Form, 2018 - 2030 (USD Thousand)
- Table 28 Global Aquafeed Market Estimates and Forecasts, by Additives, 2018 - 2030 (Tons)
- Table 29 Global Aquafeed Market Estimates and Forecasts, by Additives, 2018 - 2030 (USD Thousand)
- Table 30 Global Aquafeed Market Estimates and Forecasts, by Feed, 2018 - 2030 (Tons)
- Table 31 Global Aquafeed Market Estimates and Forecasts, by Feed, 2018 - 2030 (USD Thousand)
- Table 32 Global Aquafeed Market Estimates and Forecasts, by Application, 2018 - 2030 (Tons)
- Table 33 Global Aquafeed Market Estimates and Forecasts, by Application, 2018 - 2030 (USD Thousand)
- Table 34 North America Aquafeed Market Estimates and Forecasts, by Form, 2018 - 2030 (Tons)
- Table 35 North America Aquafeed Market Estimates and Forecasts, by Form, 2018 - 2030 (USD Thousand)
- Table 36 North America Aquafeed Market Estimates and Forecasts, by Additives, 2018 - 2030 (Tons)
- Table 37 North America Aquafeed Market Estimates and Forecasts, by Additives, 2018 - 2030 (USD Thousand)
- Table 38 North America Aquafeed Market Estimates and Forecasts, by Feed, 2018 - 2030 (Tons)
- Table 39 North America Aquafeed Market Estimates and Forecasts, by Feed, 2018 - 2030 (USD Thousand)
- Table 40 North America Aquafeed Market Estimates and Forecasts, by Application, 2018 - 2030 (Tons)
- Table 41 North America Aquafeed Market Estimates and Forecasts, by Application, 2018 - 2030 (USD Thousand)
- Table 42 U.S. Aquafeed Market Estimates and Forecasts, by Form, 2018 - 2030 (Tons)
- Table 43 U.S. Aquafeed Market Estimates and Forecasts, by Form, 2018 - 2030 (USD Thousand)
- Table 44 U.S. Aquafeed Market Estimates and Forecasts, by Additives, 2018 - 2030 (Tons)
- Table 45 U.S. Aquafeed Market Estimates and Forecasts, by Additives, 2018 - 2030 (USD Thousand)
- Table 46 U.S. Aquafeed Market Estimates and Forecasts, by Feed, 2018 - 2030 (Tons)
- Table 47 U.S. Aquafeed Market Estimates and Forecasts, by Feed, 2018 - 2030 (USD Thousand)
- Table 48 U.S. Aquafeed Market Estimates and Forecasts, by Application, 2018 - 2030 (Tons)
- Table 49 U.S. Aquafeed Market Estimates and Forecasts, by Application, 2018 - 2030 (USD Thousand)
- Table 50 Canada Aquafeed Market Estimates and Forecasts, by Form, 2018 - 2030 (Tons)
- Table 51 Canada Aquafeed Market Estimates and Forecasts, by Form, 2018 - 2030 (USD Thousand)
- Table 52 Canada Aquafeed Market Estimates and Forecasts, by Additives, 2018 - 2030 (Tons)
- Table 53 Canada Aquafeed Market Estimates and Forecasts, by Additives, 2018 - 2030 (USD Thousand)
- Table 54 Canada Aquafeed Market Estimates and Forecasts, by Feed, 2018 - 2030 (Tons)
- Table 55 Canada Aquafeed Market Estimates and Forecasts, by Feed, 2018 - 2030 (USD Thousand)
- Table 56 Canada Aquafeed Market Estimates and Forecasts, by Application, 2018 - 2030 (Tons)
- Table 57 Canada Aquafeed Market Estimates and Forecasts, by Application, 2018 - 2030 (USD Thousand)
- Table 58 Mexico Aquafeed Market Estimates and Forecasts, by Form, 2018 - 2030 (Tons)
- Table 59 Mexico Aquafeed Market Estimates and Forecasts, by Form, 2018 - 2030 (USD Thousand)
- Table 60 Mexico Aquafeed Market Estimates and Forecasts, by Additives, 2018 - 2030 (Tons)
- Table 61 Mexico Aquafeed Market Estimates and Forecasts, by Additives, 2018 - 2030 (USD Thousand)
- Table 62 Mexico Aquafeed Market Estimates and Forecasts, by Feed, 2018 - 2030 (Tons)
- Table 63 Mexico Aquafeed Market Estimates and Forecasts, by Feed, 2018 - 2030 (USD Thousand)
- Table 64 Mexico Aquafeed Market Estimates and Forecasts, by Application, 2018 - 2030 (Tons)
- Table 65 Mexico Aquafeed Market Estimates and Forecasts, by Application, 2018 - 2030 (USD Thousand)
- Table 66 Europe Aquafeed Market Estimates and Forecasts, by Form, 2018 - 2030 (Tons)
- Table 67 Europe Aquafeed Market Estimates and Forecasts, by Form, 2018 - 2030 (USD Thousand)
- Table 68 Europe Aquafeed Market Estimates and Forecasts, by Additives, 2018 - 2030 (Tons)
- Table 69 Europe Aquafeed Market Estimates and Forecasts, by Additives, 2018 - 2030 (USD Thousand)
- Table 70 Europe Aquafeed Market Estimates and Forecasts, by Feed, 2018 - 2030 (Tons)
- Table 71 Europe Aquafeed Market Estimates and Forecasts, by Feed, 2018 - 2030 (USD Thousand)
- Table 72 Europe Aquafeed Market Estimates and Forecasts, by Application, 2018 - 2030 (Tons)
- Table 73 Europe Aquafeed Market Estimates and Forecasts, by Application, 2018 - 2030 (USD Thousand)
- Table 74 Germany Aquafeed Market Estimates and Forecasts, by Form, 2018 - 2030 (Tons)
- Table 75 Germany Aquafeed Market Estimates and Forecasts, by Form, 2018 - 2030 (USD Thousand)
- Table 76 Germany Aquafeed Market Estimates and Forecasts, by Additives, 2018 - 2030 (Tons)
- Table 77 Germany Aquafeed Market Estimates and Forecasts, by Additives, 2018 - 2030 (USD Thousand)
- Table 78 Germany Aquafeed Market Estimates and Forecasts, by Feed, 2018 - 2030 (Tons)
- Table 79 Germany Aquafeed Market Estimates and Forecasts, by Feed, 2018 - 2030 (USD Thousand)
- Table 80 Germany Aquafeed Market Estimates and Forecasts, by Application, 2018 - 2030 (Tons)
- Table 81 Germany Aquafeed Market Estimates and Forecasts, by Application, 2018 - 2030 (USD Thousand)
- Table 82 UK Aquafeed Market Estimates and Forecasts, by Form, 2018 - 2030 (Tons)
- Table 83 UK Aquafeed Market Estimates and Forecasts, by Form, 2018 - 2030 (USD Thousand)
- Table 84 UK Aquafeed Market Estimates and Forecasts, by Additives, 2018 - 2030 (Tons)
- Table 85 UK Aquafeed Market Estimates and Forecasts, by Additives, 2018 - 2030 (USD Thousand)
- Table 86 UK Aquafeed Market Estimates and Forecasts, by Feed, 2018 - 2030 (Tons)
- Table 87 UK Aquafeed Market Estimates and Forecasts, by Feed, 2018 - 2030 (USD Thousand)
- Table 88 UK Aquafeed Market Estimates and Forecasts, by Application, 2018 - 2030 (Tons)
- Table 89 UK Aquafeed Market Estimates and Forecasts, by Application, 2018 - 2030 (USD Thousand)
- Table 90 France Aquafeed Market Estimates and Forecasts, by Form, 2018 - 2030 (Tons)
- Table 91 France Aquafeed Market Estimates and Forecasts, by Form, 2018 - 2030 (USD Thousand)
- Table 92 France Aquafeed Market Estimates and Forecasts, by Additives, 2018 - 2030 (Tons)
- Table 93 France Aquafeed Market Estimates and Forecasts, by Additives, 2018 - 2030 (USD Thousand)
- Table 94 France Aquafeed Market Estimates and Forecasts, by Feed, 2018 - 2030 (Tons)
- Table 95 France Aquafeed Market Estimates and Forecasts, by Feed, 2018 - 2030 (USD Thousand)
- Table 96 France Aquafeed Market Estimates and Forecasts, by Application, 2018 - 2030 (Tons)
- Table 97 France Aquafeed Market Estimates and Forecasts, by Application, 2018 - 2030 (USD Thousand)
- Table 98 Italy Aquafeed Market Estimates and Forecasts, by Form, 2018 - 2030 (Tons)
- Table 99 Italy Aquafeed Market Estimates and Forecasts, by Form, 2018 - 2030 (USD Thousand)
- Table 100 Italy Aquafeed Market Estimates and Forecasts, by Additives, 2018 - 2030 (Tons)
- Table 101 Italy Aquafeed Market Estimates and Forecasts, by Additives, 2018 - 2030 (USD Thousand)
- Table 102 Italy Aquafeed Market Estimates and Forecasts, by Feed, 2018 - 2030 (Tons)
- Table 103 Italy Aquafeed Market Estimates and Forecasts, by Feed, 2018 - 2030 (USD Thousand)
- Table 104 Italy Aquafeed Market Estimates and Forecasts, by Application, 2018 - 2030 (Tons)
- Table 105 Italy Aquafeed Market Estimates and Forecasts, by Application, 2018 - 2030 (USD Thousand)
- Table 106 Spain Aquafeed Market Estimates and Forecasts, by Form, 2018 - 2030 (Tons)
- Table 107 Spain Aquafeed Market Estimates and Forecasts, by Form, 2018 - 2030 (USD Thousand)
- Table 108 Spain Aquafeed Market Estimates and Forecasts, by Additives, 2018 - 2030 (Tons)
- Table 109 Spain Aquafeed Market Estimates and Forecasts, by Additives, 2018 - 2030 (USD Thousand)
- Table 110 Spain Aquafeed Market Estimates and Forecasts, by Feed, 2018 - 2030 (Tons)
- Table 111 Spain Aquafeed Market Estimates and Forecasts, by Feed, 2018 - 2030 (USD Thousand)
- Table 112 Spain Aquafeed Market Estimates and Forecasts, by Application, 2018 - 2030 (Tons)
- Table 113 Spain Aquafeed Market Estimates and Forecasts, by Application, 2018 - 2030 (USD Thousand)
- Table 114 Denmark Aquafeed Market Estimates and Forecasts, by Form, 2018 - 2030 (Tons)
- Table 115 Denmark Aquafeed Market Estimates and Forecasts, by Form, 2018 - 2030 (USD Thousand)
- Table 116 Denmark Aquafeed Market Estimates and Forecasts, by Additives, 2018 - 2030 (Tons)
- Table 117 Denmark Aquafeed Market Estimates and Forecasts, by Additives, 2018 - 2030 (USD Thousand)
- Table 118 Global Aquafeed Market Estimates and Forecasts, by Feed, 2018 - 2030 (Tons)
- Table 119 Denmark Aquafeed Market Estimates and Forecasts, by Feed, 2018 - 2030 (USD Thousand)
- Table 120 Denmark Aquafeed Market Estimates and Forecasts, by Application, 2018 - 2030 (Tons)
- Table 121 Denmark Aquafeed Market Estimates and Forecasts, by Application, 2018 - 2030 (USD Thousand)
- Table 122 Asia Pacific Aquafeed Market Estimates and Forecasts, by Form, 2018 - 2030 (Tons)
- Table 123 Asia Pacific Aquafeed Market Estimates and Forecasts, by Form, 2018 - 2030 (USD Thousand)
- Table 124 Asia Pacific Aquafeed Market Estimates and Forecasts, by Additives, 2018 - 2030 (Tons)
- Table 125 Asia Pacific Aquafeed Market Estimates and Forecasts, by Additives, 2018 - 2030 (USD Thousand)
- Table 126 Asia Pacific Aquafeed Market Estimates and Forecasts, by Feed, 2018 - 2030 (Tons)
- Table 127 Asia Pacific Aquafeed Market Estimates and Forecasts, by Feed, 2018 - 2030 (USD Thousand)
- Table 128 Asia Pacific Aquafeed Market Estimates and Forecasts, by Application, 2018 - 2030 (Tons)
- Table 129 Asia Pacific Aquafeed Market Estimates and Forecasts, by Application, 2018 - 2030 (USD Thousand)
- Table 130 China Aquafeed Market Estimates and Forecasts, by Form, 2018 - 2030 (Tons)
- Table 131 China Aquafeed Market Estimates and Forecasts, by Form, 2018 - 2030 (USD Thousand)
- Table 132 China Aquafeed Market Estimates and Forecasts, by Additives, 2018 - 2030 (Tons)
- Table 133 China Aquafeed Market Estimates and Forecasts, by Additives, 2018 - 2030 (USD Thousand)
- Table 134 China Aquafeed Market Estimates and Forecasts, by Feed, 2018 - 2030 (Tons)
- Table 135 China Aquafeed Market Estimates and Forecasts, by Feed, 2018 - 2030 (USD Thousand)
- Table 136 China Aquafeed Market Estimates and Forecasts, by Application, 2018 - 2030 (Tons)
- Table 137 China Aquafeed Market Estimates and Forecasts, by Application, 2018 - 2030 (USD Thousand)
- Table 138 India Aquafeed Market Estimates and Forecasts, by Form, 2018 - 2030 (Tons)
- Table 139 India Aquafeed Market Estimates and Forecasts, by Form, 2018 - 2030 (USD Thousand)
- Table 140 India Aquafeed Market Estimates and Forecasts, by Additives, 2018 - 2030 (Tons)
- Table 141 India Aquafeed Market Estimates and Forecasts, by Additives, 2018 - 2030 (USD Thousand)
- Table 142 India Aquafeed Market Estimates and Forecasts, by Feed, 2018 - 2030 (Tons)
- Table 143 India Aquafeed Market Estimates and Forecasts, by Feed, 2018 - 2030 (USD Thousand)
- Table 144 India Aquafeed Market Estimates and Forecasts, by Application, 2018 - 2030 (Tons)
- Table 145 India Aquafeed Market Estimates and Forecasts, by Application, 2018 - 2030 (USD Thousand)
- Table 146 Japan Aquafeed Market Estimates and Forecasts, by Form, 2018 - 2030 (Tons)
- Table 147 Japan Aquafeed Market Estimates and Forecasts, by Form, 2018 - 2030 (USD Thousand)
- Table 148 Japan Aquafeed Market Estimates and Forecasts, by Additives, 2018 - 2030 (Tons)
- Table 149 Japan Aquafeed Market Estimates and Forecasts, by Additives, 2018 - 2030 (USD Thousand)
- Table 150 Japan Aquafeed Market Estimates and Forecasts, by Feed, 2018 - 2030 (Tons)
- Table 151 Japan Aquafeed Market Estimates and Forecasts, by Feed, 2018 - 2030 (USD Thousand)
- Table 152 Japan Aquafeed Market Estimates and Forecasts, by Application, 2018 - 2030 (Tons)
- Table 153 Japan Aquafeed Market Estimates and Forecasts, by Application, 2018 - 2030 (USD Thousand)
- Table 154 Vietnam Aquafeed Market Estimates and Forecasts, by Form, 2018 - 2030 (Tons)
- Table 155 Vietnam Aquafeed Market Estimates and Forecasts, by Form, 2018 - 2030 (USD Thousand)
- Table 156 Vietnam Aquafeed Market Estimates and Forecasts, by Additives, 2018 - 2030 (Tons)
- Table 157 Vietnam Aquafeed Market Estimates and Forecasts, by Additives, 2018 - 2030 (USD Thousand)
- Table 158 Vietnam Aquafeed Market Estimates and Forecasts, by Feed, 2018 - 2030 (Tons)
- Table 159 Vietnam Aquafeed Market Estimates and Forecasts, by Feed, 2018 - 2030 (USD Thousand)
- Table 160 Vietnam Aquafeed Market Estimates and Forecasts, by Application, 2018 - 2030 (Tons)
- Table 161 Vietnam Aquafeed Market Estimates and Forecasts, by Application, 2018 - 2030 (USD Thousand)
- Table 162 Thailand Aquafeed Market Estimates and Forecasts, by Form, 2018 - 2030 (Tons)
- Table 163 Thailand Aquafeed Market Estimates and Forecasts, by Form, 2018 - 2030 (USD Thousand)
- Table 164 Thailand Aquafeed Market Estimates and Forecasts, by Additives, 2018 - 2030 (Tons)
- Table 165 Thailand Aquafeed Market Estimates and Forecasts, by Additives, 2018 - 2030 (USD Thousand)
- Table 166 Thailand Aquafeed Market Estimates and Forecasts, by Feed, 2018 - 2030 (Tons)
- Table 167 Thailand Aquafeed Market Estimates and Forecasts, by Feed, 2018 - 2030 (USD Thousand)
- Table 168 Thailand Aquafeed Market Estimates and Forecasts, by Application, 2018 - 2030 (Tons)
- Table 169 Thailand Aquafeed Market Estimates and Forecasts, by Application, 2018 - 2030 (USD Thousand)
- Table 170 Indonesia Aquafeed Market Estimates and Forecasts, by Form, 2018 - 2030 (Tons)
- Table 171 Indonesia Aquafeed Market Estimates and Forecasts, by Form, 2018 - 2030 (USD Thousand)
- Table 172 Indonesia Aquafeed Market Estimates and Forecasts, by Additives, 2018 - 2030 (Tons)
- Table 173 Indonesia Aquafeed Market Estimates and Forecasts, by Additives, 2018 - 2030 (USD Thousand)
- Table 174 Indonesia Aquafeed Market Estimates and Forecasts, by Feed, 2018 - 2030 (Tons)
- Table 175 Indonesia Aquafeed Market Estimates and Forecasts, by Feed, 2018 - 2030 (USD Thousand)
- Table 176 Indonesia Aquafeed Market Estimates and Forecasts, by Application, 2018 - 2030 (Tons)
- Table 177 Indonesia Aquafeed Market Estimates and Forecasts, by Application, 2018 - 2030 (USD Thousand)
- Table 178 Australia Aquafeed Market Estimates and Forecasts, by Form, 2018 - 2030 (Tons)
- Table 179 Australia Aquafeed Market Estimates and Forecasts, by Form, 2018 - 2030 (USD Thousand)
- Table 180 Australia Aquafeed Market Estimates and Forecasts, by Additives, 2018 - 2030 (Tons)
- Table 181 Australia Aquafeed Market Estimates and Forecasts, by Additives, 2018 - 2030 (USD Thousand)
- Table 182 Australia Aquafeed Market Estimates and Forecasts, by Feed, 2018 - 2030 (Tons)
- Table 183 Australia Aquafeed Market Estimates and Forecasts, by Feed, 2018 - 2030 (USD Thousand)
- Table 184 Australia Aquafeed Market Estimates and Forecasts, by Application, 2018 - 2030 (Tons)
- Table 185 Australia Aquafeed Market Estimates and Forecasts, by Application, 2018 - 2030 (USD Thousand)
- Table 186 Central & South America Aquafeed Market Estimates and Forecasts, by Form, 2018 - 2030 (Tons)
- Table 187 Central & South America Aquafeed Market Estimates and Forecasts, by Form, 2018 - 2030 (USD Thousand)
- Table 188 Central & South America Aquafeed Market Estimates and Forecasts, by Additives, 2018 - 2030 (Tons)
- Table 189 Central & South America Aquafeed Market Estimates and Forecasts, by Additives, 2018 - 2030 (USD Thousand)
- Table 190 Central & South America Aquafeed Market Estimates and Forecasts, by Feed, 2018 - 2030 (Tons)
- Table 191 Central & South America Aquafeed Market Estimates and Forecasts, by Feed, 2018 - 2030 (USD Thousand)
- Table 192 Central & South America Aquafeed Market Estimates and Forecasts, by Application, 2018 - 2030 (Tons)
- Table 193 Central & South America Aquafeed Market Estimates and Forecasts, by Application, 2018 - 2030 (USD Thousand)
- Table 194 Brazil Aquafeed Market Estimates and Forecasts, by Form, 2018 - 2030 (Tons)
- Table 195 Brazil Aquafeed Market Estimates and Forecasts, by Form, 2018 - 2030 (USD Thousand)
- Table 196 Brazil Aquafeed Market Estimates and Forecasts, by Additives, 2018 - 2030 (Tons)
- Table 197 Brazil Aquafeed Market Estimates and Forecasts, by Additives, 2018 - 2030 (USD Thousand)
- Table 198 Brazil Aquafeed Market Estimates and Forecasts, by Feed, 2018 - 2030 (Tons)
- Table 199 Brazil Aquafeed Market Estimates and Forecasts, by Feed, 2018 - 2030 (USD Thousand)
- Table 200 Brazil Aquafeed Market Estimates and Forecasts, by Application, 2018 - 2030 (Tons)
- Table 201 Brazil Aquafeed Market Estimates and Forecasts, by Application, 2018 - 2030 (USD Thousand)
- Table 202 Argentina Aquafeed Market Estimates and Forecasts, by Form, 2018 - 2030 (Tons)
- Table 203 Argentina Aquafeed Market Estimates and Forecasts, by Form, 2018 - 2030 (USD Thousand)
- Table 204 Argentina Aquafeed Market Estimates and Forecasts, by Additives, 2018 - 2030 (Tons)
- Table 205 Argentina Aquafeed Market Estimates and Forecasts, by Additives, 2018 - 2030 (USD Thousand)
- Table 206 Argentina Aquafeed Market Estimates and Forecasts, by Feed, 2018 - 2030 (Tons)
- Table 207 Argentina Aquafeed Market Estimates and Forecasts, by Feed, 2018 - 2030 (USD Thousand)
- Table 208 Argentina Aquafeed Market Estimates and Forecasts, by Application, 2018 - 2030 (Tons)
- Table 209 Argentina Aquafeed Market Estimates and Forecasts, by Application, 2018 - 2030 (USD Thousand)
- Table 210 Chile Aquafeed Market Estimates and Forecasts, by Form, 2018 - 2030 (Tons)
- Table 211 Chile Aquafeed Market Estimates and Forecasts, by Form, 2018 - 2030 (USD Thousand)
- Table 212 Chile Aquafeed Market Estimates and Forecasts, by Additives, 2018 - 2030 (Tons)
- Table 213 Chile Aquafeed Market Estimates and Forecasts, by Additives, 2018 - 2030 (USD Thousand)
- Table 214 Chile Aquafeed Market Estimates and Forecasts, by Feed, 2018 - 2030 (Tons)
- Table 215 Chile Aquafeed Market Estimates and Forecasts, by Feed, 2018 - 2030 (USD Thousand)
- Table 216 Chile Aquafeed Market Estimates and Forecasts, by Application, 2018 - 2030 (Tons)
- Table 217 Chile Aquafeed Market Estimates and Forecasts, by Application, 2018 - 2030 (USD Thousand)
- Table 218 Ecuador Aquafeed Market Estimates and Forecasts, by Form, 2018 - 2030 (Tons)
- Table 219 Ecuador Aquafeed Market Estimates and Forecasts, by Form, 2018 - 2030 (USD Thousand)
- Table 220 Ecuador Aquafeed Market Estimates and Forecasts, by Additives, 2018 - 2030 (Tons)
- Table 221 Ecuador Aquafeed Market Estimates and Forecasts, by Additives, 2018 - 2030 (USD Thousand)
- Table 222 Ecuador Aquafeed Market Estimates and Forecasts, by Feed, 2018 - 2030 (Tons)
- Table 223 Ecuador Aquafeed Market Estimates and Forecasts, by Feed, 2018 - 2030 (USD Thousand)
- Table 224 Ecuador Aquafeed Market Estimates and Forecasts, by Application, 2018 - 2030 (Tons)
- Table 225 Ecuador Aquafeed Market Estimates and Forecasts, by Application, 2018 - 2030 (USD Thousand)
- Table 226 Middle East & Africa Aquafeed Market Estimates and Forecasts, by Form, 2018 - 2030 (Tons)
- Table 227 Middle East & Africa Aquafeed Market Estimates and Forecasts, by Form, 2018 - 2030 (USD Thousand)
- Table 228 Middle East & Africa Aquafeed Market Estimates and Forecasts, by Additives, 2018 - 2030 (Tons)
- Table 229 Middle East & Africa Aquafeed Market Estimates and Forecasts, by Additives, 2018 - 2030 (USD Thousand)
- Table 230 Middle East & Africa Aquafeed Market Estimates and Forecasts, by Feed, 2018 - 2030 (Tons)
- Table 231 Middle East & Africa Aquafeed Market Estimates and Forecasts, by Feed, 2018 - 2030 (USD Thousand)
- Table 232 Middle East & Africa Aquafeed Market Estimates and Forecasts, by Application, 2018 - 2030 (Tons)
- Table 233 Middle East & Africa Aquafeed Market Estimates and Forecasts, by Application, 2018 - 2030 (USD Thousand)
- Table 234 South Africa Aquafeed Market Estimates and Forecasts, by Form, 2018 - 2030 (Tons)
- Table 235 South Africa Aquafeed Market Estimates and Forecasts, by Form, 2018 - 2030 (USD Thousand)
- Table 236 South Africa Aquafeed Market Estimates and Forecasts, by Additives, 2018 - 2030 (Tons)
- Table 237 South Africa Aquafeed Market Estimates and Forecasts, by Additives, 2018 - 2030 (USD Thousand)
- Table 238 South Africa Aquafeed Market Estimates and Forecasts, by Feed, 2018 - 2030 (Tons)
- Table 239 South Africa Aquafeed Market Estimates and Forecasts, by Feed, 2018 - 2030 (USD Thousand)
- Table 240 South Africa Aquafeed Market Estimates and Forecasts, by Application, 2018 - 2030 (Tons)
- Table 241 South Africa Aquafeed Market Estimates and Forecasts, by Application, 2018 - 2030 (USD Thousand)
- Table 242 Egypt Aquafeed Market Estimates and Forecasts, by Form, 2018 - 2030 (Tons)
- Table 243 Egypt Aquafeed Market Estimates and Forecasts, by Form, 2018 - 2030 (USD Thousand)
- Table 244 Egypt Aquafeed Market Estimates and Forecasts, by Additives, 2018 - 2030 (Tons)
- Table 245 Egypt Aquafeed Market Estimates and Forecasts, by Additives, 2018 - 2030 (USD Thousand)
- Table 246 Egypt Aquafeed Market Estimates and Forecasts, by Feed, 2018 - 2030 (Tons)
- Table 247 Egypt Aquafeed Market Estimates and Forecasts, by Feed, 2018 - 2030 (USD Thousand)
- Table 248 Egypt Aquafeed Market Estimates and Forecasts, by Application, 2018 - 2030 (Tons)
- Table 249 Egypt Aquafeed Market Estimates and Forecasts, by Application, 2018 - 2030 (USD Thousand)
- Table 250 Key global players recent developments & their impact
- Table 251 List of Key Manufacturers
- Table 252 List of Key Suppliers/Distributors
- Table 253 List of Key End-users
List of Figures
- Fig. 1 Aquafeed market segmentation
- Fig. 2 Information procurement
- Fig. 3 Data analysis models
- Fig. 4 Market formulation and validation
- Fig. 5 Data validating & publishing
- Fig. 6 Aquafeed Market Snapshot
- Fig. 7 Aquafeed Market Segmental Outlook, 2021 (Tons)
- Fig. 8 Aquafeed Market Segmental Outlook, 2021 (Tons)
- Fig. 9 Aquafeed market, 2018-2030, (Tons) (USD Thousand)
- Fig. 10 Global Aquafeed Market Value Chain Analysis
- Fig. 11 Price Trend Analysis, 2018-2030 (USD/KG)
- Fig. 12 Aquafeed market dynamics
- Fig. 13 Global protein consumption, 2011 - 2020 (Billion tons)
- Fig. 14 Global fishmeal average price (USD per metric ton), (2017-2020)
- Fig. 15 Aquafeed market: Porter's analysis
- Fig. 16 Aquafeed market: PESTEL Analysis
- Fig. 17 Aquafeed market revenue share, by form, 2021 & 2030 (USD Thousand)
- Fig. 18 Aquafeed market revenue share, by additives, 2021 & 2030 (USD Thousand)
- Fig. 19 Aquafeed market revenue share, by feed, 2021 & 2030 (USD Thousand)
- Fig. 20 Aquafeed market revenue share, by application, 2021 & 2030 (USD Thousand)
- Fig. 21 Aquafeed revenue market, by region, 2021 & 2030, (USD Thousand)
- Fig. 22 Company Market Positioning
- Fig. 23 Aquafeed Market: Strategy Framework
Aquafeed Market Growth & Trends:
The global aquafeed market is expected to reach USD 102.2 million by 2030, registering a CAGR of 4.4% from 2022 to 2030, as per the new report by Grand View Research, Inc. The growth is majorly driven by the rising consumption of aquafeed by species like carp, catfish, salmon, and shrimps among others due to its rich protein content.
The future of the global market is dependent on the increasing acceptance of aquafeed which contains essential oils, feed acidifiers, natural extracts, and palatants which are important for aquaculture species in their overall growth across each stage of development. The widespread fish mortality due to various infections which are caused by parasites is driving the demand for the consumption of anti-parasites.
These feed products are consumed by various warm-water and cold-water fish species such as catfish, salmon, trout, tilapia, shrimps, largemouth bass, and eel among others. These feeds for aquatic species are a source of omega-3 fatty acids and proteins. It improves the nutritional value of feed and offers several other benefits like improved growth rate, reduced mortality of various aquatic species, digestibility of proteins, and enhanced immune system.
The COVID-19 pandemic had crippled the economies of the world and severely impacted the supply chain across key industries. The distribution of raw materials for aquafeed was affected by the pandemic due to which its production was hampered. In addition, strict lockdowns were imposed to curb the virus from spreading, and due to this many manufacturing and production units were closed. Furthermore, there were rumors of transmission of the virus through poultry, which ill-affected the market.
Aquafeed Market Report Highlights:
- Dry aquafeed form witnessed the fastest growth rate of CAGR 4.7%, owing to its properties such as easy production, quick transport, long storage life, and quick dispense into the fish culture environment
- The feed acidifiers witnessed the fastest growth rate of 6.7% because of their ability to prevent the species from diseases which are caused by E. coli and Salmonella. These additives are prepared from organic acids along with their salts and help in maintaining gastric acid levels in these aquatic species
- The grower feed type witnessed a high growth rate of 4.7%, because of its rising demand as it supports the continuous growth of the animals without burdening them with extra vitamins and minerals intake
- Sea Bass application witnessed a high growth rate due to its increasing consumption in the food industry because of its low calorie and high protein content. It is a carnivorous fish and is rich in omega-3 fatty acids, proteins, and selenium. It also contains potassium, mercury, magnesium, vitamin B12, and vitamin B6
- The Asia Pacific region witnessed the highest growth rate of CAGR 4.9%, owing to its favorable climatic conditions in the countries like China, and India which helps to enhance the overall aquaculture industry production and eventually develop the market
Table of Contents
Chapter 1 Methodology and Scope
- 1.1 Market Segmentation & Scope
- 1.2 Market Definition
- 1.3 Information Procurement
- 1.3.1 Purchased Database
- 1.3.2 GVR's Internal Database
- 1.4 Information analysis
- 1.5 Market formulation & data visualization
- 1.6 Data validation & publishing
- 1.6.1 Research scope and assumptions
- 1.6.2 List to Data Sources
Chapter 2 Executive Summary
- 2.1 Market Snapshot
- 2.2 Segmental Outlook
- 2.3 Competitive Insights
Chapter 3 Aquafeed: Market Variables, Trends & Scope
- 3.1 Market Lineage Outlook
- 3.1.1 Global Animal Feed market Outlook
- 3.2 Penetration & Growth Prospect Mapping, 2018 - 2030
- 3.3 Industry Value Chain Analysis
- 3.3.1 Raw material Trends
- 3.3.2 Manufacturing Trends
- 3.3.3 Sales Channel Analysis
- 3.3.4 Vendor Selection Criteria/Consumer Buying Analysis
- 3.4 Regulatory & Policy Landscape
- 3.5 Price Trend Analysis, 2018 - 2030
- 3.5.1 Factors Influencing Prices
- 3.6 Impact of COVID-19 Pandemic
- 3.7 Market Dynamics
- 3.7.1 Market Driver Analysis
- 3.7.1.1 Increased demand for high protein content Food
- 3.7.1.2 Increasing direct human consumption (DHC) of fish and fish products
- 3.7.2 Market Restraint Analysis
- 3.7.2.1 Fluctiations in raw material prices
- 3.7.3 Market opportunity Analysis
- 3.7.4 Market Challenge Analysis
- 3.7.1 Market Driver Analysis
- 3.8 Business Environment Analysis
- 3.8.1 Porter's Analysis
- 3.8.2 Macro Economic Analysis
Chapter 4 Aquafeed Market: Form Estimates & Trend Analysis
- 4.1 Form movement analysis & market share, 2021 & 2030 (USD Thousand)
- 4.2 Aquafeed market size & forecasts and trend analysis by form, 2018 - 2030 (Tons) (USD Thousand)
- 4.2.1 Dry
- 4.2.1.1 Dry feed market estimates and Forecast, 2018 - 2030 (Tons) (USD Thousand)
- 4.2.2 Moist
- 4.2.2.1 Moist feed market estimates and Forecast, 2018 - 2030 (Tons) (USD Thousand)
- 4.2.3 Wet
- 4.2.3.1 Wet feed market estimates and forecast, 2018 - 2030 (Tons) (USD Thousand)
- 4.2.1 Dry
Chapter 5 Aquafeed Market: Additives Estimates & Trend Analysis
- 5.1 Additives movement analysis & market share, 2021 & 2030 (USD Thousand)
- 5.1.1 Amino Acids
- 5.1.1.1 Aquafeed Market Estimates and Forecasts, by Amino Acids, 2018 - 2030 (Tons) (USD Thousand)
- 5.1.2 Antibiotics
- 5.1.2.1 Aquafeed Market Estimates and Forecasts, by Antibiotics, 2018 - 2030 (Tons) (USD Thousand)
- 5.1.3 Vitamins & Minerals
- 5.1.3.1 Aquafeed Market Estimates and Forecasts, by Vitamins & Minerals, 2018 - 2030 (Tons) (USD Thousand)
- 5.1.4 Feed Acidifiers
- 5.1.4.1 Aquafeed Market Estimates and Forecasts, by Feed Acidifiers, 2018 - 2030 (Tons) (USD Thousand)
- 5.1.5 Antioxidants
- 5.1.5.1 Aquafeed Market Estimates and Forecasts, by Antioxidants, 2018 - 2030 (Tons) (USD Thousand)
- 5.1.6 Enzymes
- 5.1.6.1 Aquafeed Market Estimates and Forecasts, by Enzymes, 2018 - 2030 (Tons) (USD Thousand)
- 5.1.7 Anti-Parasitic Additives
- 5.1.7.1 Aquafeed Market Estimates and Forecasts, by Antiparasitic additives, 2018 - 2030 (Tons) (USD Thousand)
- 5.1.8 Probiotics & Prebiotics
- 5.1.8.1 Aquafeed Market Estimates and Forecasts, by Probiotics & Prebiotics, 2018 - 2030 (Tons) (USD Thousand)
- 5.1.9 Others
- 5.1.9.1 Aquafeed Market Estimates and Forecasts, by Others, 2018 - 2030 (Tons) (USD Thousand)
- 5.1.1 Amino Acids
Chapter 6 Aquafeed Market: Feed Estimates & Trend Analysis
- 6.1 Feed movement analysis & market share, 2021 & 2030 (USD Thousand)
- 6.2 Aquafeed market size & forecasts and trend analysis by feed, 2018 - 2030 (Tons) (USD Thousand)
- 6.2.1 Starter Feed
- 6.2.1.1 Aquafeed Market Estimates and Forecasts, by Starter feed, 2018 - 2030 (Tons) (USD Thousand)
- 6.2.2 Grower Feed
- 6.2.2.1 Aquafeed Market Estimates and Forecasts, by grower feed, 2018 - 2030 (Tons) (USD Thousand)
- 6.2.3 Finisher feed
- 6.2.3.1 Aquafeed Market Estimates and Forecasts, by finisher feed, 2018 - 2030 (Tons) (USD Thousand)
- 6.2.4 Brooder feed
- 6.2.4.1 Aquafeed Market Estimates and Forecasts, by brooder feed, 2018 - 2030 (Tons) (USD Thousand)
- 6.2.1 Starter Feed
Chapter 7 Aquafeed Market: Application Estimates & Trend Analysis
- 7.1 Application movement analysis & market share, 2021 & 2030 (USD Thousand)
- 7.1.1 Carp
- 7.1.1.1 Aquafeed Market Estimates and Forecasts, in carp, 2018 - 2030 (Tons) (USD Thousand)
- 7.1.2 Rainbow Trout
- 7.1.2.1 Aquafeed Market Estimates and Forecasts, in rainbow trout, 2018 - 2030 (Tons) (USD Thousand)
- 7.1.3 Salmon
- 7.1.3.1 Aquafeed Market Estimates and Forecasts, in salmon, 2018 - 2030 (Tons) (USD Thousand)
- 7.1.4 Crustaceans
- 7.1.4.1 Aquafeed Market Estimates and Forecasts, in crustaceans, 2018 - 2030 (Tons) (USD Thousand)
- 7.1.5 Tilapia
- 7.1.5.1 Aquafeed Market Estimates and Forecasts, in tilapia, 2018 - 2030 (Tons) (USD Thousand)
- 7.1.6 Catfish
- 7.1.6.1 Aquafeed Market Estimates and Forecasts, in catfish, 2018 - 2030 (Tons) (USD Thousand)
- 7.1.7 Sea Bass
- 7.1.7.1 Aquafeed Market Estimates and Forecasts, in sea bass, 2018 - 2030 (Tons) (USD Thousand)
- 7.1.8 Grouper
- 7.1.8.1 Aquafeed Market Estimates and Forecasts, in grouper, 2018 - 2030 (Tons) (USD Thousand)
- 7.1.9 Others
- 7.1.9.1 Aquafeed Market Estimates and Forecasts, in others, 2018 - 2030 (Tons) (USD Thousand)
- 7.1.1 Carp
Chapter 8 Aquafeed Market: Regional Estimates & Trend Analysis
- 8.1 Global Aquafeed movement analysis & market share, 2021 & 2030 (USD Thousand)
- 8.1.1 Global Aquafeed Market Estimates and Forecasts, by Form, 2018 - 2030 (Tons) (USD Thousand)
- 8.1.2 Global Aquafeed Market Estimates and Forecasts, by Additives, 2018 - 2030 (Tons) (USD Thousand)
- 8.1.3 Global Aquafeed Market Estimates and Forecasts, by Feed, 2018 - 2030 (Tons) (USD Thousand)
- 8.1.4 Global Aquafeed Market Estimates and Forecasts, by Application, 2018 - 2030 (Tons) (USD Thousand)
- 8.2 North America
- 8.2.1 North America Aquafeed Market Estimates and Forecasts, by Form, 2018 - 2030 (Tons) (USD Thousand)
- 8.2.2 North America Aquafeed Market Estimates and Forecasts, by Additives, 2018 - 2030 (Tons) (USD Thousand)
- 8.2.3 North America Aquafeed Market Estimates and Forecasts, by Feed, 2018 - 2030 (Tons) (USD Thousand)
- 8.2.4 North America Aquafeed Market Estimates and Forecasts, by Application, 2018 - 2030 (Tons) (USD Thousand)
- 8.2.5 U.S.
- 8.2.5.1 U.S. Aquafeed Market Estimates and Forecasts, by Form, 2018 - 2030 (Tons) (USD Thousand)
- 8.2.5.2 U.S. Aquafeed Market Estimates and Forecasts, by Additives, 2018 - 2030 (Tons) (USD Thousand)
- 8.2.5.3 U.S. Aquafeed Market Estimates and Forecasts, by Feed, 2018 - 2030 (Tons) (USD Thousand)
- 8.2.5.4 U.S. Aquafeed Market Estimates and Forecasts, by Application, 2018 - 2030 (Tons) (USD Thousand)
- 8.2.6 Canada
- 8.2.6.1 Canada Aquafeed Market Estimates and Forecasts, by Form, 2018 - 2030 (Tons) (USD Thousand)
- 8.2.6.2 Canada Aquafeed Market Estimates and Forecasts, by Additives, 2018 - 2030 (Tons) (USD Thousand)
- 8.2.6.3 Canada Aquafeed Market Estimates and Forecasts, by Feed, 2018 - 2030 (Tons) (USD Thousand)
- 8.2.6.4 Canada Aquafeed Market Estimates and Forecasts, by Application, 2018 - 2030 (Tons) (USD Thousand)
- 8.2.7 Mexico
- 8.2.7.1 Mexico Aquafeed Market Estimates and Forecasts, by Form, 2018 - 2030 (Tons) (USD Thousand)
- 8.2.7.2 Mexico Aquafeed Market Estimates and Forecasts, by Additives, 2018 - 2030 (Tons) (USD Thousand)
- 8.2.7.3 Mexico Aquafeed Market Estimates and Forecasts, by Feed, 2018 - 2030 (Tons) (USD Thousand)
- 8.2.7.4 Mexico Aquafeed Market Estimates and Forecasts, by Application, 2018 - 2030 (Tons) (USD Thousand)
- 8.3 Europe
- 8.3.1 Europe Aquafeed Market Estimates and Forecasts, by Form, 2018 - 2030 (Tons) (USD Thousand)
- 8.3.2 Europe Aquafeed Market Estimates and Forecasts, by Additives, 2018 - 2030 (Tons) (USD Thousand)
- 8.3.3 Europe Aquafeed Market Estimates and Forecasts, by Feed, 2018 - 2030 (Tons) (USD Thousand)
- 8.3.4 Europe Aquafeed Market Estimates and Forecasts, by Application, 2018 - 2030 (Tons) (USD Thousand)
- 8.3.5 Germany
- 8.3.5.1 Germany Aquafeed Market Estimates and Forecasts, by Form, 2018 - 2030 (Tons) (USD Thousand)
- 8.3.5.2 Germany Aquafeed Market Estimates and Forecasts, by Additives, 2018 - 2030 (Tons) (USD Thousand)
- 8.3.5.3 Germany Aquafeed Market Estimates and Forecasts, by Feed, 2018 - 2030 (Tons) (USD Thousand)
- 8.3.5.4 Germany Aquafeed Market Estimates and Forecasts, by Application, 2018 - 2030 (Tons) (USD Thousand)
- 8.3.6 UK
- 8.3.6.1 UK Aquafeed Market Estimates and Forecasts, by Form, 2018 - 2030 (Tons) (USD Thousand)
- 8.3.6.2 UK Aquafeed Market Estimates and Forecasts, by Additives, 2018 - 2030 (Tons) (USD Thousand)
- 8.3.6.3 UK Aquafeed Market Estimates and Forecasts, by Feed, 2018 - 2030 (Tons) (USD Thousand)
- 8.3.6.4 UK Aquafeed Market Estimates and Forecasts, by Application, 2018 - 2030 (Tons) (USD Thousand)
- 8.3.7 France
- 8.3.7.1 France Aquafeed Market Estimates and Forecasts, by Form, 2018 - 2030 (Tons) (USD Thousand)
- 8.3.7.2 France Aquafeed Market Estimates and Forecasts, by Additives, 2018 - 2030 (Tons) (USD Thousand)
- 8.3.7.3 France Aquafeed Market Estimates and Forecasts, by Feed, 2018 - 2030 (Tons) (USD Thousand)
- 8.3.7.4 France Aquafeed Market Estimates and Forecasts, by Application, 2018 - 2030 (Tons) (USD Thousand)
- 8.3.8 Italy
- 8.3.8.1 Italy Aquafeed Market Estimates and Forecasts, by Form, 2018 - 2030 (Tons) (USD Thousand)
- 8.3.8.2 Italy Aquafeed Market Estimates and Forecasts, by Additives, 2018 - 2030 (Tons) (USD Thousand)
- 8.3.8.3 Italy Aquafeed Market Estimates and Forecasts, by Feed, 2018 - 2030 (Tons) (USD Thousand)
- 8.3.8.4 Italy Aquafeed Market Estimates and Forecasts, by Application, 2018 - 2030 (Tons) (USD Thousand)
- 8.3.9 Spain
- 8.3.9.1 Spain Aquafeed Market Estimates and Forecasts, by Form, 2018 - 2030 (Tons) (USD Thousand)
- 8.3.9.2 Spain Aquafeed Market Estimates and Forecasts, by Additives, 2018 - 2030 (Tons) (USD Thousand)
- 8.3.9.3 Spain Aquafeed Market Estimates and Forecasts, by Feed, 2018 - 2030 (Tons) (USD Thousand)
- 8.3.9.4 Spain Aquafeed Market Estimates and Forecasts, by Application, 2018 - 2030 (Tons) (USD Thousand)
- 8.3.10 Denmark
- 8.3.10.1 Denmark Aquafeed Market Estimates and Forecasts, by Form, 2018 - 2030 (Tons) (USD Thousand)
- 8.3.10.2 Denmark Aquafeed Market Estimates and Forecasts, by Additives, 2018 - 2030 (Tons) (USD Thousand)
- 8.3.10.3 Denmark Aquafeed Market Estimates and Forecasts, by Feed, 2018 - 2030 (Tons) (USD Thousand)
- 8.3.10.4 Denmark Aquafeed Market Estimates and Forecasts, by Application, 2018 - 2030 (Tons) (USD Thousand)
- 8.4 Asia Pacific
- 8.4.1 Asia Pacific Aquafeed Market Estimates and Forecasts, by Form, 2018 - 2030 (Tons) (USD Thousand)
- 8.4.2 Asia Pacific Aquafeed Market Estimates and Forecasts, by Additives, 2018 - 2030 (Tons) (USD Thousand)
- 8.4.3 Asia Pacific Aquafeed Market Estimates and Forecasts, by Feed, 2018 - 2030 (Tons) (USD Thousand)
- 8.4.4 Asia Pacific Aquafeed Market Estimates and Forecasts, by Application, 2018 - 2030 (Tons) (USD Thousand)
- 8.4.5 China
- 8.4.5.1 China Pacific Aquafeed Market Estimates and Forecasts, by Form, 2018 - 2030 (Tons) (USD Thousand)
- 8.4.5.2 China Aquafeed Market Estimates and Forecasts, by Additives, 2018 - 2030 (Tons) (USD Thousand)
- 8.4.5.3 China Aquafeed Market Estimates and Forecasts, by Feed, 2018 - 2030 (Tons) (USD Thousand)
- 8.4.5.4 China Aquafeed Market Estimates and Forecasts, by Application, 2018 - 2030 (Tons) (USD Thousand)
- 8.4.6 India
- 8.4.6.1 India Aquafeed Market Estimates and Forecasts, by Form, 2018 - 2030 (Tons) (USD Thousand)
- 8.4.6.2 India Aquafeed Market Estimates and Forecasts, by Additives, 2018 - 2030 (Tons) (USD Thousand)
- 8.4.6.3 India Aquafeed Market Estimates and Forecasts, by Feed, 2018 - 2030 (Tons) (USD Thousand)
- 8.4.6.4 India Aquafeed Market Estimates and Forecasts, by Application, 2018 - 2030 (Tons) (USD Thousand)
- 8.4.7 Japan
- 8.4.7.1 Japan Aquafeed Market Estimates and Forecasts, by Form, 2018 - 2030 (Tons) (USD Thousand)
- 8.4.7.2 Japan Aquafeed Market Estimates and Forecasts, by Additives, 2018 - 2030 (Tons) (USD Thousand)
- 8.4.7.3 Japan Aquafeed Market Estimates and Forecasts, by Feed, 2018 - 2030 (Tons) (USD Thousand)
- 8.4.7.4 Japan Aquafeed Market Estimates and Forecasts, by Application, 2018 - 2030 (Tons) (USD Thousand)
- 8.4.8 Vietnam
- 8.4.8.1 Vietnam Aquafeed Market Estimates and Forecasts, by Form, 2018 - 2030 (Tons) (USD Thousand)
- 8.4.8.2 Vietnam Aquafeed Market Estimates and Forecasts, by Additives, 2018 - 2030 (Tons) (USD Thousand)
- 8.4.8.3 Vietnam Aquafeed Market Estimates and Forecasts, by Feed, 2018 - 2030 (Tons) (USD Thousand)
- 8.4.8.4 Vietnam Aquafeed Market Estimates and Forecasts, by Application, 2018 - 2030 (Tons) (USD Thousand)
- 8.4.9 Thailand
- 8.4.9.1 Thailand Aquafeed Market Estimates and Forecasts, by Form, 2018 - 2030 (Tons) (USD Thousand)
- 8.4.9.2 Thailand Aquafeed Market Estimates and Forecasts, by Additives, 2018 - 2030 (Tons) (USD Thousand)
- 8.4.9.3 Thailand Aquafeed Market Estimates and Forecasts, by Feed, 2018 - 2030 (Tons) (USD Thousand)
- 8.4.9.4 Thailand Aquafeed Market Estimates and Forecasts, by Application, 2018 - 2030 (Tons) (USD Thousand)
- 8.4.10 Indonesia
- 8.4.10.1 Indonesia Aquafeed Market Estimates and Forecasts, by Form, 2018 - 2030 (Tons) (USD Thousand)
- 8.4.10.2 Indonesia Aquafeed Market Estimates and Forecasts, by Additives, 2018 - 2030 (Tons) (USD Thousand)
- 8.4.10.3 Indonesia Aquafeed Market Estimates and Forecasts, by Feed, 2018 - 2030 (Tons) (USD Thousand)
- 8.4.10.4 Indonesia Aquafeed Market Estimates and Forecasts, by Application, 2018 - 2030 (Tons) (USD Thousand)
- 8.4.11 Australia
- 8.4.11.1 Australia Aquafeed Market Estimates and Forecasts, by Form, 2018 - 2030 (Tons) (USD Thousand)
- 8.4.11.2 Australia Aquafeed Market Estimates and Forecasts, by Additives, 2018 - 2030 (Tons) (USD Thousand)
- 8.4.11.3 Australia Aquafeed Market Estimates and Forecasts, by Feed, 2018 - 2030 (Tons) (USD Thousand)
- 8.4.11.4 Australia Aquafeed Market Estimates and Forecasts, by Application, 2018 - 2030 (Tons) (USD Thousand)
- 8.5 Central & South America
- 8.5.1 Central & South America Aquafeed Market Estimates and Forecasts, by Form, 2018 - 2030 (Tons) (USD Thousand)
- 8.5.2 Central & South America Aquafeed Market Estimates and Forecasts, by Additives, 2018 - 2030 (Tons) (USD Thousand)
- 8.5.3 Central & South America Aquafeed Market Estimates and Forecasts, by Feed, 2018 - 2030 (Tons) (USD Thousand)
- 8.5.4 Central & South America Aquafeed Market Estimates and Forecasts, by Application, 2018 - 2030 (Tons) (USD Thousand)
- 8.5.5 Brazil
- 8.5.5.1 Brazil Aquafeed Market Estimates and Forecasts, by Form, 2018 - 2030 (Tons) (USD Thousand)
- 8.5.5.2 Brazil Aquafeed Market Estimates and Forecasts, by Additives, 2018 - 2030 (Tons) (USD Thousand)
- 8.5.5.3 Brazil Aquafeed Market Estimates and Forecasts, by Feed, 2018 - 2030 (Tons) (USD Thousand)
- 8.5.5.4 Brazil merica Aquafeed Market Estimates and Forecasts, by Application, 2018 - 2030 (Tons) (USD Thousand)
- 8.5.6 Argentina
- 8.5.6.1 Argentina Aquafeed Market Estimates and Forecasts, by Form, 2018 - 2030 (Tons) (USD Thousand)
- 8.5.6.2 Argentina Aquafeed Market Estimates and Forecasts, by Additives, 2018 - 2030 (Tons) (USD Thousand)
- 8.5.6.3 Argentina Aquafeed Market Estimates and Forecasts, by Feed, 2018 - 2030 (Tons) (USD Thousand)
- 8.5.6.4 Argentina merica Aquafeed Market Estimates and Forecasts, by Application, 2018 - 2030 (Tons) (USD Thousand)
- 8.5.7 Chile
- 8.5.7.1 Chile Aquafeed Market Estimates and Forecasts, by Form, 2018 - 2030 (Tons) (USD Thousand)
- 8.5.7.2 Chile Aquafeed Market Estimates and Forecasts, by Additives, 2018 - 2030 (Tons) (USD Thousand)
- 8.5.7.3 Chile Aquafeed Market Estimates and Forecasts, by Feed, 2018 - 2030 (Tons) (USD Thousand)
- 8.5.7.4 Chile merica Aquafeed Market Estimates and Forecasts, by Application, 2018 - 2030 (Tons) (USD Thousand)
- 8.5.8 Ecuador
- 8.5.8.1 Ecuador Aquafeed Market Estimates and Forecasts, by Form, 2018 - 2030 (Tons) (USD Thousand)
- 8.5.8.2 Ecuador Aquafeed Market Estimates and Forecasts, by Additives, 2018 - 2030 (Tons) (USD Thousand)
- 8.5.8.3 Ecuador Aquafeed Market Estimates and Forecasts, by Feed, 2018 - 2030 (Tons) (USD Thousand)
- 8.5.8.4 Ecuador merica Aquafeed Market Estimates and Forecasts, by Application, 2018 - 2030 (Tons) (USD Thousand)
- 8.6 Middle East & Africa
- 8.6.1 Middle east & africa Aquafeed Market Estimates and Forecasts, by Form, 2018 - 2030 (Tons) (USD Thousand)
- 8.6.2 Middle East & Africa Aquafeed Market Estimates and Forecasts, by Additives, 2018 - 2030 (Tons) (USD Thousand)
- 8.6.3 Middle East & Africa Aquafeed Market Estimates and Forecasts, by Feed, 2018 - 2030 (Tons) (USD Thousand)
- 8.6.4 Middle East & Africa Aquafeed Market Estimates and Forecasts, by Application, 2018 - 2030 (Tons) (USD Thousand)
- 8.6.5 South Africa
- 8.6.5.1 South Africa Aquafeed Market Estimates and Forecasts, by Form, 2018 - 2030 (Tons) (USD Thousand)
- 8.6.5.2 South Africa Aquafeed Market Estimates and Forecasts, by Additives, 2018 - 2030 (Tons) (USD Thousand)
- 8.6.5.3 South Africa Aquafeed Market Estimates and Forecasts, by Feed, 2018 - 2030 (Tons) (USD Thousand)
- 8.6.5.4 South Africa Aquafeed Market Estimates and Forecasts, by Application, 2018 - 2030 (Tons) (USD Thousand)
- 8.6.6 Egypt
- 8.6.6.1 Egypt Aquafeed Market Estimates and Forecasts, by Form, 2018 - 2030 (Tons) (USD Thousand)
- 8.6.6.2 Egypt Aquafeed Market Estimates and Forecasts, by Additives, 2018 - 2030 (Tons) (USD Thousand)
- 8.6.6.3 Egypt Aquafeed Market Estimates and Forecasts, by Feed, 2018 - 2030 (Tons) (USD Thousand)
- 8.6.6.4 Egypt Aquafeed Market Estimates and Forecasts, by Application, 2018 - 2030 (Tons) (USD Thousand)
Chapter 9 Aquafeed Market: Competitive Landscape
- 9.1 Recent Developments & Impact Analysis, By Key Market Participants
- 9.3 Company Market Positioning
- 9.4 Vendor Landscape
- 9.4.1 List of Raw material suppliers
- 9.4.2 List of Key manufacturers
- 9.4.3 List of Key Suppliers/Distributors
- 9.4.4 List of Key End-users
- 9.5 Competitive Environment
- 9.6 Strategy Framework
Chapter 10 Aquafeed Market: Company Profile
- 10.1 Cargill, Incorporated
- 10.1.1 Company Overview
- 10.1.2 Financial Performance
- 10.1.3 Product portfolio
- 10.1.4 Strategic Initiatives
- 10.2 BioMar Group
- 10.2.1 Company Overview
- 10.2.2 Financial Performance
- 10.2.3 Product portfolio
- 10.2.4 Strategic Initiatives
- 10.3 Ridley Corporation Limited
- 10.3.1 Company Overview
- 10.3.2 Financial Performance
- 10.3.3 Product portfolio
- 10.3.4 Strategic Initiatives
- 10.4 Aller Aqua
- 10.4.1 Company Overview
- 10.4.2 Financial Performance
- 10.4.3 Product POrtfolio
- 10.4.4 Strategic Initiatives
- 10.5 BENEO
- 10.5.1 Company Overview
- 10.5.2 Financial Performance
- 10.5.3 Product Benchmarking
- 10.6 Alltech
- 10.6.1 Company Overview
- 10.6.2 Financial Performance
- 10.6.3 Product portfolio
- 10.6.4 StratEgic initiatives
- 10.7 AKER BIOMARINE
- 10.7.1 Company Overview
- 10.7.2 FINANCIAL PERFORMANCE
- 10.7.3 Product portfolio
- 10.7.4 Strategic Initiatives
- 10.8 Charoen Pokphand Foods PCL
- 10.8.1 Company Overview
- 10.8.2 FINANCIAL PERFORMANCE
- 10.8.3 Product portfolio
- 10.8.4 Strategic Initiatives
- 10.9 Skretting
- 10.9.1 Company Overview
- 10.9.2 FINANCIAL PERFORMANCE
- 10.9.3 Product portfolio
- 10.9.4 Strategic Initiatives
- 10.10 Purina Animal Nutrition LLC
- 10.10.1 Company Overview
- 10.10.2 Financial Performance
- 10.10.3 Product portfolio
- 10.10.4 StratEgic initiatives
- 10.11 Dibaq Aquaculture
- 10.11.1 Company Overview
- 10.11.2 Financial Performance
- 10.11.3 Product portfolio
- 10.12 INVE Aquaculture
- 10.12.1 Company Overview
- 10.12.2 Financial Performance
- 10.12.3 Product portfolio
- 10.12.4 StratEgic initiatives
- 10.13 Avanti Feeds Limited
- 10.13.1 Company Overview
- 10.13.2 Financial Performance
- 10.13.3 Product portfolio
- 10.14 Biostadt India Limited
- 10.14.1 Company Overview
- 10.14.2 Financial Performance
- 10.14.3 Product portfolio
- 10.15 The Waterbase Limited
- 10.15.1 Company Overview
- 10.15.2 Financial Performance
- 10.15.3 Product portfolio