|
|
市場調査レポート
商品コード
1097063
スマートヘルスケアの市場規模、シェア、動向分析:製品別(RFIDカンバンシステム、RFIDスマートキャビネット、電子カルテ、遠隔医療、mヘルス、スマートピル、スマートシリンジ)、地域別、セグメント別予測、2022年~2030年Smart Healthcare Market Size, Share & Trends Analysis Report By Product (RFID Kanban Systems, RFID Smart Cabinets, Electronic Health Records, Telemedicine, mHealth, Smart Pills, Smart Syringes), By Region, And Segment Forecasts, 2022 - 2030 |
||||||
|
|
|||||||
|
● お客様のご希望に応じて、既存データの加工や未掲載情報(例:国別セグメント)の追加などの対応が可能です。 詳細はお問い合わせください。 |
|||||||


| スマートヘルスケアの市場規模、シェア、動向分析:製品別(RFIDカンバンシステム、RFIDスマートキャビネット、電子カルテ、遠隔医療、mヘルス、スマートピル、スマートシリンジ)、地域別、セグメント別予測、2022年~2030年 |
|
出版日: 2022年06月09日
発行: Grand View Research
ページ情報: 英文 110 Pages
納期: 2~10営業日
|
- 全表示
- 概要
- 図表
- 目次
スマートヘルスケアの市場成長と動向。
グランドビューリサーチ社の最新レポートによると、世界のスマートヘルスケア市場規模は2030年までに4,834億米ドルに達すると予測されています。
2022年から2030年までのCAGRは13.3%で拡大する見込みです。COVID-19の大流行は、これらのソリューションがヘルスケア専門家が患者と効果的につながり、質の高い治療を提供するのに役立つため、市場の成長を後押しすると思われます。社会的距離の問題から、遠隔患者モニタリングやバーチャル・ヘルスケア・デリバリーの機運が高まっています。例えば、英国では、コロナウイルス危機の際に無料のバーチャルコンサルテーションを導入しました。2020年4月、英国の非営利のオンラインヘルスケアサービスであるdoctorinthehouse.netは、医師、薬剤師、専門看護師のうちボランティアと協力して、200人以上の在宅臨床医に対して25,000件のオンライン予約と10万件のオンライン評価の供給を目指してプラットフォームを立ち上げました。このような取り組みが、今後の市場の牽引役となることが期待されています。
運用コストは、主に製造コスト、在庫保管コスト、製造間接費、賃金、エネルギーコスト、物流コストに支配されます。在庫管理の不備は、企業が直面する大きな問題であり、大幅な営業損失を招くことになります。そのため、在庫コストを管理するためのRFIDカンバンシステムの需要が高まっています。RFIDカンバンシステムは、工数削減、効率化、費用対効果などのメリットがあるため、予測期間中に普及が進むと予想されます。
技術の進歩により、スマートヘルスケアの市場は急速に変化しています。IBM、シスコ、ギブン・イメージング、オリンパス、ロジタグ、ブルックス・オートメーション、スタンレー・インナースペース、GEヘルスケアなどの主要企業が、幅広い製品を提供しており、大きな市場シェアを獲得しています。2020年3月にSiemens HealthineersがTeamplayデジタルヘルスプラットフォームを発売したように、主要企業は現在のポートフォリオの拡大に注力しています。これは、デジタルヘルスケアの変革を可能にすることを目的とし、臨床および運用ソリューションへの迅速なアクセスを容易にするものです。また、2019年6月には、インテルがNetwork And Custom Logic Groupを発表しました。これは、人工知能(AI)と5Gクラウドのための幅広い製品ポートフォリオです。これは、ヘルスケア・アプリケーションの地平を広げることを目的としています。
スマートヘルスケア市場レポートハイライト。
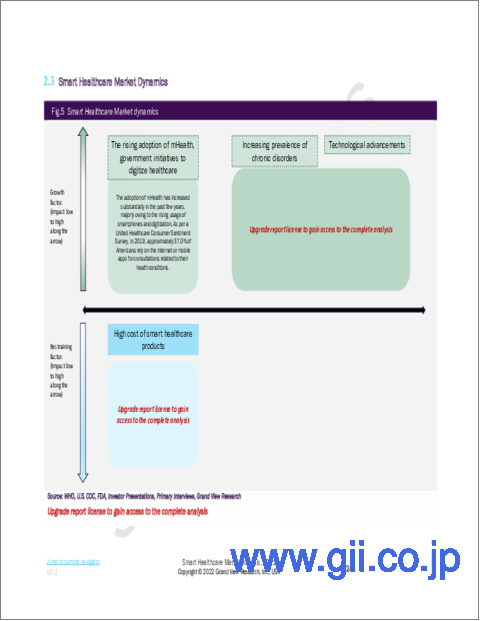
- インターネットの利用拡大、スマートフォンの普及、医療従事者や患者によるmヘルス技術の採用拡大により、2021年にはmヘルス分野が39.0%超の圧倒的シェアを占める。
- 遠隔医療セグメントは、2022年から2030年にかけて2番目に急成長するセグメントと予想されます。慢性疾患の蔓延、自己健康管理に対する需要の高まり、COVID-19パンデミックの発生が成長の主な要因となっている
- スマートピル分野は、集積回路の小型化などの技術開発、患者の利便性重視、低侵襲手術の需要増により、予測期間中に有望な成長を遂げました。
- 企業は競争優位性を獲得するために革新的な戦略を採用しています。製品開発、パートナーシップ、戦略的提携、M&A、地域展開などが挙げられる
- 2020年4月より、IBM研究開発は、様々な科学分野の研究者を支援し、発見プロセスを加速させることができる新しいクラウドおよびAI搭載技術の開発に鋭意取り組んでいます。
目次
第1章 調査手法
- 調査手法
- 情報調達
- 購入したデータベース
- Gvrの内部データベース
- 二次資料
- 1次調査
- 1次調査の詳細
- 情報またはデータ分析
- データ分析モデル
- 市場の定式化と検証
- モデルの詳細
- 商品ワークフロー分析(モデル1)
- 二次資料のリスト
- 一次資料のリスト
- 略語
- レポートの目的
第2章 エグゼクティブサマリー
- 市場スナップショット
第3章 スマートヘルスケア - 業界の見通し
- 市場系列の見通し
- 親市場
- 補助市場
- スマートヘルスケア市場セグメンテーション
- スマートヘルスケアの市場規模と成長見通し
- スマートヘルスケア市場力学
- 市場促進要因分析
- 市場制約分析
- 優先される主要な機会
- 業界分析-ポーターの
- スマートヘルスケア市場のPESTEL分析
第4章 スマートヘルスケア市場:COVID-19の影響
- 現在および将来の影響分析
- 疾患有病率分析
- 市場機会分析
- 市場プレーヤーへの影響
第5章 スマートヘルスケア - 製品の見通し
- 製品別のスマートヘルスケア市場シェア、2021年および2030年
- RFIDカンバンシステム
- RFIDカンバンシステム市場推計・予測、2017年-2030年(百万米ドル)
- RFIDスマートキャビネット
- RFIDスマートキャビネット市場推計・予測、2017年-2030年(百万米ドル)
- 電子カルテ(EHR)
- EHR市場推計・予測、2017年-2030年(百万米ドル)
- クライアントサーバーベースの市場推計・予測、2017年から2030年(百万米ドル)
- Webベースの市場推計・予測、2017年から2030年(百万米ドル)
- 遠隔医療
- 遠隔医療市場推計・予測、2017年-2030年(百万米ドル)
- ハードウェア市場推計・予測、2017年-2030年(百万米ドル)
- 接続性とネットワーク市場推計・予測、2017年から2030年(百万米ドル)
- その他の市場推計・予測、2017年-2030年(百万米ドル)
- mヘルス
- mヘルス市場推計・予測、 mヘルス(USD Million)
- 監視サービス市場推計・予測、2017年-2030年(百万米ドル)
- 診断サービス市場推計・予測、2017年-2030年(百万米ドル)
- ヘルスケアシステム強化サービス市場推計・予測、2017年-2030年(百万米ドル)
- その他の市場推計・予測、2017年-2030年(百万米ドル)
- スマートピル
- スマートピル市場推計・予測、2017年-2030年(百万米ドル)
- スマートシリンジ
- スマートシリンジ市場推計・予測、2017年-2030年(百万米ドル)
第6章 スマートヘルスケア - 地域の見通し
- 地域別のスマートヘルスケア市場シェア、2017年および2030年
- 北米
- 北米市場推計・予測、製品別、2017年-2030年(百万米ドル)
- 米国市場推計・予測
- カナダ市場推計・予測
- 北米市場推計・予測、製品別、2017年-2030年(百万米ドル)
- 欧州
- 欧州市場推計・予測、製品別、2017年-2030年(百万米ドル)
- ドイツ市場推計・予測
- 英国市場推計・予測
- スペイン市場推計・予測
- イタリア市場推計・予測
- フランス市場推計・予測
- 欧州市場推計・予測、製品別、2017年-2030年(百万米ドル)
- アジア太平洋地域
- アジア太平洋市場推計・予測、製品別、2017年-2030年(百万米ドル)
- 中国市場推計・予測
- 日本市場推計・予測
- インド市場推計・予測
- オーストラリア市場推計・予測
- 韓国市場推計・予測
- アジア太平洋市場推計・予測、製品別、2017年-2030年(百万米ドル)
- ラテンアメリカ
- ラテンアメリカ市場推計・予測、製品別、2017年-2030年(百万米ドル)
- メキシコ市場推計・予測
- ブラジル市場推計・予測
- アルゼンチン市場推計・予測
- ラテンアメリカ市場推計・予測、製品別、2017年-2030年(百万米ドル)
- MEA
- MEA市場推計・予測、製品別、2017年-2030年(百万米ドル)
- 南アフリカ市場推計・予測
- サウジアラビア市場推計・予測
- アラブ首長国連邦の市場推計・予測
- MEA市場推計・予測、製品別、2017年-2030年(百万米ドル)
第7章 競合情勢
- 競合ダッシュボード分析
- 公開企業
- 会社の市況分析
- ヒートマップ分析
- 市場企業の詳細リスト
第8章 企業プロファイル
- IBM
- 会社概要
- 財務実績
- 製品のベンチマーク
- 戦略的イニシアチブ
- Cisco
- 会社概要
- 財務実績
- 製品のベンチマーク
- 戦略的イニシアチブ
- Given Imaging, Inc.
- 会社概要
- 財務実績
- 製品のベンチマーク
- 戦略的イニシアチブ
- Olympus Corporation
- 会社概要
- 財務実績
- 製品のベンチマーク
- 戦略的イニシアチブ
- Logi-Tag
- 会社概要
- 財務実績
- 製品のベンチマーク
- 戦略的イニシアチブ
- Brooks Automation
- 会社概要
- 財務実績
- 製品のベンチマーク
- 戦略的イニシアチブ
- Stanley Innerspace
- 会社概要
- 財務実績
- 製品のベンチマーク
- 戦略的イニシアチブ
- Solstice Medical LLC
- 会社概要
- 財務実績
- 製品のベンチマーク
- 戦略的イニシアチブ
- GE Healthcare
- 会社概要
- 財務実績
- 製品のベンチマーク
- 戦略的イニシアチブ
- Siemens Medical Solutions
- 会社概要
- 財務実績
- 製品のベンチマーク
- 戦略的イニシアチブ
- McKesson Corp.
- 会社概要
- 財務実績
- 製品のベンチマーク
- 戦略的イニシアチブ
- Allscripts Healthcare Solutions
- 会社概要
- 財務実績
- 製品のベンチマーク
- 戦略的イニシアチブ
- Samsung Electronics Corporation
- 会社概要
- 財務実績
- 製品のベンチマーク
- 戦略的イニシアチブ
- AirStrip Technologies Inc.
- 会社概要
- 財務実績
- 製品のベンチマーク
- 戦略的イニシアチブ
- Apple Inc.
- 会社概要
- 財務実績
- 製品のベンチマーク
- 戦略的イニシアチブ
- AT&T Inc.
- 会社概要
- 財務実績
- 製品のベンチマーク
- 戦略的イニシアチブ
- Cerner Corporation
- 会社概要
- 財務実績
- 製品のベンチマーク
- 戦略的イニシアチブ
- Pepperl+Fuchs
- 会社概要
- 財務実績
- 製品のベンチマーク
- 戦略的イニシアチブ
- Hurst Green Plastics Ltd.
- 会社概要
- 財務実績
- 製品のベンチマーク
- 戦略的イニシアチブ
- Bollhoff Group
- 会社概要
- 財務実績
- 製品のベンチマーク
- 戦略的イニシアチブ
- Wurth Group
- 会社概要
- 財務実績
- 製品のベンチマーク
- 戦略的イニシアチブ
- Brooks Automation
- 会社概要
- 財務実績
- 製品のベンチマーク
- 戦略的イニシアチブ
- LogTag
- 会社概要
- 財務実績
- 製品のベンチマーク
- 戦略的イニシアチブ
- Stanley Innerspace
- 会社概要
- 財務実績
- 製品のベンチマーク
- 戦略的イニシアチブ
List of Tables
- TABLE 1 Smart healthcare - Market Outlook, 2017 - 2030
- TABLE 2 Global smart healthcare market, by product, 2017 - 2030 (USD Million)
- TABLE 3 Global smart healthcare market, by region, 2017 - 2030 (USD Million)
- TABLE 4 Smart healthcare - Key market driver analysis
- TABLE 5 Smart healthcare - Key market restraint analysis
- TABLE 6 North America Smart Healthcare Market, by Country, 2017 - 2030 (USD Million)
- TABLE 7 North America Smart Healthcare Market, by Product, 2017 - 2030 (USD Million)
- TABLE 8 North America EHR market, by product, 2017 - 2030 (USD Billion)
- TABLE 9 North America mHealth market revenue by services, 2017 - 2030 (USD Million)
- TABLE 10 North America telemedicine market revenue by product, 2017 - 2030 (USD Million)
- TABLE 11 U.S. Smart Healthcare Market, by Product, 2017 - 2030 (USD Million)
- TABLE 12 U.S. EHR market, by product, 2017 - 2030 (USD Billion)
- TABLE 13 U.S. mHealth market revenue by services, 2017 - 2030 (USD Million)
- TABLE 14 U.S. telemedicine market revenue by product, 2017 - 2030 (USD Million)
- TABLE 15 Canada Smart Healthcare Market, by Product, 2017 - 2030 (USD Million)
- TABLE 16 Canada EHR market, by product, 2017 - 2030 (USD Billion)
- TABLE 17 Canada mHealth market revenue by services, 2017 - 2030 (USD Million)
- TABLE 18 Canada telemedicine market revenue by product, 2017 - 2030 (USD Million)
- TABLE 19 Europe Healthcare Market, by Country, 2017 - 2030 (USD Million)
- TABLE 20 Europe Smart Healthcare Market, by Product, 2017 - 2030 (USD Million)
- TABLE 21 Europe EHR market, by product, 2017 - 2030 (USD Billion)
- TABLE 22 Europe mHealth market revenue by services, 2017 - 2030 (USD Million)
- TABLE 23 Europe telemedicine market revenue by product, 2017 - 2030 (USD Million)
- TABLE 24 U.K. Smart Healthcare Market, by Product, 2017 - 2030 (USD Million)
- TABLE 25 U.K. EHR market, by product, 2017 - 2030 (USD Billion)
- TABLE 26 U.K. mHealth market revenue by services, 2017 - 2030 (USD Million)
- TABLE 27 U.K. telemedicine market revenue by product, 2017 - 2030 (USD Million)
- TABLE 28 Germany Smart Healthcare Market, by Product, 2017 - 2030 (USD Million)
- TABLE 29 Germany EHR market, by product, 2017 - 2030 (USD Billion)
- TABLE 30 Germany mHealth market revenue by services, 2017 - 2030 (USD Million)
- TABLE 31 Germany telemedicine market revenue by product, 2017 - 2030 (USD Million)
- TABLE 32 Italy Smart Healthcare Market, by Product, 2017 - 2030 (USD Million)
- TABLE 33 Italy EHR market, by product, 2017 - 2030 (USD Billion)
- TABLE 34 Italy mHealth market revenue by services, 2017 - 2030 (USD Million)
- TABLE 35 Italy telemedicine market revenue by product, 2017 - 2030 (USD Million)
- TABLE 36 France Smart Healthcare Market, by Product, 2017 - 2030 (USD Million)
- TABLE 37 France EHR market, by product, 2017 - 2030 (USD Billion)
- TABLE 38 France mHealth market revenue by services, 2017 - 2030 (USD Million)
- TABLE 39 France telemedicine market revenue by product, 2017 - 2030 (USD Million)
- TABLE 40 Spain Smart Healthcare Market, by Product, 2017 - 2030 (USD Million)
- TABLE 41 Spain EHR market, by product, 2017 - 2030 (USD Billion)
- TABLE 42 Spain mHealth market revenue by services, 2017 - 2030 (USD Million)
- TABLE 43 Spain telemedicine market revenue by product, 2017 - 2030 (USD Million)
- TABLE 44 Asia Pacific Healthcare Market, by Country, 2017 - 2030 (USD Million)
- TABLE 45 Asia Pacific Smart Healthcare Market, by Product, 2017 - 2030 (USD Million)
- TABLE 46 Asia Pacific EHR market, by product, 2017 - 2030 (USD Billion)
- TABLE 47 Asia Pacific mHealth market revenue by services, 2017 - 2030 (USD Million)
- TABLE 48 Asia Pacific telemedicine market revenue by product, 2017 - 2030 (USD Million)
- TABLE 49 India Smart Healthcare Market, by Product, 2017 - 2030 (USD Million)
- TABLE 50 India EHR market, by product, 2017 - 2030 (USD Billion)
- TABLE 51 India mHealth market revenue by services, 2017 - 2030 (USD Million)
- TABLE 52 India telemedicine market revenue by product, 2017 - 2030 (USD Million)
- TABLE 53 China Smart Healthcare Market, by Product, 2017 - 2030 (USD Million)
- TABLE 54 China EHR market, by product, 2017 - 2030 (USD Billion)
- TABLE 55 China mHealth market revenue by services, 2017 - 2030 (USD Million)
- TABLE 56 China telemedicine market revenue by product, 2017 - 2030 (USD Million)
- TABLE 57 Japan Smart Healthcare Market, by Product, 2017 - 2030 (USD Million)
- TABLE 58 Japan EHR market, by product, 2017 - 2030 (USD Billion)
- TABLE 59 Japan mHealth market revenue by services, 2017 - 2030 (USD Million)
- TABLE 60 Japan telemedicine market revenue by product, 2017 - 2030 (USD Million)
- TABLE 61 Australia Smart Healthcare Market, by Product, 2017 - 2030 (USD Million)
- TABLE 62 Australia EHR market, by product, 2017 - 2030 (USD Billion)
- TABLE 63 Australia mHealth market revenue by services, 2017 - 2030 (USD Million)
- TABLE 64 Australia telemedicine market revenue by product, 2017 - 2030 (USD Million)
- TABLE 65 South Korea Smart Healthcare Market, by Product, 2017 - 2030 (USD Million)
- TABLE 66 South Korea EHR market, by product, 2017 - 2030 (USD Billion)
- TABLE 67 South Korea mHealth market revenue by services, 2017 - 2030 (USD Million)
- TABLE 68 South Korea telemedicine market revenue by product, 2017 - 2030 (USD Million)
- TABLE 69 Latin America Healthcare Market, by Country, 2017 - 2030 (USD Million)
- TABLE 70 Latin America Smart Healthcare Market, by Product, 2017 - 2030 (USD Million)
- TABLE 71 Latin America EHR market, by product, 2017 - 2030 (USD Billion)
- TABLE 72 Latin America mHealth market revenue by services, 2017 - 2030 (USD Million)
- TABLE 73 Latin America telemedicine market revenue by product, 2017 - 2030 (USD Million)
- TABLE 74 Brazil Smart Healthcare Market, by Product, 2017 - 2030 (USD Million)
- TABLE 75 Brazil EHR market, by product, 2017 - 2030 (USD Billion)
- TABLE 76 Brazil mHealth market revenue by services, 2017 - 2030 (USD Million)
- TABLE 77 Brazil telemedicine market revenue by product, 2017 - 2030 (USD Million)
- TABLE 78 Mexico Smart Healthcare Market, by Product, 2017 - 2030 (USD Million)
- TABLE 79 Mexico EHR market, by product, 2017 - 2030 (USD Billion)
- TABLE 80 Mexico mHealth market revenue by services, 2017 - 2030 (USD Million)
- TABLE 81 Mexico telemedicine market revenue by product, 2017 - 2030 (USD Million)
- TABLE 82 Argentina Smart Healthcare Market, by Product, 2017 - 2030 (USD Million)
- TABLE 83 Argentina EHR market, by product, 2017 - 2030 (USD Billion)
- TABLE 84 Argentina mHealth market revenue by services, 2017 - 2030 (USD Million)
- TABLE 85 Argentina telemedicine market revenue by product, 2017 - 2030 (USD Million)
- TABLE 86 MEA Healthcare Market, by Country, 2017 - 2030 (USD Million)
- TABLE 87 MEA Smart Healthcare Market, by Product, 2017 - 2030 (USD Million)
- TABLE 88 MEA EHR market, by product, 2017 - 2030 (USD Billion)
- TABLE 89 MEA mHealth market revenue by services, 2017 - 2030 (USD Million)
- TABLE 90 MEA telemedicine market revenue by product, 2017 - 2030 (USD Million)
- TABLE 91 South Africa Smart Healthcare Market, by Product, 2017 - 2030 (USD Million)
- TABLE 92 South Africa EHR market, by product, 2017 - 2030 (USD Billion)
- TABLE 93 South Africa mHealth market revenue by services, 2017 - 2030 (USD Million)
- TABLE 94 South Africa telemedicine market revenue by product, 2017 - 2030 (USD Million)
- TABLE 95 Saudi Arabia Smart Healthcare Market, by Product, 2017 - 2030 (USD Million)
- TABLE 96 Saudi Arabia EHR market, by product, 2017 - 2030 (USD Billion)
- TABLE 97 Saudi Arabia mHealth market revenue by services, 2017 - 2030 (USD Million)
- TABLE 98 Saudi Arabia telemedicine market revenue by product, 2017 - 2030 (USD Million)
- TABLE 99 UAE Smart Healthcare Market, by Product, 2017 - 2030 (USD Million)
- TABLE 100 UAE EHR market, by product, 2017 - 2030 (USD Billion)
- TABLE 101 UAE mHealth market revenue by services, 2017 - 2030 (USD Million)
- TABLE 102 UAE telemedicine market revenue by product, 2017 - 2030 (USD Million)
List of Figures
- FIG. 1 Smart healthcare: Market Segmentation
- FIG. 2 Global smart healthcare Market Revenue, 2017 - 2030 (USD Million)
- FIG. 3 Smart healthcare: Market Dynamics
- FIG. 4 Key Opportunities Prioritized
- FIG. 5 Smart healthcare - Porter's Analysis
- FIG. 6 Smart healthcare - PESTEL Analysis
- FIG. 7 Smart healthcare market share, by product, 2021 & 2030
- FIG. 8 Global RFID KanBan systems market, 2017 - 2030 (USD Million)
- FIG. 9 Global RFID smart cabinets market revenue, 2017 - 2030 (USD Million)
- FIG. 10 Global (EHR) market revenue, 2017 - 2030 (USD Million)
- FIG. 11 Global Telemedicine market revenue, 2017 - 2030 (USD Million)
- FIG. 12 Global mHealth market revenue, 2017 - 2030 (USD Million)
- FIG. 13 Global smart pills market revenue, 2017 - 2030 (USD Million)
- FIG. 14 Global smart syringes market revenue, 2017 - 2030 (USD Million)
- FIG. 15 Smart healthcare market share by region, 2021 & 2030
- FIG. 16 North America smart healthcare market, 2017 - 2030 (USD Million)
- FIG. 17 U.S. smart healthcare market, 2017 - 2030 (USD Million)
- FIG. 18 Canada smart healthcare market, 2017 - 2030 (USD Million)
- FIG. 19 Europe smart healthcare market, 2017 - 2030 (USD Million)
- FIG. 20 Germany smart healthcare market, 2017 - 2030 (USD Million)
- FIG. 21 U.K. smart healthcare market, 2017 - 2030 (USD Million)
- FIG. 22 Italy smart healthcare market, 2017 - 2030 (USD Million)
- FIG. 23 Spain smart healthcare market, 2017 - 2030 (USD Million)
- FIG. 24 France smart healthcare market, 2017 - 2030 (USD Million)
- FIG. 25 Asia Pacific smart healthcare market, 2017 - 2030 (USD Million)
- FIG. 26 China smart healthcare market, 2017 - 2030 (USD Million)
- FIG. 27 Japan smart healthcare market, 2017 - 2030 (USD Million)
- FIG. 28 India smart healthcare market, 2017 - 2030 (USD Million)
- FIG. 29 Australia smart healthcare market, 2017 - 2030 (USD Million)
- FIG. 30 South Korea smart healthcare market, 2017 - 2030 (USD Million)
- FIG. 31 Latin America smart healthcare market, 2017 - 2030 (USD Million)
- FIG. 32 Brazil smart healthcare market, 2017 - 2030 (USD Million)
- FIG. 33 Mexico smart healthcare market, 2017 - 2030 (USD Million)
- FIG. 34 Argentina smart healthcare market, 2017 - 2030 (USD Million)
- FIG. 35 MEA smart healthcare market, 2017 - 2030 (USD Million)
- FIG. 36 South Africa smart healthcare market, 2017 - 2030 (USD Million)
- FIG. 33 Saudi Arabia smart healthcare market, 2017 - 2030 (USD Million)
- FIG. 33 UAE smart healthcare market, 2017 - 2030 (USD Million)
Smart Healthcare Market Growth & Trends:
The global smart healthcare market size is expected to reach USD 483.4 billion by 2030, according to a new report by Grand View Research, Inc. The market is expected to expand at a CAGR of 13.3% from 2022 to 2030. The COVID-19 pandemic is likely to boost the market growth as these solutions help healthcare professionals to connect effectively with their patients and offer quality treatment. Owing to social distancing, remote patient monitoring, and virtual healthcare delivery is gaining momentum. For instance, the U.K. has introduced free virtual consultation during the coronavirus crisis. In April 2020, doctorinthehouse.net, a not-for-profit online healthcare service in the U.K. launched a platform in collaboration with volunteers amongst doctors, pharmacists, and specialist nurses aiming to schedule 25,000 online appointments and supply 100,000 online assessments for over 200 at-home clinicians. Such initiatives are expected to drive the market ahead.
Operating costs are mainly governed by production costs, inventory storage costs, manufacturing overhead costs, wages, energy costs, and logistical costs. Poor inventory control is a major issue faced by companies that leads to substantial operating losses. There is an increasing demand for RFID kanban systems to control their inventory costs. RFID kanban systems owing to associated benefits such as reduction in manpower, higher efficiency, and cost-effectiveness is anticipated drive traction over the forecast period.
Technological advancements are rapidly transforming the market for smart healthcare. Some of the major market players such as IBM, Cisco, Given Imaging, Inc., Olympus Corporation, Logi-Tag, Brooks Automation, Stanley Innerspace, GE Healthcare, and others account for a substantial market share, owing to their extensive product offerings. Key players are focusing on expanding their current portfolio as in March 2020, Siemens Healthineers launched Teamplay digital health platform. It is aimed to enable digital healthcare transformation and eases quick access to clinical and operational solutions. Also, in June 2019, Intel introduced Network And Custom Logic Group it is a broad portfolio of products for Artificial Intelligence (AI) and 5G cloud. This is aimed to broaden the horizons of healthcare applications.
Smart Healthcare Market Report Highlights:
- The mHealth segment held the dominant share of over 39.0% in 2021 due to the growing usage of the internet, penetration of smartphones, and the increased adoption of mHealth technologies by healthcare professionals and patients
- The telemedicine segment is expected to be the second-fastest-growing segment from 2022 to 2030. The growing prevalence of chronic conditions, rising demand for self-health care, and the outbreak of COVID-19 pandemic are the key factors driving the growth
- The smart pills segment demonstrated promising growth during the forecast period owing to technological development including miniaturization of integrated circuits, an increase in focus on patient convenience, and high demand for minimally invasive procedures
- Companies are adopting innovative strategies to attain a competitive advantage. Product development, partnerships, strategic collaborations, mergers and acquisitions, and regional expansion are a few of them
- Since April 2020, IBM Research has been keenly developing novel cloud and AI-powered technologies that can assist researchers throughout a range of scientific disciplines and accelerate the discovery process
Table of Contents
Chapter 1 Research Methodology
- 1.1 Research Methodology
- 1.2 Information Procurement
- 1.2.1 Purchased Database:
- 1.2.2 Gvr's Internal Database
- 1.2.3 Secondary Sources
- 1.2.4 Primary Research:
- 1.2.5 Details Of Primary Research
- 1.3 Information or Data Analysis
- 1.3.1 Data Analysis Models
- 1.4 Market Formulation & Validation
- 1.5 Model Details
- 1.5.1 Commodity Workflow Analysis (Model 1)
- 1.6 List of Secondary Sources
- 1.7 List of Primary Sources
- 1.8 Abbreviations
- 1.9 Report Objectives
Chapter 2 Executive Summary
- 2.1 Market Snapshot
Chapter 3. Smart Healthcare Industry Outlook
- 3.1. Market Lineaage Outlook
- 3.1.1 Parent Market
- 3.1.2 Ancillary Market
- 3.2 Smart Healthcare Market Segmentation
- 3.3. Smart Healthcare Market Size and Growth Prospects
- 3.4. Smart Healthcare Market Dynamics
- 3.4.1. Market Driver Analysis
- 3.4.2. Market Restraint Analysis
- 3.5. Key Opportunities Prioritized
- 3.6. Industry Analysis - Porter's
- 3.7 Smart Healthcare Market PESTEL Analysis
Chapter 4. Smart Healthcare Market: Covid-19 Impact
- 4.1.Current And Future Impact Analysis
- 4.2 Disease Prevalence Analysis
- 4.3 Opportunity Analysis
- 4.4 Impact On Market Players
Chapter 5. Smart Healthcare Product Outlook
- 5.1. Smart Healthcare Market Share By Product, 2021 & 2030
- 5.2. RFID KanBan Systems
- 5.2.1. RFID Kanban Systems Market Estimates and Forecasts, 2017 - 2030 (USD Million)
- 5.3. RFID Smart Cabinets
- 5.3.1. RFID Smart Cabinets Market Estimates and Forecasts, 2017 - 2030 (USD Million)
- 5.4. Electronic Health Records (EHR)
- 5.4.1. EHR Market Estimates and Forecasts, 2017 - 2030 (USD Million)
- 5.4.2. Client-Server Based Market Estimates and Forecasts, 2017 - 2030 (USD Million)
- 5.4.3. Web-Based Market Estimates and Forecasts, 2017 - 2030 (USD Million)
- 5.5. Telemedicine
- 5.5.1. Telemedicine Market Estimates and Forecasts, 2017 - 2030 (USD Million)
- 5.5.2. Hardware Market Estimates and Forecasts, 2017 - 2030 (USD Million)
- 5.5.3. Connectivity & Network Market Estimates and Forecasts, 2017 - 2030 (USD Million)
- 5.5.4. Others Market Estimates and Forecasts, 2017 - 2030 (USD Million)
- 5.6. mHealth
- 5.6.1. mHealth Market Estimates and Forecasts, 2017 - 2030 (USD Million)
- 5.6.2. Monitoring Services Market Estimates and Forecasts, 2017 - 2030 (USD Million)
- 5.6.3. Diagnosis Services Market Estimates and Forecasts, 2017 - 2030 (USD Million)
- 5.6.4. Healthcare Systems Strengthening Services Market Estimates and Forecasts, 2017 - 2030 (USD Million)
- 5.6.5. Others Market Estimates and Forecasts, 2017 - 2030 (USD Million)
- 5.7. Smart Pills
- 5.7.1. Smart Pills Market Estimates and Forecasts, 2017 - 2030 (USD Million)
- 5.8. Smart Syringes
- 5.8.1. Smart Syringes Market Estimates and Forecasts, 2017 - 2030 (USD Million)
Chapter 6. Smart Healthcare Regional Outlook
- 6.1. Smart Healthcare Market Share By Region, 2017 & 2030
- 6.2. North America
- 6.2.1. North America Market Estimates and Forecasts, by Product, 2017 - 2030 (USD Million)
- 6.2.1.1. U.S. Market Estimates and Forecasts
- 6.2.1.2. Canada Market Estimates and Forecasts
- 6.2.1. North America Market Estimates and Forecasts, by Product, 2017 - 2030 (USD Million)
- 6.3. Europe
- 6.3.1. Europe Market Estimates and Forecasts, by Product, 2017 - 2030 (USD Million)
- 6.3.1.1. Germany Market Estimates and Forecasts
- 6.3.1.2. U.K. Market Estimates and Forecasts
- 6.3.1.3. Spain Market Estimates and Forecasts
- 6.3.1.4. Italy Market Estimates and Forecasts
- 6.3.1.5. France Market Estimates and Forecasts
- 6.3.1. Europe Market Estimates and Forecasts, by Product, 2017 - 2030 (USD Million)
- 6.4. Asia Pacific
- 6.4.1. Asia Pacific Market Estimates and Forecasts, by Product, 2017 - 2030 (USD Million)
- 6.4.1.1. China Market Estimates and Forecasts
- 6.4.1.2. Japan Market Estimates and Forecasts
- 6.4.1.3. India Market Estimates and Forecasts
- 6.4.1.4. Australia Market Estimates and Forecasts
- 6.4.1.5. South Korea Market Estimates and Forecasts
- 6.4.1. Asia Pacific Market Estimates and Forecasts, by Product, 2017 - 2030 (USD Million)
- 6.5. Latin America
- 6.5.1. Latin America Market Estimates and Forecasts, by Product, 2017 - 2030 (USD Million)
- 6.5.1.1. Mexico Market Estimates and Forecasts
- 6.5.1.2. Brazil Market Estimates and Forecasts
- 6.5.1.3. Argentina Market Estimates and Forecasts
- 6.5.1. Latin America Market Estimates and Forecasts, by Product, 2017 - 2030 (USD Million)
- 6.6. MEA
- 6.6.1. MEA Market Estimates and Forecasts, by Product, 2017 - 2030 (USD Million)
- 6.6.1.1. South Africa Market Estimates and Forecasts
- 6.6.1.2. Saudi Arabia Market Estimates and Forecasts
- 6.6.1.3. UAE Market Estimates and Forecasts
- 6.6.1. MEA Market Estimates and Forecasts, by Product, 2017 - 2030 (USD Million)
Chapter 7. Competitive Landscape
- 7.1 Competitive Dashboard Analysis
- 7.2 Public Companies
- 7.2.1 Company market position analysis
- 7.2.2 Heat Map Analysis
- 7.3 Detailed list of Market Players
Chapter 8. Company Profiles
- 8.1. IBM
- 8.1.1. Company Overview
- 8.1.2. Financial Performance
- 8.1.3. Product Benchmarking
- 8.1.4. Strategic Initiatives
- 8.2. Cisco
- 8.2.1. Company Overview
- 8.2.2. Financial Performance
- 8.2.3. Product Benchmarking
- 8.2.4. Strategic Initiatives
- 8.3. Given Imaging, Inc.
- 8.3.1. Company Overview
- 8.3.2. Financial Performance
- 8.3.3. Product Benchmarking
- 8.3.4. Strategic Initiatives
- 8.4. Olympus Corporation
- 8.4.1. Company Overview
- 8.4.2. Financial Performance
- 8.4.3. Product Benchmarking
- 8.4.4. Strategic Initiatives
- 8.5. Logi-Tag
- 8.5.1. Company Overview
- 8.5.2. Financial Performance
- 8.5.3. Product Benchmarking
- 8.5.4. Strategic Initiatives
- 8.6. Brooks Automation
- 8.6.1. Company Overview
- 8.6.2. Financial Performance
- 8.6.3. Product Benchmarking
- 8.6.4. Strategic Initiatives
- 8.7. Stanley Innerspace
- 8.7.1. Company Overview
- 8.7.2. Financial Performance
- 8.7.3. Product Benchmarking
- 8.7.4. Strategic Initiatives
- 8.8. Solstice Medical LLC
- 8.8.1. Company Overview
- 8.8.2. Financial Performance
- 8.8.3. Product Benchmarking
- 8.8.4. Strategic Initiatives
- 8.9. GE Healthcare
- 8.9.1. Company Overview
- 8.9.2. Financial Performance
- 8.9.3. Product Benchmarking
- 8.9.4. Strategic Initiatives
- 8.10. Siemens Medical Solutions
- 8.10.1. Company Overview
- 8.10.2. Financial Performance
- 8.10.3. Product Benchmarking
- 8.10.4. Strategic Initiatives
- 8.11. McKesson Corp.
- 8.11.1. Company Overview
- 8.11.2. Financial Performance
- 8.11.3. Product Benchmarking
- 8.11.4. Strategic Initiatives
- 8.12. Allscripts Healthcare Solutions
- 8.12.1. Company Overview
- 8.12.2. Financial Performance
- 8.12.3. Product Benchmarking
- 8.12.4. Strategic Initiatives
- 8.13. Samsung Electronics Corporation
- 8.13.1. Company Overview
- 8.13.2. Financial Performance
- 8.13.3. Product Benchmarking
- 8.13.4. Strategic Initiatives
- 8.14. AirStrip Technologies Inc.
- 8.14.1. Company Overview
- 8.14.2. Financial Performance
- 8.14.3. Product Benchmarking
- 8.14.4. Strategic Initiatives
- 8.15. Apple Inc.
- 8.15.1. Company Overview
- 8.15.2. Financial Performance
- 8.15.3. Product Benchmarking
- 8.15.4. Strategic Initiatives
- 8.16. AT&T Inc.
- 8.16.1. Company Overview
- 8.16.2. Financial Performance
- 8.16.3. Product Benchmarking
- 8.16.4. Strategic Initiatives
- 8.17. Cerner Corporation
- 8.17.1. Company Overview
- 8.17.2. Financial Performance
- 8.17.3. Product Benchmarking
- 8.17.4. Strategic Initiatives
- 8.18. Pepperl+Fuchs
- 8.18.1. Company Overview
- 8.18.2. Financial Performance
- 8.18.3. Product Benchmarking
- 8.18.4. Strategic Initiatives
- 8.19. Hurst Green Plastics Ltd.
- 8.19.1. Company Overview
- 8.19.2. Financial Performance
- 8.19.3. Product Benchmarking
- 8.19.4. Strategic Initiatives
- 8.20. Bollhoff Group
- 8.20.1. Company Overview
- 8.20.2. Financial Performance
- 8.20.3. Product Benchmarking
- 8.20.4. Strategic Initiatives
- 8.21. Wurth Group
- 8.21.1. Company Overview
- 8.21.2. Financial Performance
- 8.21.3. Product Benchmarking
- 8.21.4. Strategic Initiatives
- 8.22. Brooks Automation
- 8.22.1. Company Overview
- 8.22.2. Financial Performance
- 8.22.3. Product Benchmarking
- 8.22.4. Strategic Initiatives
- 8.23. LogTag
- 8.23.1. Company Overview
- 8.23.2. Financial Performance
- 8.23.3. Product Benchmarking
- 8.23.4. Strategic Initiatives
- 8.24. Stanley Innerspace
- 8.24.1. Company Overview
- 8.24.2. Financial Performance
- 8.24.3. Product Benchmarking
- 8.24.4. Strategic Initiatives