|
|
市場調査レポート
商品コード
1233208
ウィメンズヘルス・美容サプリメントの市場規模、シェア、動向分析レポート製品別、用途別、年齢層別、消費者グループ別、販売チャネル別、地域別、セグメント別予測、2023年~2030年Women's Health And Beauty Supplements Market Size, Share & Trends Analysis Report By Product, By Application, By Age Group, By Consumer Group, By Sales Channel, By Region, And Segment Forecasts, 2023 - 2030 |
||||||
|
|
|||||||
|
● お客様のご希望に応じて、既存データの加工や未掲載情報(例:国別セグメント)の追加などの対応が可能です。 詳細はお問い合わせください。 |
|||||||


| ウィメンズヘルス・美容サプリメントの市場規模、シェア、動向分析レポート製品別、用途別、年齢層別、消費者グループ別、販売チャネル別、地域別、セグメント別予測、2023年~2030年 |
|
出版日: 2023年02月20日
発行: Grand View Research
ページ情報: 英文 150 Pages
納期: 2~10営業日
|
- 全表示
- 概要
- 図表
- 目次
ウィメンズヘルス・美容サプリメント市場の成長と動向
Grand View Research, Inc.の最新レポートによると、世界のウィメンズヘルス・美容サプリメント市場規模は、予測期間中に5.1%のCAGRで拡大し、2030年までに792億9000万米ドルに達すると予測されています。
この市場は、健康的な生活や健康に対する意識の高まりと、活動的なライフスタイルの採用の増加により、飛躍的な成長機会を迎えると予測されています。さらに、貧血、うつ病、関節炎など、さまざまな疾患の治療におけるサプリメントの幅広い用途が、需要を後押ししています。
微量栄養素の欠乏と栄養不足は世界の健康問題であり、特に中東や中南米諸国では顕著です。妊婦や出産適齢期の女性の間で指摘されている鉄分、葉酸、ビタミンDの顕著な不足は、ここ数年、ウィメンズヘルスサプリメントの需要を牽引しています。例えば、パデュー大学の最近の調査結果では、ほとんどの女性がビタミンやその他の微量栄養素の不足に陥っているとされています。
さらに、世界中で菜食主義の傾向が強まっており、予測期間中、ハーブサプリメントの需要に貢献すると予想されています。特に女性は、長期的な効能と副作用の少なさから、ハーブサプリメントを好むようになってきています。このような動向は、市場関係者がハーブサプリメントを発売することを後押ししています。例えば、2022年10月にPharmactive Biotech Products, S.L.U.は、女性および男性の性機能を強化するダミアナを発売しました。さらに、202年12月1日には、Nutriliteがミレニアル世代の女性向けに設計された初のサプリメントシリーズを発売しました。この新発売の製品は、ハーブエキス、ビタミン、ミネラルを適切にブレンドしています。
さらに、主要な市場関係者が取り組んでいる有機および無機のさまざまな成長戦略は、市場に有利な成長機会をもたらすと予測されます。例えば、202年8月、The Honest CompanyはGNCで4つの新しい女性向けウェルネス製品を発売しました。これらの新しく発売された製品は、気分のバランス、免疫サポート、睡眠の健康、産後の健康のためのウェルネスです。さらに、2022年 3月には、Laboratoire PYCが2種類のビーガングミの美容・免疫健康サプリメントを発売しました。この発売は、おいしさと医療効果を兼ね備えた栄養補助食品への需要の高まりに対応するために行われました。
ウィメンズヘルス・美容サプリメント市場のハイライト
- ビタミン類は、ビタミン需要の高さ、健康的なライフスタイルの普及、予防医療のトレンドの高まりから、20223年に最大の売上シェアを占める。
- 酵素分野は、酵素ベースの製品の採用が増加し、酵素サプリメントに関連する利点に関する女性の意識が高まっているため、予測期間中に最も速いCAGRを記録すると予想されています。
- 消化器の健康、免疫の健康、関節の健康など、さまざまな症状に対応する数多くのサプリメントが堅調に推移していること、より多くの消費者が存在することから、2022年にはウィメンズヘルス分野が最大の市場を占めています。
- 年齢層別では、31~50歳のセグメントが2022年の市場を独占していますが、70歳以上のセグメントが予測期間中に最も急速に成長すると予測されています。
- 販売チャネルに基づくと、直販チャネルセグメントが2022年に最大の収益シェアを占めました。しかし、オンラインセグメントは予測期間中に有利なCAGRで成長すると予測されます。
- 中東・アフリカは、栄養不足とともに健康や福祉に対する意識の高まりから、予測期間中に最も速いCAGRを示すと予想されます。
目次
第1章 調査手法と範囲
- 市場セグメンテーションと範囲
- 調査手法
- 調査手法
- 情報調達
- 購入したデータベース
- Gvrの内部データベース
- 二次情報
- 1次調査:
- 情報またはデータ分析
- 市場の策定と検証
- データ分析モデル
- 市場の策定と検証
- ウィメンズヘルス・美容サプリメント市場:CAGRの計算
- セグメントシェア計算
- 調査範囲と前提
- 調査手法
- ボトムアップアプローチ
- 市場予測と予測要因
- 調査手法
- データソースのリスト
第2章 エグゼクティブサマリー
- 市場の見通し
- セグメントの見通し
- 競合考察
- ウィメンズヘルス・美容サプリメント市場のスナップショット
- 競合情勢のスナップショット
第3章 ウィメンズヘルス・美容サプリメント市場の変数、動向、範囲
- 浸透と成長の見通しのマッピング
- 市場力学
- 市場促進要因分析
- 健康意識の高まりとアクティブな生活への消費者の関心の高まり
- 可処分所得の増加
- 女性の栄養補助食品・美容サプリメントのオンラインプラットフォームの出現
- 妊婦の微量栄養素欠乏症の有病率の増加
- 栄養補助食品と女性のエンパワーメントの利点について女性の意識を高める
- 市場抑制要因分析
- 偽造品の存在
- 業界の課題
- 規制シナリオの変化
- 市場促進要因分析
- ウィメンズヘルス・美容サプリメント市場分析ツール
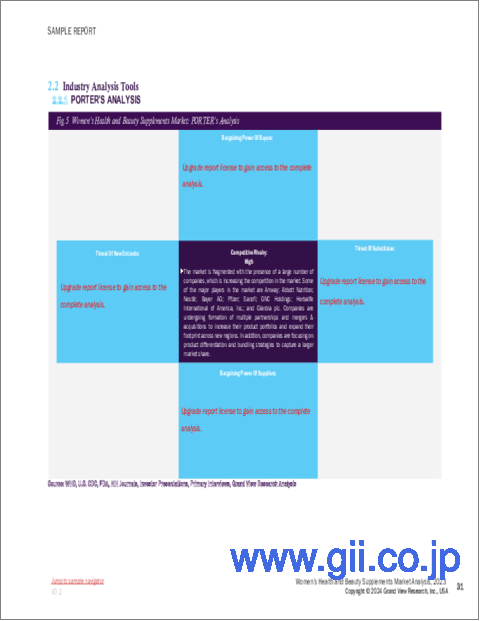
- 業界分析:ポーターズ
- 供給企業の交渉力-低
- バイヤーの交渉力-高い
- 身代わりの脅威- 中程度
- 新規参入業者の脅威-やや低い
- 競争企業間の敵対関係-高
- PESTEL分析
- 政治的および法的情勢
- 経済社会情勢
- 環境とテクノロジーの情勢
- 業界分析:ポーターズ
- ウィメンズヘルス・美容サプリメント市場に対するCOVID-19の影響
第4章 ウィメンズヘルス・美容サプリメント市場:競合情勢分析
- 最近の進展・影響分析:主要市場参入企業別
- 企業/競争の分類(主要イノベーター、市場リーダー、新規企業)
- 企業の市場ポジショニング分析
第5章 ウィメンズヘルス・美容サプリメント市場:製品推定・動向分析
- ウィメンズヘルス・美容サプリメント市場:製品変動分析、2022年と2030年(10億米ドル)
- ビタミン
- ミネラル
- 酵素
- 植物薬
- タンパク質
- オメガ3
- プロバイオティクス
- その他
第6章 ウィメンズヘルス・美容サプリメント市場:アプリケーションの推定・動向分析
- ウィメンズヘルス・美容サプリメント市場:アプリケーションの変動分析、2022年と2030年(10億米ドル)
- 美しさ
- スキンケア
- ネイルケア
- ヘアケア
- その他
- ウィメンズヘルス
第7章 ウィメンズヘルス・美容サプリメント市場:年齢層の推定・動向分析
- ウィメンズヘルス・美容サプリメント市場:年齢層の変動分析、2022年と2030年(10億米ドル)
- 15~30歳
- 31~50歳
- 51~70歳
- 70歳以上
第8章 ウィメンズヘルス・美容サプリメント市場:消費者グループの推定・動向分析
- ウィメンズヘルス・美容サプリメント市場:消費者グループの変動分析、2022年と2030年(10億米ドル)
- 出生前
- 生後
- 月経前症候群(Pms)
- 閉経周辺期
- 閉経後
- その他
第9章 ウィメンズヘルス・美容サプリメント市場:販売チャネルの推定・動向分析
- ウィメンズヘルス・美容サプリメント市場:販売チャネルの変動分析、2022年と2030年(10億米ドル)
- オンライン販売チャネル
- 直販チャネル
- 薬局/ドラッグストア
- その他のオフラインチャネル
第10章 ウィメンズヘルス・美容サプリメント市場:製品、アプリケーション、年齢層、消費者層、および販売チャネル別の地域推定・動向分析
- 北米
- SWOT分析
- 米国
- 規制の枠組み
- カナダ
- 規制の枠組み
- 欧州
- SWOT分析
- 規制の枠組み
- 英国
- 規制の枠組み
- ドイツ
- 規制の枠組み
- フランス
- 規制の枠組み
- スペイン
- 規制の枠組み
- イタリア
- 規制の枠組み
- ロシア
- 規制の枠組み
- デンマーク
- 規制の枠組み
- ノルウェー
- 規制の枠組み
- スウェーデン
- 規制の枠組み
- SWOT分析
- アジア太平洋地域
- SWOT分析
- 日本
- 規制の枠組み
- 中国
- 規制の枠組み
- インド
- 規制の枠組み
- オーストラリア
- 規制の枠組み
- 韓国
- 規制の枠組み
- 台湾
- 規制の枠組み
- マレーシア
- 規制の枠組み
- タイ
- 規制の枠組み
- ラテンアメリカ
- SWOT分析
- 規制の枠組み
- ブラジル
- 規制の枠組み
- メキシコ
- 規制の枠組み
- アルゼンチン
- 規制の枠組み
- SWOT分析
- MEA
- SWOT分析
- 南アフリカ
- 規制の枠組み
- サウジアラビア
- 規制の枠組み
- アラブ首長国連邦
- 規制の枠組み
- クウェート
- 規制の枠組み
第11章 競合情勢
- Participant's Overview
- Financial Performance
- Strategy Mapping
- 拡張
- 取得
- 製品/サービスの発売
- パートナーシップ
- その他
- Company Profile
- Herbalife International of America, Inc.
- GNC Holdings, Inc
- Nature's Bounty
- Bayer AG
- Suntory Holdings Limited
- Taisho Pharmaceutical Co., Ltd
- Pharmavite LLC
- Pfizer, Inc
- Blackmores
- FANCL Corporation
- Asahi Group Holdings, Ltd
- USANA Health Sciences, Inc.
- Nu Skin Enterprise, Inc.
- BY-HEALTH Co., Ltd.
- Revital Ltd
- The Himalaya Drug Company
- Vita Life Sciences
- Standard Foods Corporation
- garden of life (Nestle)
List of Tables
- Table 1 List of Secondary Sources
- Table 2 List of Abbreviations
- Table 3 Leading Market Players Anticipated to Witness Highest Growth
- Table 4 Global Women's Health and Beauty Supplements Market, By Region, 2018 - 2030 (USD Million)
- Table 5 Global Women's Health and Beauty Supplements Market, By Product, 2018 - 2030 (USD Million)
- Table 6 Global Women's Health and Beauty Supplements Market, By Application, 2018 - 2030 (USD Million)
- Table 7 Global Women's Health and Beauty Supplements Market, By Age Group, 2018 - 2030 (USD Million)
- Table 8 Global Women's Health and Beauty Supplements Market, By Consumer Group, 2018 - 2030 (USD Million)
- Table 9 Global Women's Health and Beauty Supplements Market, By Sales Channel, 2018 - 2030 (USD Million)
- Table 10 North America Women's Health and Beauty Supplements Market, By Country, 2018 - 2030 (USD Million)
- Table 11 North America Women's Health and Beauty Supplements Market, By Product, 2018 - 2030 (USD Million)
- Table 12 North America Women's Health and Beauty Supplements Market, By Application, 2018 - 2030 (USD Million)
- Table 13 North America Women's Health and Beauty Supplements Market, By Age Group, 2018 - 2030 (USD Million)
- Table 14 North America Women's Health and Beauty Supplements Market, By Consumer Group, 2018 - 2030 (USD Million)
- Table 15 North America Women's Health and Beauty Supplements Market, By Sales Channel, 2018 - 2030 (USD Million)
- Table 16 U.S. Women's Health and Beauty Supplements Market, By Product, 2018 - 2030 (USD Million)
- Table 17 U.S. Women's Health and Beauty Supplements Market, By Application, 2018 - 2030 (USD Million)
- Table 18 U.S. Women's Health and Beauty Supplements Market, By Age Group, 2018 - 2030 (USD Million)
- Table 19 U.S. Women's Health and Beauty Supplements Market, By Consumer Group, 2018 - 2030 (USD Million)
- Table 20 U.S. Women's Health and Beauty Supplements Market, By Sales Channel, 2018 - 2030 (USD Million)
- Table 21 Canada Women's Health and Beauty Supplements Market, By Product, 2018 - 2030 (USD Million)
- Table 22 Canada Women's Health and Beauty Supplements Market, By Application, 2018 - 2030 (USD Million)
- Table 23 Canada Women's Health and Beauty Supplements Market, By Age Group, 2018 - 2030 (USD Million)
- Table 24 Canada Women's Health and Beauty Supplements Market, By Consumer Group, 2018 - 2030 (USD Million)
- Table 25 Canada Women's Health and Beauty Supplements Market, By Age Sales Channel, 2018 - 2030 (USD Million)
- Table 26 Europe Women's Health and Beauty Supplements Market, By Country, 2018 - 2030 (USD Million)
- Table 27 Europe Women's Health and Beauty Supplements Market, By Product, 2018 - 2030 (USD Million)
- Table 28 Europe Women's Health and Beauty Supplements Market, By Application, 2018 - 2030 (USD Million)
- Table 29 Europe Women's Health and Beauty Supplements Market, By Age Group, 2018 - 2030 (USD Million)
- Table 30 Europe Women's Health and Beauty Supplements Market, By Consumer Group, 2018 - 2030 (USD Million)
- Table 31 Europe Women's Health and Beauty Supplements Market, By Sales Channel, 2018 - 2030 (USD Million)
- Table 32 U.K. Women's Health and Beauty Supplements Market, By Product, 2018 - 2030 (USD Million)
- Table 33 U.K. Women's Health and Beauty Supplements Market, By Application, 2018 - 2030 (USD Million)
- Table 34 U.K. Women's Health and Beauty Supplements Market, By Age Group, 2018 - 2030 (USD Million)
- Table 35 U.K. Women's Health and Beauty Supplements Market, By Consumer Group, 2018 - 2030 (USD Million)
- Table 36 U.K. Women's Health and Beauty Supplements Market, By Sales Channel, 2018 - 2030 (USD Million)
- Table 37 Germany Women's Health and Beauty Supplements Market, By Product, 2018 - 2030 (USD Million)
- Table 38 Germany Women's Health and Beauty Supplements Market, By Application, 2018 - 2030 (USD Million)
- Table 39 Germany Women's Health and Beauty Supplements Market, By Age Group, 2018 - 2030 (USD Million)
- Table 40 Germany Women's Health and Beauty Supplements Market, By Consumer Group, 2018 - 2030 (USD Million)
- Table 41 Germany Women's Health and Beauty Supplements Market, By Sales Channel, 2018 - 2030 (USD Million)
- Table 42 France Women's Health and Beauty Supplements Market, By Product, 2018 - 2030 (USD Million)
- Table 43 France Women's Health and Beauty Supplements Market, By Application, 2018 - 2030 (USD Million)
- Table 44 France Women's Health and Beauty Supplements Market, By Age Group, 2018 - 2030 (USD Million)
- Table 45 France Women's Health and Beauty Supplements Market, By Consumer Group, 2018 - 2030 (USD Million)
- Table 46 France Women's Health and Beauty Supplements Market, By Sales Channel, 2018 - 2030 (USD Million)
- Table 47 Italy Women's Health and Beauty Supplements Market, By Product, 2018 - 2030 (USD Million)
- Table 48 Italy Women's Health and Beauty Supplements Market, By Application, 2018 - 2030 (USD Million)
- Table 49 Italy Women's Health and Beauty Supplements Market, By Age Group, 2018 - 2030 (USD Million)
- Table 50 Italy Women's Health and Beauty Supplements Market, By Consumer Group, 2018 - 2030 (USD Million)
- Table 51 Italy Women's Health and Beauty Supplements Market, By Sales Channel, 2018 - 2030 (USD Million)
- Table 52 Spain Women's Health and Beauty Supplements Market, By Product, 2018 - 2030 (USD Million)
- Table 53 Spain Women's Health and Beauty Supplements Market, By Application, 2018 - 2030 (USD Million)
- Table 54 Spain Women's Health and Beauty Supplements Market, By Age Group, 2018 - 2030 (USD Million)
- Table 55 Spain Women's Health and Beauty Supplements Market, By Consumer Group, 2018 - 2030 (USD Million)
- Table 56 Spain Women's Health and Beauty Supplements Market, By Sales Channel, 2018 - 2030 (USD Million)
- Table 57 Russia Women's Health and Beauty Supplements Market, By Product, 2018 - 2030 (USD Million)
- Table 58 Russia Women's Health and Beauty Supplements Market, By Application, 2018 - 2030 (USD Million)
- Table 59 Russia Women's Health and Beauty Supplements Market, By Age Group, 2018 - 2030 (USD Million)
- Table 60 Russia Women's Health and Beauty Supplements Market, By Consumer Group, 2018 - 2030 (USD Million)
- Table 61 Russia Women's Health and Beauty Supplements Market, By Sales Channel, 2018 - 2030 (USD Million)
- Table 62 Denmark Women's Health and Beauty Supplements Market, By Product, 2018 - 2030 (USD Million)
- Table 63 Denmark Women's Health and Beauty Supplements Market, By Application, 2018 - 2030 (USD Million)
- Table 64 Denmark Women's Health and Beauty Supplements Market, By Age Group, 2018 - 2030 (USD Million)
- Table 65 Denmark Women's Health and Beauty Supplements Market, By Consumer Group, 2018 - 2030 (USD Million)
- Table 66 Denmark Women's Health and Beauty Supplements Market, By Sales Channel, 2018 - 2030 (USD Million)
- Table 67 Norway Women's Health and Beauty Supplements Market, By Product, 2018 - 2030 (USD Million)
- Table 68 Norway Women's Health and Beauty Supplements Market, By Application, 2018 - 2030 (USD Million)
- Table 69 Norway Women's Health and Beauty Supplements Market, By Age Group, 2018 - 2030 (USD Million)
- Table 70 Norway Women's Health and Beauty Supplements Market, By Consumer Group, 2018 - 2030 (USD Million)
- Table 71 Norway Women's Health and Beauty Supplements Market, By Sales Channel, 2018 - 2030 (USD Million)
- Table 72 Sweden Women's Health and Beauty Supplements Market, By Product, 2018 - 2030 (USD Million)
- Table 73 Sweden Women's Health and Beauty Supplements Market, By Application, 2018 - 2030 (USD Million)
- Table 74 Sweden Women's Health and Beauty Supplements Market, By Age Group, 2018 - 2030 (USD Million)
- Table 75 Sweden Women's Health and Beauty Supplements Market, By Consumer Group, 2018 - 2030 (USD Million)
- Table 76 Sweden Women's Health and Beauty Supplements Market, By Sales Channel, 2018 - 2030 (USD Million)
- Table 77 Asia Pacific Women's Health and Beauty Supplements Market, By Country, 2018 - 2030 (USD Million)
- Table 78 Asia Pacific Women's Health and Beauty Supplements Market, By Product, 2018 - 2030 (USD Million)
- Table 79 Asia Pacific Women's Health and Beauty Supplements Market, By Application, 2018 - 2030 (USD Million)
- Table 80 Asia Pacific Women's Health and Beauty Supplements Market, By Age Group, 2018 - 2030 (USD Million)
- Table 81 Asia Pacific Women's Health and Beauty Supplements Market, By Consumer Group, 2018 - 2030 (USD Million)
- Table 82 Asia Pacific Women's Health and Beauty Supplements Market, By Sales Channel, 2018 - 2030 (USD Million)
- Table 83 Japan Women's Health and Beauty Supplements Market, By Product, 2018 - 2030 (USD Million)
- Table 84 Japan Women's Health and Beauty Supplements Market, By Application, 2018 - 2030 (USD Million)
- Table 85 Japan Women's Health and Beauty Supplements Market, By Age Group, 2018 - 2030 (USD Million)
- Table 86 Japan Women's Health and Beauty Supplements Market, By Consumer Group, 2018 - 2030 (USD Million)
- Table 87 Japan Women's Health and Beauty Supplements Market, By Sales Channel, 2018 - 2030 (USD Million)
- Table 88 China Women's Health and Beauty Supplements Market, By Product, 2018 - 2030 (USD Million)
- Table 89 China Women's Health and Beauty Supplements Market, By Application, 2018 - 2030 (USD Million)
- Table 90 China Women's Health and Beauty Supplements Market, By Age Group, 2018 - 2030 (USD Million)
- Table 91 China Women's Health and Beauty Supplements Market, By Consumer Group, 2018 - 2030 (USD Million)
- Table 92 China Women's Health and Beauty Supplements Market, By Sales Channel, 2018 - 2030 (USD Million)
- Table 93 India Women's Health and Beauty Supplements Market, By Product, 2018 - 2030 (USD Million)
- Table 94 India Women's Health and Beauty Supplements Market, By Application, 2018 - 2030 (USD Million)
- Table 95 India Women's Health and Beauty Supplements Market, By Age Group, 2018 - 2030 (USD Million)
- Table 96 India Women's Health and Beauty Supplements Market, By Consumer Group, 2018 - 2030 (USD Million)
- Table 97 India Women's Health and Beauty Supplements Market, By Sales Channel, 2018 - 2030 (USD Million)
- Table 98 South Korea Women's Health and Beauty Supplements Market, By Product, 2018 - 2030 (USD Million)
- Table 99 South Korea Women's Health and Beauty Supplements Market, By Application, 2018 - 2030 (USD Million)
- Table 100 South Korea Women's Health and Beauty Supplements Market, By Age Group, 2018 - 2030 (USD Million)
- Table 101 South Korea Women's Health and Beauty Supplements Market, By Consumer Group, 2018 - 2030 (USD Million)
- Table 102 South Korea Women's Health and Beauty Supplements Market, By Sales Channel, 2018 - 2030 (USD Million)
- Table 103 Australia Women's Health and Beauty Supplements Market, By Product, 2018 - 2030 (USD Million)
- Table 104 Australia Women's Health and Beauty Supplements Market, By Application, 2018 - 2030 (USD Million)
- Table 105 Australia Women's Health and Beauty Supplements Market, By Age Group, 2018 - 2030 (USD Million)
- Table 106 Australia Women's Health and Beauty Supplements Market, By Consumer Group, 2018 - 2030 (USD Million)
- Table 107 Australia Women's Health and Beauty Supplements Market, By Sales Channel, 2018 - 2030 (USD Million)
- Table 108 Thailand Women's Health and Beauty Supplements Market, By Product, 2018 - 2030 (USD Million)
- Table 109 Thailand Women's Health and Beauty Supplements Market, By Application, 2018 - 2030 (USD Million)
- Table 110 Thailand Women's Health and Beauty Supplements Market, By Age Group, 2018 - 2030 (USD Million)
- Table 111 Thailand Women's Health and Beauty Supplements Market, By Consumer Group, 2018 - 2030 (USD Million)
- Table 112 Thailand Women's Health and Beauty Supplements Market, By Sales Channel, 2018 - 2030 (USD Million)
- Table 113 Taiwan Women's Health and Beauty Supplements Market, By Product, 2018 - 2030 (USD Million)
- Table 114 Taiwan Women's Health and Beauty Supplements Market, By Application, 2018 - 2030 (USD Million)
- Table 115 Taiwan Women's Health and Beauty Supplements Market, By Age Group, 2018 - 2030 (USD Million)
- Table 116 Taiwan Women's Health and Beauty Supplements Market, By Consumer Group, 2018 - 2030 (USD Million)
- Table 117 Taiwan Women's Health and Beauty Supplements Market, By Sales Channel, 2018 - 2030 (USD Million)
- Table 118 Malaysia Women's Health and Beauty Supplements Market, By Product, 2018 - 2030 (USD Million)
- Table 119 Malaysia Women's Health and Beauty Supplements Market, By Application, 2018 - 2030 (USD Million)
- Table 120 Malaysia Women's Health and Beauty Supplements Market, By Age Group, 2018 - 2030 (USD Million)
- Table 121 Malaysia Women's Health and Beauty Supplements Market, By Consumer Group, 2018 - 2030 (USD Million)
- Table 122 Malaysia Women's Health and Beauty Supplements Market, By Sales Channel, 2018 - 2030 (USD Million)
- Table 123 Latin America Women's Health and Beauty Supplements Market, By Country, 2018 - 2030 (USD Million)
- Table 124 Latin America Women's Health and Beauty Supplements Market, By Product, 2018 - 2030 (USD Million)
- Table 125 Latin America Women's Health and Beauty Supplements Market, By Application, 2018 - 2030 (USD Million)
- Table 126 Latin America Women's Health and Beauty Supplements Market, By Age Group, 2018 - 2030 (USD Million)
- Table 127 Latin America Women's Health and Beauty Supplements Market, By Consumer Group, 2018 - 2030 (USD Million)
- Table 128 Latin America Women's Health and Beauty Supplements Market, By Sales Channel, 2018 - 2030 (USD Million)
- Table 129 Brazil Women's Health and Beauty Supplements Market, By Product, 2018 - 2030 (USD Million)
- Table 130 Brazil Women's Health and Beauty Supplements Market, By Application, 2018 - 2030 (USD Million)
- Table 131 Brazil Women's Health and Beauty Supplements Market, By Age Group, 2018 - 2030 (USD Million)
- Table 132 Brazil Women's Health and Beauty Supplements Market, By Consumer Group, 2018 - 2030 (USD Million)
- Table 133 Brazil Women's Health and Beauty Supplements Market, By Sales Channel, 2018 - 2030 (USD Million)
- Table 134 Argentina Women's Health and Beauty Supplements Market, By Product, 2018 - 2030 (USD Million)
- Table 135 Argentina Women's Health and Beauty Supplements Market, By Application, 2018 - 2030 (USD Million)
- Table 136 Argentina Women's Health and Beauty Supplements Market, By Age Group, 2018 - 2030 (USD Million)
- Table 137 Argentina Women's Health and Beauty Supplements Market, By Consumer Group, 2018 - 2030 (USD Million)
- Table 138 Argentina Women's Health and Beauty Supplements Market, By Sales Channel, 2018 - 2030 (USD Million)
- Table 139 Mexico Women's Health and Beauty Supplements Market, By Product, 2018 - 2030 (USD Million)
- Table 140 Mexico Women's Health and Beauty Supplements Market, By Application, 2018 - 2030 (USD Million)
- Table 141 Mexico Women's Health and Beauty Supplements Market, By Age Group, 2018 - 2030 (USD Million)
- Table 142 Mexico Women's Health and Beauty Supplements Market, By Consumer Group, 2018 - 2030 (USD Million)
- Table 143 Mexico Women's Health and Beauty Supplements Market, By Sales Channel, 2018 - 2030 (USD Million)
- Table 144 Middle East and Africa Women's Health and Beauty Supplements Market, By Country, 2018 - 2030 (USD Million)
- Table 145 Middle East and Africa Women's Health and Beauty Supplements Market, By Product, 2018 - 2030 (USD Million)
- Table 146 Middle East and Africa Women's Health and Beauty Supplements Market, By Application, 2018 - 2030 (USD Million)
- Table 147 Middle East and Africa Women's Health and Beauty Supplements Market, By Age Group, 2018 - 2030 (USD Million)
- Table 148 Middle East and Africa Women's Health and Beauty Supplements Market, By Consumer Group, 2018 - 2030 (USD Million)
- Table 149 Middle East and Africa Women's Health and Beauty Supplements Market, By Sales Channel, 2018 - 2030 (USD Million)
- Table 150 South Africa Women's Health and Beauty Supplements Market, By Product, 2018 - 2030 (USD Million)
- Table 151 South Africa Women's Health and Beauty Supplements Market, By Application, 2018 - 2030 (USD Million)
- Table 152 South Africa Women's Health and Beauty Supplements Market, By Age Group, 2018 - 2030 (USD Million)
- Table 153 South Africa Women's Health and Beauty Supplements Market, By Consumer Group, 2018 - 2030 (USD Million)
- Table 154 South Africa Women's Health and Beauty Supplements Market, By Sales Channel, 2018 - 2030 (USD Million)
- Table 155 Saudi Arabia Women's Health and Beauty Supplements Market, By Product, 2018 - 2030 (USD Million)
- Table 156 Saudi Arabia Women's Health and Beauty Supplements Market, By Application, 2018 - 2030 (USD Million)
- Table 157 Saudi Arabia Women's Health and Beauty Supplements Market, By Age Group, 2018 - 2030 (USD Million)
- Table 158 Saudi Arabia Women's Health and Beauty Supplements Market, By Consumer Group, 2018 - 2030 (USD Million)
- Table 159 Saudi Arabia Women's Health and Beauty Supplements Market, By Sales Channel, 2018 - 2030 (USD Million)
- Table 160 UAE Women's Health and Beauty Supplements Market, By Product, 2018 - 2030 (USD Million)
- Table 161 UAE Women's Health and Beauty Supplements Market, By Application, 2018 - 2030 (USD Million)
- Table 162 UAE Women's Health and Beauty Supplements Market, By Age Group, 2018 - 2030 (USD Million)
- Table 163 UAE Women's Health and Beauty Supplements Market, By Consumer Group, 2018 - 2030 (USD Million)
- Table 164 UAE Women's Health and Beauty Supplements Market, By Sales Channel, 2018 - 2030 (USD Million)
- Table 165 Kuwait Women's Health and Beauty Supplements Market, By Product, 2018 - 2030 (USD Million)
- Table 166 Kuwait Women's Health and Beauty Supplements Market, By Application, 2018 - 2030 (USD Million)
- Table 167 Kuwait Women's Health and Beauty Supplements Market, By Age Group, 2018 - 2030 (USD Million)
- Table 168 Kuwait Women's Health and Beauty Supplements Market, By Consumer Group, 2018 - 2030 (USD Million)
- Table 169 Kuwait Women's Health and Beauty Supplements Market, By Sales Channel, 2018 - 2030 (USD Million)
List of Figures
- Fig. 1 Women's health and beauty supplements market segmentation
- Fig. 2 Market research process
- Fig. 3 Information procurement
- Fig. 4 Primary research pattern
- Fig. 5 Market research approaches
- Fig. 6 Value-chain-based sizing & forecasting
- Fig. 7 QFD modeling for market share assessment
- Fig. 8 Market formulation & validation
- Fig. 9 Market outlook (2022)
- Fig. 10 Strategy framework
- Fig. 11 Market driver relevance analysis (Current & future impact)
- Fig. 12 Market restraint relevance analysis (Current & future impact)
- Fig. 13 Penetration & growth prospect mapping
- Fig. 14 Porter's five forces analysis
- Fig. 15 PESTLE analysis
- Fig. 16 Women's Health and Beauty Supplements market: Product movement analysis
- Fig. 17 Women's Health and Beauty Supplements market: Product segment dashboard
- Fig. 18 Women's Health and Beauty Supplements market Product outlook: Key takeaways
- Fig. 19 Vitamins market estimates and forecast, 2018 - 2030 (USD Million)
- Fig. 20 Minerals market estimates and forecast, 2018 - 2030 (USD Million)
- Fig. 21 Enzymes market estimates and forecast, 2018 - 2030 (USD Million)
- Fig. 22 Botanicals market estimates and forecast, 2018 - 2030 (USD Million)
- Fig. 23 Proteins market estimates and forecast, 2018 - 2030 (USD Million)
- Fig. 24 Omega-3 market estimates and forecast, 2018 - 2030 (USD Million)
- Fig. 25 Probiotics market estimates and forecast, 2018 - 2030 (USD Million)
- Fig. 26 Others market estimates and forecast, 2018 - 2030 (USD Million)
- Fig. 27 Women's Health and Beauty Supplements market: Application movement analysis
- Fig. 28 Women's Health and Beauty Supplements market: Application segment dashboard
- Fig. 29 Women's Health and Beauty Supplements market Application outlook: Key takeaways
- Fig. 30 Beauty market estimates and forecast, 2018 - 2030 (USD Million)
- Fig. 31 Skin care market estimates and forecast, 2018 - 2030 (USD Million)
- Fig. 32 Nail Care market estimates and forecast, 2018 - 2030 (USD Million)
- Fig. 33 Hair care market estimates and forecast, 2018 - 2030 (USD Million)
- Fig. 34 Others market estimates and forecast, 2018 - 2030 (USD Million)
- Fig. 35 Women's health market estimates and forecast, 2018 - 2030 (USD Million)
- Fig. 36 Others market estimates and forecast, 2018 - 2030 (USD Million)
- Fig. 37 Women's health and beauty supplements market: Age group movement analysis
- Fig. 38 Women's health and beauty supplements market: Age group segment dashboard
- Fig. 39 Women's health and beauty supplements market Age group outlook: Key takeaways
- Fig. 40 Age 15 - 30 market estimates and forecast, 2018 - 2030 (USD Million)
- Fig. 41 Age 31-50 market estimates and forecast, 2018 - 2030 (USD Million)
- Fig. 42 Age 51-70 market estimates and forecast, 2018 - 2030 (USD Million)
- Fig. 43 Above 70 market estimates and forecast, 2018 - 2030 (USD Million)
- Fig. 44 Women's health and beauty supplements market: Consumer group movement analysis
- Fig. 45 Women's health and beauty supplements market: Consumer group segment dashboard
- Fig. 46 Women's health and beauty supplements market Consumer group outlook: Key takeaways
- Fig. 47 Prenatal market estimates and forecast, 2018 - 2030 (USD Million)
- Fig. 48 Postnatal market estimates and forecast, 2018 - 2030 (USD Million)
- Fig. 49 PMS market estimates and forecast, 2018 - 2030 (USD Million)
- Fig. 50 Perimenopause market estimates and forecast, 2018 - 2030 (USD Million)
- Fig. 51 Postmenopause market estimates and forecast, 2018 - 2030 (USD Million)
- Fig. 52 Others market estimates and forecast, 2018 - 2030 (USD Million)
- Fig. 53 Women's health and beauty supplements market: Sales channel movement analysis
- Fig. 54 Women's health and beauty supplements market: Sales channel segment dashboard
- Fig. 55 Women's health and beauty supplements market: Sales channel outlook: Key takeaways
- Fig. 56 Online market estimates and forecast, 2018 - 2030 (USD Million)
- Fig. 57 Direct sales market estimates and forecast, 2018 - 2030 (USD Million)
- Fig. 58 Pharmacies/drug stores market estimates and forecast, 2018 - 2030 (USD Million)
- Fig. 59 Other offline channels market estimates and forecast, 2018 - 2030 (USD Million)
- Fig. 60 Regional outlook, 2022 & 2030
- Fig. 61 Regional market dashboard
- Fig. 62 Regional marketplace: Key takeaways
- Fig. 63 North America, SWOT
- Fig. 64 Europe, SWOT
- Fig. 65 Asia Pacific, SWOT
- Fig. 66 Latin America, SWOT
- Fig. 67 Middle East and Africa, SWOT
- Fig. 68 North America
- Fig. 69 North America women's health and beauty supplements market, 2018 - 2030 (USD Million)
- Fig. 70 U.S.
- Fig. 71 U.S. women's health and beauty supplements market, 2018 - 2030 (USD Million)
- Fig. 72 Canada
- Fig. 73 Canada women's health and beauty supplements market, 2018 - 2030 (USD Million)
- Fig. 74 Europe
- Fig. 75 Europe women's health and beauty supplements market, 2018 - 2030 (USD Million)
- Fig. 76 U.K.
- Fig. 77 U.K. women's health and beauty supplements market, 2018 - 2030 (USD Million)
- Fig. 78 Germany
- Fig. 79 Germany women's health and beauty supplements market, 2018 - 2030 (USD Million)
- Fig. 80 Spain
- Fig. 81 Spain women's health and beauty supplements market, 2018 - 2030 (USD Million)
- Fig. 82 France
- Fig. 83 France women's health and beauty supplements market, 2018 - 2030 (USD Million)
- Fig. 84 Italy
- Fig. 85 Italy women's health and beauty supplements market, 2018 - 2030 (USD Million)
- Fig. 86 Russia
- Fig. 87 Russia women's health and beauty supplements market, 2018 - 2030 (USD Million)
- Fig. 88 Denmark
- Fig. 89 Denmark women's health and beauty supplements market, 2018 - 2030 (USD Million)
- Fig. 90 Norway
- Fig. 91 Norway women's health and beauty supplements market, 2018 - 2030 (USD Million)
- Fig. 92 Sweden
- Fig. 93 Sweden women's health and beauty supplements market, 2018 - 2030 (USD Million)
- Fig. 94 Asia Pacific
- Fig. 95 Asia Pacific women's health and beauty supplements market, 2018 - 2030 (USD Million)
- Fig. 96 Japan
- Fig. 97 Japan women's health and beauty supplements market, 2018 - 2030 (USD Million)
- Fig. 98 China
- Fig. 99 China women's health and beauty supplements market, 2018 - 2030 (USD Million)
- Fig. 100 India
- Fig. 101 India women's health and beauty supplements market, 2018 - 2030 (USD Million)
- Fig. 102 South Korea
- Fig. 103 South Korea women's health and beauty supplements market, 2018 - 2030 (USD Million)
- Fig. 104 Australia
- Fig. 105 Australia women's health and beauty supplements market, 2018 - 2030 (USD Million)
- Fig. 106 Thailand
- Fig. 107 Thailand women's health and beauty supplements market, 2018 - 2030 (USD Million)
- Fig. 108 Taiwan
- Fig. 109 Taiwan women's health and beauty supplements market, 2018 - 2030 (USD Million)
- Fig. 110 Malaysia
- Fig. 111 Malaysia women's health and beauty supplements market, 2018 - 2030 (USD Million)
- Fig. 112 Latin America
- Fig. 113 Latin America women's health and beauty supplements market, 2018 - 2030 (USD Million)
- Fig. 114 Brazil
- Fig. 115 Brazil women's health and beauty supplements market, 2018 - 2030 (USD Million)
- Fig. 116 Mexico
- Fig. 117 Mexico women's health and beauty supplements market, 2018 - 2030 (USD Million)
- Fig. 118 Argentina
- Fig. 119 Argentina women's health and beauty supplements market, 2018 - 2030 (USD Million)
- Fig. 120 Middle East and Africa
- Fig. 121 MEA women's health and beauty supplements market, 2018 - 2030 (USD Million)
- Fig. 122 South Africa
- Fig. 123 South Africa women's health and beauty supplements market, 2018 - 2030 (USD Million)
- Fig. 124 Saudi Arabia
- Fig. 125 Saudi Arabia women's health and beauty supplements market, 2018 - 2030 (USD Million)
- Fig. 126 UAE
- Fig. 127 UAE women's health and beauty supplements market, 2018 - 2030 (USD Million)
- Fig. 128 Kuwait
- Fig. 129 Kuwait women's health and beauty supplements market, 2018 - 2030 (USD Million)
- Fig. 130 Ansoff Matrix
- Fig. 131 Heat map analysis
- Fig. 132 Market differentiators
Women's Health And Beauty Supplements Market Growth & Trends:
The global women's health and beauty supplements market size is expected to reach USD 79.29 billion by 2030, expanding at a CAGR of 5.1% during the forecast period, according to a new report by Grand View Research, Inc. The market is anticipated to witness exponential growth opportunities owing to the increasing awareness about healthy living and well-being coupled with an increase in the adoption of an active lifestyle. Moreover, the wide applications of supplements in the treatment of various disorders such as anemia, depression, arthritis, and others are propelling the demand.
Micronutrient deficiencies and nutritional inadequacies are global health issues, specifically in Middle Eastern and Latin American countries. Prominent deficits in iron, folate and vitamin D noted among pregnant women and women of childbearing age are driving the demand for women's health supplements over the past few years. For instance, the recent research findings of Purdue University show that most women have vitamin and other micronutrients deficiency.
Moreover, the increasing trend of veganism across the globe is anticipated to benefit the demand for herbal supplements over the forecast period. People especially women are shifting their preference toward herbal supplements owing to their long-term benefits and lesser side effects. This trend is facilitating market players to launch herbal remedies. For instance, in October 2022 Pharmactive Biotech Products, S.L.U. launched damiana to enhance sexual function both in women and men. In addition, in December 202 1, Nutrilite launched its first range of supplements designed for millennial women. This newly launched product is the right blend of herbal extracts, vitamins, and minerals.
Furthermore, various organic and inorganic growth strategies undertaken by leading market players are projected to offer lucrative growth opportunities for the market. For instance, in August 202 2, The Honest Company launched four new women's wellness products at GNC. These newly launched products are for mood balance, immune support, sleep health, and postnatal health wellness. In addition, in March 2022 , Laboratoire PYC launched two vegan gummy beauty and immune health supplements. The launch was made to cater to the rising demand for nutritional support that offers good taste with added medical benefits.
Women's Health And Beauty Supplements Market Report Highlights:
- The vitamins segment held the largest revenue share in 20223, owing to high demand for vitamins, increasing adoption of healthy lifestyles, and surging trend of preventive healthcare
- The enzymes segment is anticipated to register the fastest CAGR during the forecast period, due to the rising adoption of enzyme-based products and growing awareness among women regarding the benefits associated with enzymatic supplements
- The women's health segment accounted for the largest market in 2022 due to the robust availability of a number of supplements for different conditions such as digestive health, immune health, and joint health, and the presence of a higher consumer pool
- Based on age group, the age 31-50 segment dominated the market in 2022, whereas the above 70 age segment is anticipated to be the fastest growing over the forecast period
- Based on sales channel, the direct sales channel segment held the largest revenue share in 2022. However, the online segment is projected to grow at a lucrative CAGR during the forecast period
- Middle East and Africa is expected to exhibit the fastest CAGR over the forecast period due to increasing awareness about health and well-being along with nutritional deficiencies
Table of Contents
Chapter 1 Methodology and Scope
- 1.1 Market Segmentation and Scope
- 1.2 Research Methodology
- 1.3 Estimates and Forecast Timeline
- 1.4 Research Methodology
- 1.4.1 Information Procurement
- 1.4.2 Purchased Database
- 1.4.3 Gvr's Internal Database
- 1.4.4 Secondary Sources
- 1.4.5 Primary Research:
- 1.5 Information Or Data Analysis
- 1.5.1 Market Formulation & Validation
- 1.5.2 Data Analysis Models
- 1.6 Market Formulation & Validation
- 1.6.1 Women's Health And Beauty Supplements Market: Cagr Calculation
- 1.6.2 Segment Share Calculation
- 1.7 Research Scope And Assumptions
- 1.7.1 Methodology
- 1.7.1.1 Bottom-Up Approach
- 1.7.1.2 Market Estimation And Forecast Factors
- 1.7.1 Methodology
- 1.8 List Of Data Sources
Chapter 2 Executive Summary
- 2.1 Market Outlook
- 2.2 Segment Outlook
- 2.3 Competitive Insights
- 2.4 Women's Health And Beauty Supplements Market Snapshot
- 2.5 Competitive Landscape Snapshot
Chapter 3 Women's Health And Beauty Supplements Market Variables, Trends & Scope
- 3.1 Penetration And Growth Prospect Mapping
- 3.2 Market Dynamics
- 3.2.1 Market Driver Analysis
- 3.2.1.1 Rising Health Consciousness And Consumer Interest In Active Living
- 3.2.1.2 Increasing Disposable Income
- 3.2.1.3 Emergence Of Online Platforms For Women's Dietary And Beauty Supplements
- 3.2.1.4 Increasing Prevalence Of Micronutrient Deficiencies Among Pregnant Women
- 3.2.1.5 Increasing Women's Awareness About The Benefits Of Dietary Supplements And Women's Empowerment
- 3.2.2 Market Restraint Analysis
- 3.2.2.1 Presence Of Counterfeit Products
- 3.2.3 Industry Challenges
- 3.2.3.1 Changes In The Regulatory Scenario
- 3.2.1 Market Driver Analysis
- 3.3 Women's Health And Beauty Supplements Market Analysis Tools
- 3.3.1 Industry Analysis: Porter's
- 3.3.1.1 Bargaining Power Of Suppliers - Low
- 3.3.1.2 Bargaining Power Of The Buyers - High
- 3.3.1.3 Threat Of Substitution - Moderate
- 3.3.1.4 Threat Of New Entrants - Moderately Low
- 3.3.1.5 Competitive Rivalry - High
- 3.3.2 Pestel Analysis
- 3.3.2.1 Political And Legal Landscape
- 3.3.2.2 Economic and Social Landscape
- 3.3.2.3 Environment and Technology Landscape
- 3.3.1 Industry Analysis: Porter's
- 3.4 Impact of COVID-19 on Women's Health and Beauty Supplements Market
Chapter 4 Women's Health and Beauty Supplements Market: Competitive Landscape Analysis
- 4.1 Recent Developments & Impact Analysis, By Key Market Participants
- 4.2 Company/Competition Categorization (Key Innovators, Market Leaders, Emerging Players)
- 4.3 Company Market Position Analysis
Chapter 5 Women's Health and Beauty Supplements Market: Product Estimates & Trend Analysis
- 5.1 Women's Health and Beauty Supplements Market: Product Movement Analysis, 2022 & 2030 ( USD Billion)
- 5.2 Vitamins
- 5.2.1 Vitamins Market Estimates And Forecasts, 2018 - 2030 (USD Billion)
- 5.3 Minerals
- 5.3.1 Minerals Market Estimates And Forecasts, 2018 - 2030 (USD Billion)
- 5.4 Enzymes
- 5.4.1 Enzymes Market Estimates And Forecasts, 2018 - 2030 (USD Billion)
- 5.5 Botanicals
- 5.5.1 Botanicals Market Estimates And Forecasts, 2018 - 2030 (USD Billion)
- 5.6 Proteins
- 5.6.1 Proteins Market Estimates And Forecasts, 2018 - 2030 (USD Billion)
- 5.7 Omega-3
- 5.7.1 Omega-3 Market Estimates And Forecasts, 2018 - 2030 (USD Billion)
- 5.8 Probiotics
- 5.8.1 Probiotics Market Estimates And Forecasts, 2018 - 2030 (USD Billion)
- 5.9 Others
- 5.9.1 Other Products Market Estimates And Forecasts, 2018 - 2030 (USD Billion)
Chapter 6 Women's Health And Beauty Supplements Market: Application Estimates & Trend Analysis
- 6.1 Women's Health And Beauty Supplements Market: Application Movement Analysis, 2022 & 2030 ( USD Billion)
- 6.2 Beauty
- 6.2.1 Beauty Supplements Market Estimates And Forecasts, 2018 - 2030 (USD Billion)
- 6.2.2 Skin Care
- 6.2.2.1 Skin Care Market Estimates And Forecasts, 2018 - 2030 (USD Billion)
- 6.2.3 Nail Care
- 6.2.3.1 Nail Care Market Estimates And Forecasts, 2018 - 2030 (USD Billion)
- 6.2.4 Hair Care
- 6.2.4.1 Hair Care Market Estimates And Forecasts, 2018 - 2030 (USD Billion)
- 6.2.5 Others
- 6.2.5.1 Others Market Estimates And Forecasts, 2018 - 2030 (USD Billion)
- 6.3 Women's Health
- 6.3.1 Women's Health Market Estimates And Forecasts, 2018 - 2030 (USD Billion)
Chapter 7 Women's Health And Beauty Supplements Market: Age Group Estimates & Trend Analysis
- 7.1 Women's Health And Beauty Supplements Market: Age Group Movement Analysis, 2022 & 2030 ( USD Billion)
- 7.2 Age 15-30
- 7.2.1 Women's Health And Beauty Supplements Market Estimates And Forecasts For Age 15-30, 2018 - 2030 (USD Billion)
- 7.3 Age 31-50
- 7.3.1 Women's Health And Beauty Supplements Market Estimates And Forecasts For Age 31-50, 2018 - 2030 (USD Billion)
- 7.4 Age 51-70
- 7.4.1 Women's Health And Beauty Supplements Market Estimates And Forecasts For Age 51-70, 2018 - 2030 (USD Billion)
- 7.5 Above Age 70
- 7.5.1 Women's Health And Beauty Supplements Market Estimates And Forecasts For Above Age 70, 2018 - 2030 (USD Billion)
Chapter 8 Women's Health and Beauty Supplements Market: Consumer Group Estimates & Trend Analysis
- 8.1 Women's Health And Beauty Supplements Market: Consumer Group Movement Analysis, 2022 & 2030 ( USD Billion)
- 8.2 Prenatal
- 8.2.1 Prenatal Market Estimates And Forecasts, 2018 - 2030 (USD Billion)
- 8.3 Postnatal
- 8.3.1 Postnatal Market Estimates And Forecasts, 2018 - 2030 (USD Billion)
- 8.4 Premenstrual Syndrome (Pms)
- 8.4.1 Pms Market Estimates And Forecasts, 2018 - 2030 (USD Billion)
- 8.5 Perimenopause
- 8.5.1 Perimenopause Market Estimates And Forecasts, 2018 - 2030 (USD Billion)
- 8.6 Postmenopause
- 8.6.1 Postmenopause Market Estimates And Forecasts, 2018 - 2030 (USD Billion)
- 8.7 Others
- 8.7.1 Other Consumer Group Market Estimates And Forecasts, 2018 - 2030 (USD Billion)
Chapter 9 Women's Health And Beauty Supplements Market: Sales Channel Estimates & Trend Analysis
- 9.1 Women's Health And Beauty Supplements Market: Sales Channel Movement Analysis, 2022 & 2030 ( USD Billion)
- 9.2 Online Sales Channel
- 9.2.1 Online Sales Channel Market Estimates And Forecasts, 2018 - 2030 (USD Billion)
- 9.3 Direct Sales Channel
- 9.3.1 Direct Sales Channel Market Estimates And Forecasts, 2018 - 2030 (USD Billion)
- 9.4 Pharmacies/Drug Stores
- 9.4.1 Pharmacies/Drug Stores Market Estimates And Forecasts, 2018 - 2030 (USD Billion)
- 9.5 Other Offline Channels
- 9.5.1 Other Offline Channels Market Estimates And Forecasts, 2018 - 2030 (USD Billion)
Chapter 10 Women's Health and Beauty Supplements Market: Regional Estimates and Trend Analysis, by Product, Application, Age Group, Consumer Group, & Sales Channel
- 10.1 North America
- 10.1.1 Swot Analysis
- 10.1.2 North America Women's Health And Beauty Supplements Market Estimates And Forecasts, 2018 - 2030 (USD Billion)
- 10.1.3 U.S.
- 10.1.3.1 Regulatory Framework
- 10.1.3.2 U.S. Women's Health And Beauty Supplements Market Estimates And Forecasts, 2018 - 2030 (USD Billion)
- 10.1.4 Canada
- 10.1.4.1 Regulatory Framework
- 10.1.4.2 Canada Women's Health And Beauty Supplements Market Estimates And Forecasts, 2018 - 2030 (USD Billion)
- 10.2 Europe
- 10.2.1 Swot Analysis
- 10.2.1.1 Regulatory Framework
- 10.2.2 Europe Women's Health And Beauty Supplements Market Estimates And Forecasts, 2018 - 2030 (USD Billion)
- 10.2.3 U.K.
- 10.2.3.1 Regulatory Framework
- 10.2.3.2 U.K. Women's Health And Beauty Supplements Market Estimates And Forecasts, 2018 - 2030 (USD Billion)
- 10.2.4 Germany
- 10.2.4.1 Regulatory Framework
- 10.2.4.2 Germany Women's Health And Beauty Supplements Market Estimates And Forecasts, 2018 - 2030 (USD Billion)
- 10.2.5 France
- 10.2.5.1 Regulatory Framework
- 10.2.5.2 France Women's Health And Beauty Supplements Market Estimates And Forecasts, 2018 - 2030 (USD Billion)
- 10.2.6 Spain
- 10.2.6.1 Regulatory Framework
- 10.2.6.2 Spain Women's Health And Beauty Supplements Market Estimates And Forecasts, 2018 - 2030 (USD Billion)
- 10.2.7 Italy
- 10.2.7.1 Regulatory Framework
- 10.2.7.2 Italy Women's Health And Beauty Supplements Market Estimates And Forecasts, 2018 - 2030 (USD Billion)
- 10.2.8 Russia
- 10.2.8.1 Regulatory Framework
- 10.2.8.2 Russia Women's Health And Beauty Supplements Market Estimates And Forecasts, 2018 - 2030 (USD Billion)
- 10.2.9 Denmark
- 10.2.9.1 Regulatory Framework
- 10.2.9.2 Denmark Women's Health And Beauty Supplements Market Estimates And Forecasts, 2018 - 2030 (USD Billion)
- 10.2.10 Norway
- 10.2.10.1 Regulatory Framework
- 10.2.10.2 Norway Women's Health And Beauty Supplements Market Estimates And Forecasts, 2018 - 2030 (USD Billion)
- 10.2.11 Sweden
- 10.2.11.1 Regulatory Framework
- 10.2.11.2 Sweden women's health and beauty supplements market estimates and forecasts, 2018 - 2030 (USD Billion)
- 10.2.1 Swot Analysis
- 10.3 Asia Pacific
- 10.3.1 Swot Analysis
- 10.3.2 Asia Pacific Women's Health And Beauty Supplements Market Estimates And Forecasts, 2018 - 2030 (USD Billion)
- 10.3.3 Japan
- 10.3.3.1 Regulatory Framework
- 10.3.3.2 Japan Women's Health And Beauty Supplements Market Estimates And Forecasts, 2018 - 2030 (USD Billion)
- 10.3.4 China
- 10.3.4.1 Regulatory Framework
- 10.3.4.2 China Women's Health And Beauty Supplements Market Estimates And Forecasts, 2018 - 2030 (USD Billion)
- 10.3.5 India
- 10.3.5.1 Regulatory Framework
- 10.3.5.2 India Women's Health And Beauty Supplements Market Estimates And Forecasts, 2018 - 2030 (USD Billion)
- 10.3.6 Australia
- 10.3.6.1 Regulatory Framework
- 10.3.6.2 Australia Women's Health And Beauty Supplements Market Estimates And Forecasts, 2018 - 2030 (USD Billion)
- 10.3.7 South Korea
- 10.3.7.1 Regulatory Framework
- 10.3.7.2 South Korea Women's Health And Beauty Supplements Market Estimates And Forecasts, 2018 - 2030 (USD Billion)
- 10.3.8 Taiwan
- 10.3.8.1 Regulatory Framework
- 10.3.8.2 Taiwan Women's Health And Beauty Supplements Market Estimates And Forecasts, 2018 - 2030 (USD Billion)
- 10.3.9 Malaysia
- 10.3.9.1 Regulatory Framework
- 10.3.9.2 Malaysia Women's Health And Beauty Supplements Market Estimates And Forecasts, 2018 - 2030 (USD Billion)
- 10.3.10 Thailand
- 10.3.10.1 Regulatory Framework
- 10.3.10.2 Thailand Women's Health And Beauty Supplements Market Estimates And Forecasts, 2018 - 2030 (USD Billion)
- 10.4 Latin America
- 10.4.1 Swot Analysis
- 10.4.1.1 Regulatory Framework
- 10.4.2 Latin America Women's Health And Beauty Supplements Market Estimates And Forecasts, 2018 - 2030 (USD Billion)
- 10.4.3 Brazil
- 10.4.3.1 Regulatory Framework
- 10.4.3.2 Brazil Women's Health And Beauty Supplements Market Estimates And Forecasts, 2018 - 2030 (USD Billion)
- 10.4.4 Mexico
- 10.4.4.1 Regulatory Framework
- 10.4.4.2 Mexico Women's Health And Beauty Supplements Market Estimates And Forecasts, 2018 - 2030 (USD Billion)
- 10.4.5 Argentina
- 10.4.5.1 Regulatory Framework
- 10.4.5.2 Argentina women's health and beauty supplements market estimates and forecasts, 2018 - 2030 (USD Billion)
- 10.4.1 Swot Analysis
- 10.5 MEA
- 10.5.1 Swot Analysis
- 10.5.2 MEA Women's Health And Beauty Supplements Market Estimates And Forecasts, 2018 - 2030 (USD Billion)
- 10.5.3 South Africa
- 10.5.3.1 Regulatory Framework
- 10.5.3.2 South Africa Women's Health And Beauty Supplements Market Estimates And Forecasts, 2018 - 2030 (USD Billion)
- 10.5.4 Saudi Arabia
- 10.5.4.1 Regulatory Framework
- 10.5.4.2 Saudi Arabia Women's Health And Beauty Supplements Market Estimates And Forecasts, 2018 - 2030 (USD Billion)
- 10.5.5 Uae
- 10.5.5.1 Regulatory Framework
- 10.5.5.2 Uae Women's Health And Beauty Supplements Market Estimates And Forecasts, 2018 - 2030 (USD Billion)
- 10.5.6 KUWAIT
- 10.5.6.1 Regulatory Framework
- 10.5.6.2 Kuwait women's health and beauty supplements market estimates and forecasts, 2018 - 2030 (USD Billion)
Chapter 11 Competitive Landscape
- 11.1 Participant's Overview
- 11.2 Financial Performance
- 11.3 Strategy Mapping
- 11.3.1 Expansion
- 11.3.2 Acquisition
- 11.3.3 Product/Service Launch
- 11.3.4 Partnerships
- 11.3.5 Others
- 11.4 Company Profile
- 11.4.1 Herbalife International of America, Inc.
- 11.4.2 GNC Holdings, Inc
- 11.4.3 Nature's Bounty
- 11.4.4 Bayer AG
- 11.4.5 Suntory Holdings Limited
- 11.4.6 Taisho Pharmaceutical Co., Ltd
- 11.4.7 Pharmavite LLC
- 11.4.8 Pfizer, Inc
- 11.4.9 Blackmores
- 11.4.10 FANCL Corporation
- 11.4.11 Asahi Group Holdings, Ltd
- 11.4.12 USANA Health Sciences, Inc.
- 11.4.13 Nu Skin Enterprise, Inc.
- 11.4.14 BY-HEALTH Co., Ltd.
- 11.4.15 Revital Ltd
- 11.4.16 The Himalaya Drug Company
- 11.4.17 Vita Life Sciences
- 11.4.18 Standard Foods Corporation
- 11.4.19 garden of life (Nestle)