|
|
市場調査レポート
商品コード
1301256
セットトップボックスの市場規模、シェア、動向分析レポート:製品別、コンテンツ品質別、流通チャネル別、用途別、オペレーティングシステム別、地域別、セグメント予測、2023年~2030年Set Top Box Market Size, Share & Trends Analysis Report By Product (IPTV, OTT), By Content Quality (HD & Full HD, 4K & Above), By Distribution Channel, By Application, By Operating System, By Region, And Segment Forecasts, 2023 - 2030 |
||||||
|
|
|||||||
|
● お客様のご希望に応じて、既存データの加工や未掲載情報(例:国別セグメント)の追加などの対応が可能です。 詳細はお問い合わせください。 |
|||||||


| セットトップボックスの市場規模、シェア、動向分析レポート:製品別、コンテンツ品質別、流通チャネル別、用途別、オペレーティングシステム別、地域別、セグメント予測、2023年~2030年 |
|
出版日: 2023年06月14日
発行: Grand View Research
ページ情報: 英文 164 Pages
納期: 2~10営業日
|
- 全表示
- 概要
- 図表
- 目次
セットトップボックス市場の成長と動向
GrandView Research, Inc.の最新レポートによると、世界のセットトップボックス市場規模は2023年から2030年にかけてCAGR 3.0%で拡大し、2030年には305億2,000万米ドルに達すると予測されています。
この成長は、世界中でスマートTVや高精細(HD)チャンネルに対する消費者の傾向が強まっていることに起因しています。現在、複数の放送事業者がサブスクリプション・パッケージなど様々な付加価値サービスを提供しており、これがセットトップボックス(STB)の需要を牽引しています。
いくつかの新興諸国におけるテレビ放送のデジタル化に向けた政府の取り組みは、セットトップボックス市場の見通しを高める上で重要な役割を果たしています。2022年、中国国家ラジオ・テレビ総局は、2023年末までに地方のテレビ局全体でHDと超高精細度(UHD)および放送機能の開発を促進することを目的とした文書を発行しました。
セットトップボックス市場は、デジタルビデオ録画、より良い画質・音質、ストレージオプションを通じて、より充実したテレビ体験を提供しようとする業界各社の継続的な取り組みにより、近年製品需要が大幅に増加しています。そのため、ケーブル・サービス・プロバイダー、通信会社、デジタル衛星放送プロバイダーが積極的に販売促進に取り組んでおり、セットトップボックスの設置が増加しています。
セットトップボックス市場の成長は、市場各社による継続的な技術開拓と新製品の発売によって大きく促進されています。2022年には、著名な通信プロバイダーであるZTE CorporationがAmlogicと共同でZTE 8Kセットトップボックスを発売しました。最新の8Kセットトップボックスは、没入感のある4K UIと強化された超HDビデオ品質を提供し、視聴者に優れたオーディオビジュアル体験を提供します。また、強力なAIコンピューティング機能を搭載しており、デジタルミュージアム、デジタルシアター、デジタルツアーなどの3Dデジタルサービスをテレビで楽しむことができます。
COVID-19パンデミックの発生はセットトップボックス市場に深刻な影響を与えたが、OTT視聴者の増加と魅力的なメディア・コンテンツへの嗜好の高まりが市場の回復と緩やかな成長を支えました。OTTプラットフォームの人気の高まりに伴い、アンドロイドとハイブリッドのセットトップボックスの採用が増加しており、市場に大きな成長機会をもたらしています。OTTセットトップボックスは、無料ビデオコンテンツの豊富な利用可能性を背景に、新興市場の有料テレビ放送シナリオ全体で大規模な牽引力を獲得しています。また、NetflixやAmazonなど複数の主要OTTプラットフォームが高品質の4Kコンテンツを提供しており、セットトップボックスの需要を牽引しています。
セットトップボックス市場レポートハイライト
- 製品別では、OTT分野が2023年から2030年にかけて顕著なCAGRを記録すると推定されます。これは、技術の進歩により放送局が音質と高解像度の画質を改善できるようになったためです。
- 配信チャネルでは、オンライン・セグメントが予測期間中に大幅な成長率を記録すると予測されます。
- コンテンツ品質の面では、高解像度コンテンツと鮮明な画質に対する需要の増加により、4K以上のセグメントが2030年までに大きな収益シェアを獲得すると予想されます。複数の市場企業が競争力を高めるために4K UHDセットトップボックスを投入しています。
- オペレーティング・システムでは、アンドロイド・セグメントが2023年から2030年にかけて顕著な成長率を示すと推定されます。これは、アンドロイドベースのセットトップボックスでアプリケーションをダウンロードして実行できるOTTや動画共有プラットフォームの動向に起因しています。
- アプリケーション別では、一般家庭へのテレビの普及が進んでいることから、住宅用セグメントが予測期間中に大きなCAGRを記録する見込みです。
- 北米のセットトップボックス市場は、同地域の規制環境が良好であることから、予測期間中に大きな成長率を記録すると予想されます。米連邦通信委員会(FCC)などの政府当局は、セットトップボックスの設置やコンテンツ制作に関する基準を定めています。
- Netflix、Amazon Prime、Huluなどの主要OTTプラットフォームをサポートするセットトップボックスを導入する市場参入企業は少なく、市場での地位強化に努めています。
内容ができる
第1章 調査手法と範囲
- 市場セグメンテーションと範囲
- 市場の定義
- 情報調達
- 購入したデータベース
- GVRの内部データベース
- 二次情報と第三者の視点
- 1次調査
- 情報分析
- データ分析モデル
- 市場の形成とデータの視覚化
- データの検証と公開
第2章 エグゼクティブサマリー
- 市場スナップショット
- セグメントのスナップショット
- 競合情勢
第3章 業界の展望
- 市場系統の見通し
- 業界のバリューチェーン分析
- 市場力学
- 市場促進要因分析
- 市場抑制要因分析
- 市場の課題
- 市場機会
- 業界分析ツール
- ポーターの分析
- マクロ経済分析
- セットトップボックス市場:概要
- 技術動向
- 技術ロードマップ
- セットトップボックス市場ベンダー情勢
- ベンダー上位10社のセットトップボックス出荷数、2022年
- セットトップボックス市場の規制状況
- セットトップボックス市場-COVID-19症の影響分析
第4章 セットトップボックス市場:製品推定・動向分析
- 製品変動分析と市場シェア、2022年と2030年
- 製品別
- IPTV
- 衛星
- ケーブル
- DTT
- オット
第5章 セットトップボックス市場:コンテンツ品質の推定・動向分析
- コンテンツ品質変動分析と市場シェア、2022年と2030年
- コンテンツの品質別
- HDおよびフルHD
- 4K以上
第6章 セットトップボックス市場:流通チャネルの推定・動向分析
- 流通チャネルの変動分析と市場シェア、2022年と2030年
- 流通チャネル別
- オフライン
- オンライン
第7章 セットトップボックス市場:用途チャネルの推定・動向分析
- 用途の変動分析と市場シェア、2022年と2030年
- 用途別
- 住宅
- 商業
第8章 セットトップボックス市場:オペレーティングシステムの推定・動向分析
- オペレーティングシステムの変動分析と市場シェア、2022年と2030年
- オペレーティングシステム別
- Android
- Linux
- その他
第9章 セットトップボックス市場:地域推定・動向分析
- セットトップボックス市場:地域別の見通し
- 北米
- 北米のセットトップボックス市場の推定と予測、2018~2030年
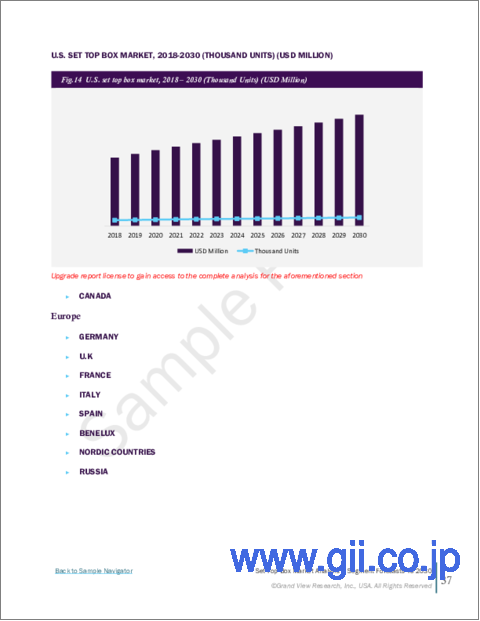
- 米国
- 米国のセットトップボックス市場の推定と予測、2018~2030年
- カナダ
- カナダのセットトップボックス市場の推定と予測、2018~2030年
- 欧州
- 欧州のセットトップボックス市場の推定と予測、2018~2030年
- 英国
- 英国のセットトップボックス市場の推定と予測、2018~2030年
- ドイツ
- ドイツのセットトップボックス市場の推定と予測、2018~2030年
- フランス
- フランスのセットトップボックス市場の推定と予測、2018~2030年
- イタリア
- イタリアのセットトップボックス市場の推定と予測、2018年から2030年
- スペイン
- スペインのセットトップボックス市場の推定と予測、2018年から2030年
- ベネルクス三国
- ベネルクスセットトップボックス市場の推定と予測、2018~2030年
- 北欧諸国
- 北欧諸国のセットトップボックス市場の推定と予測、2018~2030年
- ロシア
- ロシアのセットトップボックス市場の推定と予測、2018年から2030年
- アジア太平洋地域
- アジア太平洋地域のセットトップボックス市場の推定と予測、2018~2030年
- 中国
- 中国のセットトップボックス市場の推定と予測、2018~2030年
- インド
- インドのセットトップボックス市場の推定と予測、2018~2030年
- 日本
- 日本のセットトップボックス市場の推定と予測、2018~2030年
- 韓国
- 韓国のセットトップボックス市場の推定と予測、2018~2030年
- オーストラリア
- オーストラリアのセットトップボックス市場の推定と予測、2018~2030年
- インドネシア
- インドネシアのセットトップボックス市場の推定と予測、2018年から2030年
- タイ
- タイのセットトップボックス市場の推定と予測、2018~2030年
- ラテンアメリカ
- ラテンアメリカのセットトップボックス市場の推定と予測、2018~2030年
- メキシコ
- メキシコのセットトップボックス市場の推定と予測、2018年から2030年
- ブラジル
- ブラジルのセットトップボックス市場の推定と予測、2018年から2030年
- アルゼンチン
- アルゼンチンのセットトップボックス市場の推定と予測、2018~2030年
- 中東およびアフリカ(MEA)
- MEAセットトップボックス市場の推定と予測、2018~2030年
- サウジアラビア
- サウジアラビアのセットトップボックス市場の推定と予測、2018~2030年
- アラブ首長国連邦
- アラブ首長国連邦セットトップボックス市場の推定と予測、2018~2030年
- エジプト
- エジプトのセットトップボックス市場の推定と予測、2018年から2030年
- 南アフリカ
- 南アフリカのセットトップボックス市場の推定と予測、2018年から2030年
- ナイジェリア
- ナイジェリアのセットトップボックス市場の推定と予測、2018~2030年
第10章 競合情勢
- 主な参加者
- Advance Digital Broadcast(ADB)
- Commscope(ARRIS International, plc)
- Coship Electronics Co.Ltd.
- Echostar Corporation
- Huawei Technologies Co., Ltd
- KaonMedia
- Sagemcom SAS
- Samsung Electronics Co. Ltd.
- Technicolor SA
- LG CNS Co., Ltd
- 主要市場参入企業による最近の展開と影響
- 企業の分類
- 参入企業の概要
- 財務実績
- 製品のベンチマーク
- 企業ヒートマップ分析
- 企業の市場シェア分析、2022年
- 戦略マッピング
- 拡張
- 合併と買収
- コラボレーション
- 新製品の発売
- 研究開発
List of Tables
- Table 1 Set Top Box Market Revenue Estimates and Forecast, By Product, 2018 - 2030 (USD Million)
- Table 2 Set Top Box Market Revenue Estimates and Forecast, By Content Quality, 2018 - 2030 (USD Million)
- Table 3 Set Top Box Market Revenue Estimates and Forecast, By Distribution Channel, 2018 - 2030 (USD Million)
- Table 4 Set Top Box Market Revenue Estimates and Forecast, By Application, 2018 - 2030 (USD Million)
- Table 5 Set Top Box Market Revenue Estimates and Forecast, By Operating System, 2018 - 2030 (USD Million)
- Table 6 Recent Developments & Impact Analysis, By Key Market Participants
- Table 7 Key company categorization
- Table 8 Company Heat Map Analysis
- Table 9 Key companies undergoing expansions
- Table 10 Key companies involved in mergers and acquisitions
- Table 11 Key companies undergoing collaborations
- Table 12 Key companies launching new products
- Table 13 Key Companies undertaking R&D activities
List of Figures
- Fig. 1 Set Top Box Market Segmentation
- Fig. 2 Information Procurement
- Fig. 3 Data Analysis Models
- Fig. 4 Market Formulation and Validation
- Fig. 5 Data Validating & Publishing
- Fig. 6 Market Snapshot
- Fig. 7 Segment Snapshot
- Fig. 8 Competitive Landscape Snapshot
- Fig. 9 Set Top Box Market Segmentation Market Value, 2022 (USD Million, Thousand Units)
- Fig. 10 Set Top Box Market Segmentation- Industry Value Chain Analysis
- Fig. 11 Set Top Box Market Segmentation Market Dynamics
- Fig. 12 Key Market Driver Impact
- Fig. 13 Key Market Restraint Impact
- Fig. 14 Set Top Box Market: PORTER's Five Forces Analysis
- Fig. 15 Set Top Box Market: Macroeconomic Analysis
- Fig. 16 Set Top Box Market, by Product, Key Takeaways
- Fig. 17 Product movement analysis & market share, 2022 & 2030 (USD Million, Thousand Units)
- Fig. 18 Set Top Box Market, by Content Quality, Key Takeaways
- Fig. 19 Content Quality movement analysis & market share, 2022 & 2030 (USD Million, Thousand Units)
- Fig. 20 Set Top Box Market, by Distribution Channel, Key Takeaways
- Fig. 21 Distribution Channel movement analysis & market share, 2022 & 2030 (USD Million, Thousand Units)
- Fig. 22 Set Top Box Market, by Application, Key Takeaways
- Fig. 23 Application movement analysis & market share, 2022 & 2030 (USD Million, Thousand Units)
- Fig. 24 Set Top Box Market, by Operating System, Key Takeaways
- Fig. 25 Operating System movement analysis & market share, 2022 & 2030 (USD Million, Thousand Units)
- Fig. 26 Regional market size estimates & forecasts, 2022 & 2030 (USD Million, Thousand Units)
- Fig. 27 Regional movement analysis & market share, 2022 & 2030 (USD Million, Thousand Units)
- Fig. 28 Key Company Categorization
- Fig. 29 Company Market Share Analysis, 2022
- Fig. 30 Strategic framework
Set Top Box Market Growth & Trends
The global set top box market size is expected to reach USD 30.52 billion by 2030, expanding at a CAGR of 3.0% from 2023 to 2030, according to a new report by Grand View Research, Inc. This growth can be attributed to increasing consumer inclination toward smart TVs and High Definition (HD) channels across the globe. Several broadcasters are now offering various value-added services, such as subscription packages, that are driving the demand for Set Top Boxes (STB).
Government initiatives toward digitization of TV broadcasting across several developing countries is playing a key role in enhancing the set top box market outlook. In 2022, the National Radio and Television Administration of China issued a document aimed at expediting the development of HD and Ultra-high Definition (UHD) and broadcasting capabilities across provincial TV stations by the end of 2023.
The set top box market witnessed a drastic rise in product demand in recent years owing to the ongoing initiatives by industry players to deliver enhanced television experience through digital video recording, better picture & sound quality, and storage options. Therefore, cable service providers, telecommunication companies, and digital satellite providers are actively involved in the promotion, resulting in increased installation of set top boxes.
The growth of set top box market is being significantly proliferated by the ongoing technological developments and new product launches by the market layers. In 2022, a prominent telecommunications provider ZTE Corporation launched the ZTE 8K set-top box in collaboration with Amlogic. The latest 8K set top box provides immersive 4K UI and enhanced ultra-HD video quality, offering excellent audiovisual experience to the audience. It also has powerful AI computing capabilities that facilitate 3D digital services such as digital museum, digital theatre, and digital tours on the TV.
The outbreak of the COVID-19 pandemic made a serious impact on the set top box market, however, increasing OTT viewership and growing preference for engaging media content has helped the market recover and grow gradually. The rising adoption of Android and hybrid set top boxes in line with the growing popularity of OTT platforms is creating considerable growth opportunities for the market. OTT set top boxes are gaining massive traction across the Pay-TV broadcasting scenario in the emerging markets with abundant availability of free video content. Besides, several major OTT platforms, such as Netflix and Amazon, have been offering high-quality 4K content, driving the demand for set top boxes.
Set Top Box Market Report Highlights
- In terms of product, the OTT segment is estimated to record a notable CAGR from 2023 to 2030 owing to advances in technology allowing broadcasters to deliver improved sound quality and high-resolution picture quality
- In terms of distribution channel, the online segment is estimated to record a substantial growth rate over the forecast period with increasing consumer preference for ecommerce platforms as they offer greater convenience, offers, and attractive discounts
- In terms of content quality, 4K and above segment is expected to capture a sizeable revenue share by 2030 owing to increasing demand for high-resolution content and sharp picture quality. Several market players have introduced their 4K UHD set top boxes to gain a competitive edge
- In terms of operating system, the android segment is estimated to expand at a notable rate from 2023 to 2030. This can be attributed to the trend of OTT and video sharing platforms whose applications can be downloaded and run on Android-based set top boxes
- In terms of application, the residential segment is expected to record a significant CAGR over the forecast period owing to increased penetration of television sets in residential homes
- North America set top box market is expected to record significant growth rate over the forecast period due to favorable regulatory environment in the region. The government authorities, such as the Federal Communications Commission (FCC) has set standards for set top box installation and content creation
- Few market players are introducing set top boxes that can support major OTT platforms, such as Netflix, Amazon Prime, and Hulu, as part of the efforts to strengthen their position in the market
able of Contents
Chapter 1. Methodology and Scope
- 1.1. Market Segmentation & Scope
- 1.2. Market Definition
- 1.3. Information Procurement
- 1.3.1. Purchased Database
- 1.3.2. GVR's Internal Database
- 1.3.3. Secondary Sources & Third-Party Perspectives
- 1.3.4. Primary Research
- 1.4. Information Analysis
- 1.4.1. Data Analysis Models
- 1.5. Market Formulation & Data Visualization
- 1.6. Data Validation & Publishing
Chapter 2. Executive Summary
- 2.1. Market Snapshot
- 2.2. Segment Snapshot
- 2.3. Competitive Landscape
Chapter 3. Industry Outlook
- 3.1. Market Lineage Outlook
- 3.2. Industry Value Chain Analysis
- 3.3. Market Dynamics
- 3.3.1. Market driver analysis
- 3.3.2. Market restraint analysis
- 3.3.3. Market challenges
- 3.3.4. Market opportunities
- 3.4. Industry Analysis Tools
- 3.4.1. Porter's Analysis
- 3.4.2. Macroeconomic Analysis
- 3.5. Set Top Box Market: Overview
- 3.5.1. Technology Trends
- 3.5.2. Technological Roadmap
- 3.6 Set-Top Box Market Vendor Landscape
- 3.7 Set Top Box Shipment for Top 10 Vendors, 2022
- 3.8 Set-Top Box Market Regulatory Landscape
- 3.9 Set Top Box Market - COVID-19 Impact Analysis
Chapter 4. Set Top Box Market: Product Estimates & Trend Analysis
- 4.1. Product Movement Analysis & Market Share, 2022 & 2030
- 4.2. Set Top Box Market Estimates & Forecast, By Product (USD Million, Thousand Units)
- 4.2.1. IPTV
- 4.2.2. Satellite
- 4.2.3. Cable
- 4.2.4. DTT
- 4.2.5. OTT
Chapter 5. Set Top Box Market: Content Quality Estimates & Trend Analysis
- 5.1. Content Quality Movement Analysis & Market Share, 2022 & 2030
- 5.2. Set Top Box Market Estimates & Forecast, By Content Quality (USD Million, Thousand Units)
- 5.2.1. HD & Full HD
- 5.2.2. 4K & Above
Chapter 6. Set Top Box Market: Distribution Channel Estimates & Trend Analysis
- 6.1. Distribution Channel Movement Analysis & Market Share, 2022 & 2030
- 6.2. Set Top Box Market Estimates & Forecast, By Distribution Channel (USD Million, Thousand Units)
- 6.2.1. Offline
- 6.2.2. Online
Chapter 7. Set Top Box Market: Application Channel Estimates & Trend Analysis
- 7.1. Application Movement Analysis & Market Share, 2022 & 2030
- 7.2. Set Top Box Market Estimates & Forecast, By Application (USD Million, Thousand Units)
- 7.2.1. Residential
- 7.2.2. Commercial
Chapter 8. Set Top Box Market: Operating System Estimates & Trend Analysis
- 8.1. Operating System Movement Analysis & Market Share, 2022 & 2030
- 8.2. Set Top Box Market Estimates & Forecast, By Operating System (USD Million, Thousand Units)
- 8.2.1. Android
- 8.2.3. Linux
- 8.2.3. Others
Chapter 9. Set Top Box Market: Regional Estimates & Trend Analysis
- 9.1. Set Top Box Market: Regional Outlook
- 9.2. North America
- 9.2.1 North America set top box market estimates & forecasts, 2018 - 2030 (USD Million, Thousand Units)
- 9.2.2 U.S.
- 9.2.3 U.S. set top box market estimates & forecasts, 2018 - 2030 (USD Million, Thousand Units)
- 9.2.4 Canada
- 9.2.5 Canada set top box market estimates & forecasts, 2018 - 2030 (USD Million, Thousand Units)
- 9.3. Europe
- 9.3.1 Europe set top box market estimates & forecasts, 2018 - 2030 (USD Million, Thousand Units)
- 9.3.2 U.K.
- 9.3.3 U.K. set top box market estimates & forecasts, 2018 - 2030 (USD Million, Thousand Units)
- 9.3.4 Germany
- 9.3.5 Germany set top box market estimates & forecasts, 2018 - 2030 (USD Million, Thousand Units)
- 9.3.6 France
- 9.3.7 France set top box market estimates & forecasts, 2018 - 2030 (USD Million, Thousand Units)
- 9.3.8 Italy
- 9.3.9 Italy set top box market estimates & forecasts, 2018 - 2030 (USD Million, Thousand Units)
- 9.3.10 Spain
- 9.3.11 Spain set top box market estimates & forecasts, 2018 - 2030 (USD Million, Thousand Units)
- 9.3.12 Benelux
- 9.3.13 Benelux set top box market estimates & forecasts, 2018 - 2030 (USD Million, Thousand Units)
- 9.3.14 Nordic Countries
- 9.3.15 Nordic Countries set top box market estimates & forecasts, 2018 - 2030 (USD Million, Thousand Units)
- 9.3.16 Russia
- 9.3.17 Russia set top box market estimates & forecasts, 2018 - 2030 (USD Million, Thousand Units)
- 9.4. Asia Pacific
- 9.4.1 Asia Pacific set top box market estimates & forecasts, 2018 - 2030 (USD Million, Thousand Units)
- 9.4.2 China
- 9.4.3 China set top box market estimates & forecasts, 2018 - 2030 (USD Million, Thousand Units)
- 9.4.4 India
- 9.4.5 India set top box market estimates & forecasts, 2018 - 2030 (USD Million, Thousand Units)
- 9.4.6 Japan
- 9.4.7 Japan set top box market estimates & forecasts, 2018 - 2030 (USD Million, Thousand Units)
- 9.4.8 South Korea
- 9.4.9 South Korea set top box market estimates & forecasts, 2018 - 2030 (USD Million, Thousand Units)
- 9.4.10 Australia
- 9.4.11 Australia set top box market estimates & forecasts, 2018 - 2030 (USD Million, Thousand Units)
- 9.4.12 Indonesia
- 9.4.13 Indonesia set top box market estimates & forecasts, 2018 - 2030 (USD Million, Thousand Units)
- 9.4.12 Thailand
- 9.4.13 Thailand set top box market estimates & forecasts, 2018 - 2030 (USD Million, Thousand Units)
- 9.5 Latin America
- 9.5.1 Latin America set top box market estimates & forecasts, 2018 - 2030 (USD Million, Thousand Units)
- 9.5.2 Mexico
- 9.5.3 Mexico set top box market estimates & forecasts, 2018 - 2030 (USD Million, Thousand Units)
- 9.5.4 Brazil
- 9.5.5 Brazil set top box market estimates & forecasts, 2018 - 2030 (USD Million, Thousand Units)
- 9.5.6 Argentina
- 9.5.7 Argentina set top box market estimates & forecasts, 2018 - 2030 (USD Million, Thousand Units)
- 9.6. Middle East & Africa (MEA)
- 9.6.1 MEA set top box market estimates & forecasts, 2018 - 2030 (USD Million, Thousand Units)
- 9.6.2 Saudi Arabia
- 9.6.3 Saudi Arabia set top box market estimates & forecasts, 2018 - 2030 (USD Million, Thousand Units)
- 9.6.4 UAE
- 9.6.5 UAE set top box market estimates & forecasts, 2018 - 2030 (USD Million, Thousand Units)
- 9.6.6 Egypt
- 9.6.7 Egypt set top box market estimates & forecasts, 2018 - 2030 (USD Million, Thousand Units)
- 9.6.8 South Africa
- 9.6.9 South Africa set top box market estimates & forecasts, 2018 - 2030 (USD Million, Thousand Units)
- 9.6.10 Nigeria
- 9.6.11 Nigeria set top box market estimates & forecasts, 2018 - 2030 (USD Million, Thousand Units)
Chapter 10. Competitive Landscape
- 10.1 Key Participants
- 10.1.1. Advance Digital Broadcast (ADB)
- 10.1.2. Commscope (ARRIS International, plc)
- 10.1.3. Coship Electronics Co.Ltd.
- 10.1.4. Echostar Corporation
- 10.1.5. Huawei Technologies Co., Ltd
- 10.1.6. KaonMedia
- 10.1.7. Sagemcom SAS
- 10.1.8. Samsung Electronics Co. Ltd.
- 10.1.9. Technicolor SA
- 10.1.10. LG CNS Co., Ltd
- 10.2 Recent Development & Impact, By Key Market Participants
- 10.3 Company Categorization
- 10.4 Participant's Overview
- 10.5 Financial Performance
- 10.6 Product Benchmarking
- 10.7 Company Heat Map Analysis
- 10.8 Company Market Share Analysis, 2022
- 10.9 Strategy Mapping
- 10.9.1 Expansion
- 10.9.2 Mergers & acquisition
- 10.9.3 Collaborations
- 10.9.4 New product launches
- 10.9.5 Research & Development