|
|
市場調査レポート
商品コード
1321346
空間ゲノミクス・空間トランスクリプトミクスの市場規模、シェア、動向分析レポート:技術別、製品別、最終用途別、地域別、セグメント予測:2023年~2030年Spatial Genomics & Transcriptomics Market Size, Share & Trends Analysis Report By Technology (Spatial Transcriptomics, Spatial Genomics), By Product (Consumables, Software), By End-use, By Region, And Segment Forecasts, 2023 - 2030 |
||||||
|
|
|||||||
|
● お客様のご希望に応じて、既存データの加工や未掲載情報(例:国別セグメント)の追加などの対応が可能です。 詳細はお問い合わせください。 |
|||||||


| 空間ゲノミクス・空間トランスクリプトミクスの市場規模、シェア、動向分析レポート:技術別、製品別、最終用途別、地域別、セグメント予測:2023年~2030年 |
|
出版日: 2023年07月06日
発行: Grand View Research
ページ情報: 英文 180 Pages
納期: 2~10営業日
|
- 全表示
- 概要
- 図表
- 目次
空間ゲノミクス・空間トランスクリプトミクス市場の成長と動向
Grand View Research社の最新レポートによると、世界の空間ゲノミクス・空間トランスクリプトミクスの市場規模は2030年までに5億7,430万米ドルに達すると予測されています。
同市場は2023年から2030年にかけてCAGR 12.2%で成長すると予測されています。市場は、がん検出法としての空間ゲノム解析の可能性の増大と最新世代のシーケンス技術の出現により、予測期間中に大幅な成長を遂げる態勢が整っています。
個人の特性に基づいてカスタマイズされた医療を提供することを目的とした個別化医療への移行により、空間ゲノミクス・空間トランスクリプトミクスの需要が高まっています。これらの技術は、患者組織内の遺伝的・分子的状況を包括的に把握し、正確な診断、予後、治療法の選択を可能にします。空間ゲノミクス・空間トランスクリプトミクスは、疾患のサブタイプに関連する特定の遺伝子発現パターンの同定を容易にし、臨床医が個別化された治療戦略について十分な情報に基づいた意思決定を行うことを可能にします。
空間ゲノミクス・空間トランスクリプトミクスの市場は、近年著しい技術的進歩を遂げています。企業は、空間ゲノミクス・空間トランスクリプトミクスにおけるプラットフォームの精度、拡張性、手頃な価格を向上させるための研究開発に投資してきました。さらに、市場では、データ分析と解釈を簡素化するユーザーフレンドリーな統合ソリューションが導入され、より幅広いユーザーベースがこれらの技術にアクセスできるようになりました。
例えば、Vizgen社は2023年4月、MERFISH技術に基づく世界初のシングルセル空間ゲノミクスプラットフォームを発表しました。この装置は、トランスクリプトームをプロファイリングするための高解像度と最大限の効率を提供します。これらの進歩は市場の可能性を拡大し、学術界と産業界の両方から投資を集めています。
空間ゲノミクス・空間トランスクリプトミクス市場レポートハイライト
- 空間トランスクリプトミクス技術セグメントは、単一細胞のトランスクリプトミクス研究において、空間ゲノミクス法と比較して高い採用率により、2022年に最大の収益シェアを占めました。
- 消耗品セグメントは、サンプル調製から結果導出まで、ゲノムマッピングのさまざまな段階において装置を稼働させるために必要な製品をカバーしているため、予測期間中に最も速いCAGRで成長する見込みです。
- トランスレーショナルリサーチセグメントは、2022年に最も高い収益シェアを占めました。トランスレーショナルリサーチにおける空間オミクス技術の使用は、生理学と疾患の状態の徹底的な分析を提供することで研究に利益をもたらす可能性があるためです。
- アジア太平洋は、中国とインドの新興経済圏に未開発の機会が存在するため、予測期間中に最も速いCAGRで成長すると予測されています。
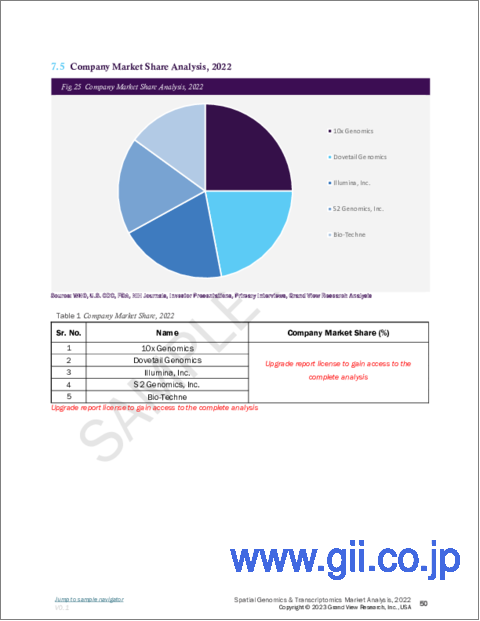
- 主な市場プレイヤーとしては、Natera Inc.、10x Genomics、Dovetail Genomics、Illumina, Inc.、S2 Genomics, Inc.などが挙げられます。
目次
第1章 調査手法と範囲
- 市場セグメンテーションと範囲
- 市場の定義
- 調査の仮定
- 情報調達
- 情報またはデータ分析
- 市場の形成と検証
- 市場モデル
- 世界市場:CAGRの計算
- 目的
第2章 エグゼクティブサマリー
第3章 市場変数、動向、および範囲
- 市場系統の見通し
- 親市場の見通し
- 関連/付随市場の見通し
- 市場力学
- 市場促進要因分析
- 市場抑制要因分析
- 業界分析ツール
- ポーターのファイブフォース分析
- PESTEL分析
- COVID-19感染症の影響分析
第4章 技術のビジネス分析
- 空間ゲノミクス・空間トランスクリプトミクス市場:技術の変動分析
- 空間トランスクリプトミクス
- 世界の空間トランスクリプトミクス市場、2018年から2030年
- シーケンスベースの手法
- IHC
- 顕微鏡ベースのRNAイメージング技術
- 空間ゲノミクス
- 世界の空間ゲノミクス市場、2018年から2030年
- FISH
- 顕微鏡ベースのDNAライブイメージング
- ゲノム摂動ツール
- 大量並行シーケンス
- 生化学的手法
- その他
第5章 製品のビジネス分析
- 空間ゲノミクス・空間トランスクリプトミクス市場:製品の変動分析
- 機器
- 消耗品
- ソフトウェア
第6章 最終用途のビジネス分析
- 空間ゲノミクス・空間トランスクリプトミクス市場:最終用途の変動分析
- トランスレーショナルリサーチ
- 学術機関の顧客
- 診断の顧客
- 製薬メーカー
第7章 地域のビジネス分析
- 空間ゲノミクス・空間トランスクリプトミクスの市場シェア:地域別、2022年および2030年
- 北米
- SWOT分析
- 空間ゲノミクス・空間トランスクリプトミクス市場、2018年~2030年
- 米国
- カナダ
- 欧州
- SWOT分析
- 空間ゲノミクス・空間トランスクリプトミクス市場、2018年~2030年
- 英国
- ドイツ
- フランス
- イタリア
- スペイン
- デンマーク
- スウェーデン
- ノルウェー
- アジア太平洋地域
- SWOT分析
- 空間ゲノミクス・空間トランスクリプトミクス市場、2018年~2030年
- 日本
- 中国
- インド
- オーストラリア
- タイ
- 韓国
- ラテンアメリカ
- SWOT分析
- 空間ゲノミクス・空間トランスクリプトミクス市場、2018年~2030年
- ブラジル
- メキシコ
- アルゼンチン
- 中東・アフリカ
- SWOT分析
- 空間ゲノミクス・空間トランスクリプトミクス市場、2018年~2030年
- 南アフリカ
- サウジアラビア
- アラブ首長国連邦
- クウェート
第8章 競合情勢
- 企業の分類
- 戦略マッピング
- 企業の市場シェア分析、2022年
- 企業プロファイル・一覧表
- Natera, Inc.
- 10x Genomics
- Dovetail Genomics
- Illumina, Inc.
- S2 Genomics, Inc.
- Nanostring Technologies, Inc.
- Seven Bridges Genomics
- Horizon Discovery Group plc
- Bio-Techne
List of Tables
- Table 1 List of abbreviations
- Table 2 Global Spatial Genomics & Transcriptomics Market, by Product, 2018 - 2030 (USD Million)
- Table 3 Global Spatial Genomics & Transcriptomics Market, by Technology, 2018 - 2030 (USD Million)
- Table 4 Global Spatial Genomics & Transcriptomics Market, by End-use, 2018 - 2030 (USD Million)
- Table 5 Global Spatial Genomics & Transcriptomics Market, by region, 2018 - 2030 (USD Million)
- Table 6 North America Spatial Genomics & Transcriptomics Market, by Country, 2018 - 2030 (USD Million)
- Table 7 North America Spatial Genomics & Transcriptomics Market, by Product, 2018 - 2030 (USD Million)
- Table 8 North America Spatial Genomics & Transcriptomics Market, by Technology, 2018 - 2030 (USD Million)
- Table 9 North America Spatial Genomics & Transcriptomics Market, by End-use, 2018 - 2030 (USD Million)
- Table 10 U.S. Spatial Genomics & Transcriptomics Market, by Product, 2018 - 2030 (USD Million)
- Table 11 U.S. Spatial Genomics & Transcriptomics Market, by Technology, 2018 - 2030 (USD Million)
- Table 12 U.S. Spatial Genomics & Transcriptomics Market, by End-use, 2018 - 2030 (USD Million)
- Table 13 Canada Spatial Genomics & Transcriptomics Market, by Product, 2018 - 2030 (USD Million)
- Table 14 Canada Spatial Genomics & Transcriptomics Market, by Technology, 2018 - 2030 (USD Million)
- Table 15 Canada Spatial Genomics & Transcriptomics Market, by End-use, 2018 - 2030 (USD Million)
- Table 16 Europe Spatial Genomics & Transcriptomics Market, by Country, 2018 - 2030 (USD Million)
- Table 17 Europe Spatial Genomics & Transcriptomics Market, by Product, 2018 - 2030 (USD Million)
- Table 18 Europe Spatial Genomics & Transcriptomics Market, by Technology, 2018 - 2030 (USD Million)
- Table 19 Europe Spatial Genomics & Transcriptomics Market, by End-use, 2018 - 2030 (USD Million)
- Table 20 UK Spatial Genomics & Transcriptomics Market, by Product, 2018 - 2030 (USD Million)
- Table 21 UK Spatial Genomics & Transcriptomics Market, by Technology, 2018 - 2030 (USD Million)
- Table 22 UK Spatial Genomics & Transcriptomics Market, by End-use, 2018 - 2030 (USD Million)
- Table 23 Germany Spatial Genomics & Transcriptomics Market, by Product, 2018 - 2030 (USD Million)
- Table 24 Germany Spatial Genomics & Transcriptomics Market, by Technology, 2018 - 2030 (USD Million)
- Table 25 Germany Spatial Genomics & Transcriptomics Market, by End-use, 2018 - 2030 (USD Million)
- Table 26 France Spatial Genomics & Transcriptomics Market, by Product, 2018 - 2030 (USD Million)
- Table 27 France Spatial Genomics & Transcriptomics Market, by Technology, 2018 - 2030 (USD Million)
- Table 28 France Spatial Genomics & Transcriptomics Market, by End-use, 2018 - 2030 (USD Million)
- Table 29 Italy Spatial Genomics & Transcriptomics Market, by Product, 2018 - 2030 (USD Million)
- Table 30 Italy Spatial Genomics & Transcriptomics Market, by Technology, 2018 - 2030 (USD Million)
- Table 31 Italy Spatial Genomics & Transcriptomics Market, by End-use, 2018 - 2030 (USD Million)
- Table 32 Spain Spatial Genomics & Transcriptomics Market, by Product, 2018 - 2030 (USD Million)
- Table 33 Spain Spatial Genomics & Transcriptomics Market, by Technology, 2018 - 2030 (USD Million)
- Table 34 Spain Spatial Genomics & Transcriptomics Market, by End-use, 2018 - 2030 (USD Million)
- Table 35 Denmark Spatial Genomics & Transcriptomics Market, by Product, 2018 - 2030 (USD Million)
- Table 36 Denmark Spatial Genomics & Transcriptomics Market, by Technology, 2018 - 2030 (USD Million)
- Table 37 Denmark Spatial Genomics & Transcriptomics Market, by End-use, 2018 - 2030 (USD Million)
- Table 38 Sweden Spatial Genomics & Transcriptomics Market, by Product, 2018 - 2030 (USD Million)
- Table 39 Sweden Spatial Genomics & Transcriptomics Market, by Technology, 2018 - 2030 (USD Million)
- Table 40 Sweden Spatial Genomics & Transcriptomics Market, by End-use, 2018 - 2030 (USD Million)
- Table 41 Norway Spatial Genomics & Transcriptomics Market, by Product, 2018 - 2030 (USD Million)
- Table 42 Norway Spatial Genomics & Transcriptomics Market, by Technology, 2018 - 2030 (USD Million)
- Table 43 Norway Spatial Genomics & Transcriptomics Market, by End-use, 2018 - 2030 (USD Million)
- Table 44 Asia Pacific Spatial Genomics & Transcriptomics Market, by Country, 2018 - 2030 (USD Million)
- Table 45 Asia Pacific Spatial Genomics & Transcriptomics Market, by Product, 2018 - 2030 (USD Million)
- Table 46 Asia Pacific Spatial Genomics & Transcriptomics Market, by Technology, 2018 - 2030 (USD Million)
- Table 47 Asia Pacific Spatial Genomics & Transcriptomics Market, by End-use, 2018 - 2030 (USD Million)
- Table 48 Japan Spatial Genomics & Transcriptomics Market, by Product, 2018 - 2030 (USD Million)
- Table 49 Japan Spatial Genomics & Transcriptomics Market, by Technology, 2018 - 2030 (USD Million)
- Table 50 Japan Spatial Genomics & Transcriptomics Market, by End-use, 2018 - 2030 (USD Million)
- Table 51 China Spatial Genomics & Transcriptomics Market, by Product, 2018 - 2030 (USD Million)
- Table 52 China Spatial Genomics & Transcriptomics Market, by Technology, 2018 - 2030 (USD Million)
- Table 53 China Spatial Genomics & Transcriptomics Market, by End-use, 2018 - 2030 (USD Million)
- Table 54 India Spatial Genomics & Transcriptomics Market, by Product, 2018 - 2030 (USD Million)
- Table 55 India Spatial Genomics & Transcriptomics Market, by Technology, 2018 - 2030 (USD Million)
- Table 56 India Spatial Genomics & Transcriptomics Market, by End-use, 2018 - 2030 (USD Million)
- Table 57 Australia Spatial Genomics & Transcriptomics Market, by Product, 2018 - 2030 (USD Million)
- Table 58 Australia Spatial Genomics & Transcriptomics Market, by Technology, 2018 - 2030 (USD Million)
- Table 59 Australia Spatial Genomics & Transcriptomics Market, by End-use, 2018 - 2030 (USD Million)
- Table 60 Thailand Spatial Genomics & Transcriptomics Market, by Product, 2018 - 2030 (USD Million)
- Table 61 Thailand Spatial Genomics & Transcriptomics Market, by Technology, 2018 - 2030 (USD Million)
- Table 62 Thailand Spatial Genomics & Transcriptomics Market, by End-use, 2018 - 2030 (USD Million)
- Table 63 South Korea Spatial Genomics & Transcriptomics Market, by Product, 2018 - 2030 (USD Million)
- Table 64 South Korea Spatial Genomics & Transcriptomics Market, by Technology, 2018 - 2030 (USD Million)
- Table 65 South Korea Spatial Genomics & Transcriptomics Market, by End-use, 2018 - 2030 (USD Million)
- Table 66 Latin America Spatial Genomics & Transcriptomics Market, by Country, 2018 - 2030 (USD Million)
- Table 67 Latin America Spatial Genomics & Transcriptomics Market, by Product, 2018 - 2030 (USD Million)
- Table 68 Latin America Spatial Genomics & Transcriptomics Market, by Technology, 2018 - 2030 (USD Million)
- Table 69 Latin America Spatial Genomics & Transcriptomics Market, by End-use, 2018 - 2030 (USD Million)
- Table 70 Brazil Spatial Genomics & Transcriptomics Market, by Product, 2018 - 2030 (USD Million)
- Table 71 Brazil Spatial Genomics & Transcriptomics Market, by Technology, 2018 - 2030 (USD Million)
- Table 72 Brazil Spatial Genomics & Transcriptomics Market, by End-use, 2018 - 2030 (USD Million)
- Table 73 Mexico Spatial Genomics & Transcriptomics Market, by Product, 2018 - 2030 (USD Million)
- Table 74 Mexico Spatial Genomics & Transcriptomics Market, by Technology, 2018 - 2030 (USD Million)
- Table 75 Mexico Spatial Genomics & Transcriptomics Market, by End-use, 2018 - 2030 (USD Million)
- Table 76 Argentina Spatial Genomics & Transcriptomics Market, by Product, 2018 - 2030 (USD Million)
- Table 77 Argentina Spatial Genomics & Transcriptomics Market, by Technology, 2018 - 2030 (USD Million)
- Table 78 Argentina Spatial Genomics & Transcriptomics Market, by End-use, 2018 - 2030 (USD Million)
- Table 79 Middle East & Africa Spatial Genomics & Transcriptomics Market, by Country, 2018 - 2030 (USD Million)
- Table 80 Middle East & Africa Spatial Genomics & Transcriptomics Market, by Product, 2018 - 2030 (USD Million)
- Table 81 Middle East & Africa Spatial Genomics & Transcriptomics Market, by Technology, 2018 - 2030 (USD Million)
- Table 82 Middle East & Africa Spatial Genomics & Transcriptomics Market, by End-use, 2018 - 2030 (USD Million)
- Table 83 South Africa Spatial Genomics & Transcriptomics Market, by Product, 2018 - 2030 (USD Million)
- Table 84 South Africa Spatial Genomics & Transcriptomics Market, by Technology, 2018 - 2030 (USD Million)
- Table 85 South Africa Spatial Genomics & Transcriptomics Market, by End-use, 2018 - 2030 (USD Million)
- Table 86 Saudi Arabia Spatial Genomics & Transcriptomics Market, by Product, 2018 - 2030 (USD Million)
- Table 87 Saudi Arabia Spatial Genomics & Transcriptomics Market, by Technology, 2018 - 2030 (USD Million)
- Table 88 Saudi Arabia Spatial Genomics & Transcriptomics Market, by End-use, 2018 - 2030 (USD Million)
- Table 89 UAE Spatial Genomics & Transcriptomics Market, by Product, 2018 - 2030 (USD Million)
- Table 90 UAE Spatial Genomics & Transcriptomics Market, by Technology, 2018 - 2030 (USD Million)
- Table 91 UAE Spatial Genomics & Transcriptomics Market, by End-use, 2018 - 2030 (USD Million)
- Table 92 Kuwait Spatial Genomics & Transcriptomics Market, by Product, 2018 - 2030 (USD Million)
- Table 93 Kuwait Spatial Genomics & Transcriptomics Market, by Technology, 2018 - 2030 (USD Million)
- Table 94 Kuwait Spatial Genomics & Transcriptomics Market, by End-use, 2018 - 2030 (USD Million)
List of Figures
- Fig. 1 Market research process
- Fig. 2 Information procurement
- Fig. 3 Primary research pattern
- Fig. 4 Market research approaches
- Fig. 5 Value chain - based sizing & forecasting
- Fig. 6 Market formulation & validation
- Fig. 7 Spatial genomics & transcriptomics market segmentation
- Fig. 8 Market snapshot, 2022
- Fig. 9 Market trends & outlook
- Fig. 10 Market driver relevance analysis (current & future impact)
- Fig. 11 Market restraint relevance analysis (current & future impact)
- Fig. 12 PESTEL analysis
- Fig. 13 Porter's five forces analysis
- Fig. 14 Global spatial genomics & transcriptomics market: Product movement analysis
- Fig. 15 Global spatial genomics & transcriptomics market, for instruments, 2018 - 2030 (USD Million)
- Fig. 16 Global spatial genomics & transcriptomics market, for automated, 2018 - 2030 (USD Million)
- Fig. 17 Global spatial genomics & transcriptomics market, for semi - automated, 2018 - 2030 (USD Million)
- Fig. 18 Global spatial genomics & transcriptomics market, for manual, 2018 - 2030 (USD Million)
- Fig. 19 Global spatial genomics & transcriptomics market, for sequencing platforms, 2018 - 2030 (USD Million)
- Fig. 20 Global spatial genomics & transcriptomics market, for IHC, 2018 - 2030 (USD Million)
- Fig. 21 Global spatial genomics & transcriptomics market, for microscopy, 2018 - 2030 (USD Million)
- Fig. 22 Global spatial genomics & transcriptomics market, for flow cytometry, 2018 - 2030 (USD Million)
- Fig. 23 Global spatial genomics & transcriptomics market, for mass spectrometry, 2018 - 2030 (USD Million)
- Fig. 24 Global spatial genomics & transcriptomics market, for others, 2018 - 2030 (USD Million)
- Fig. 25 Global spatial genomics & transcriptomics market, for consumables, 2018 - 2030 (USD Million)
- Fig. 26 Global spatial genomics & transcriptomics market, for software, 2018 - 2030 (USD Million)
- Fig. 27 Global spatial genomics & transcriptomics market, for bioinformatics tools, 2018 - 2030 (USD Million)
- Fig. 28 Global spatial genomics & transcriptomics market, for imaging tools, 2018 - 2030 (USD Million)
- Fig. 29 Global spatial genomics & transcriptomics market, for storage and management databases, 2018 - 2030 (USD Million)
- Fig. 30 Global spatial genomics & transcriptomics market: Technology movement analysis
- Fig. 31 Global spatial genomics & transcriptomics market, for spatial transcriptomics, 2018 - 2030 (USD Million)
- Fig. 32 Global spatial genomics & transcriptomics market, for sequencing - based methods, 2018 - 2030 (USD Million)
- Fig. 33 Global spatial genomics & transcriptomics market, for LCM methods, 2018 - 2030 (USD Million)
- Fig. 34 Global spatial genomics & transcriptomics market, for FFPE tissue samples, 2018 - 2030 (USD Million)
- Fig. 35 Global spatial genomics & transcriptomics market, for other Laser Capture Microdissection, 2018 - 2030 (USD Million)
- Fig. 36 Global spatial genomics & transcriptomics market, for TIVA, 2018 - 2030 (USD Million)
- Fig. 37 Global spatial genomics & transcriptomics market, for in - situ sequencing, 2018 - 2030 (USD Million)
- Fig. 38 Global spatial genomics & transcriptomics market, for microtomy sequencing, 2018 - 2030 (USD Million)
- Fig. 39 Global spatial genomics & transcriptomics market, for IHC sequencing, 2018 - 2030 (USD Million)
- Fig. 40 Global spatial genomics & transcriptomics market, for microscopy - based RNA imaging technologies, 2018 - 2030 (USD Million)
- Fig. 41 Global spatial genomics & transcriptomics market, for smFISH, 2018 - 2030 (USD Million)
- Fig. 42 Global spatial genomics & transcriptomics market, for padlock probes/rolling circle amplification, 2018 - 2030 (USD Million)
- Fig. 43 Global spatial genomics & transcriptomics market, for branched DNA probes, 2018 - 2030 (USD Million)
- Fig. 44 Global spatial genomics & transcriptomics market, for spatial genomics, 2018 - 2030 (USD Million)
- Fig. 45 Global spatial genomics & transcriptomics market, for FISH, 2018 - 2030 (USD Million)
- Fig. 46 Global spatial genomics & transcriptomics market, for microscopy - based Live DNA imaging, 2018 - 2030 (USD Million)
- Fig. 47 Global spatial genomics & transcriptomics market, for genome perturbation tools, 2018 - 2030 (USD Million)
- Fig. 48 Global spatial genomics & transcriptomics market, for massively - parallel sequencing, 2018 - 2030 (USD Million)
- Fig. 49 Global spatial genomics & transcriptomics market, for biochemical techniques, 2018 - 2030 (USD Million)
- Fig. 50 Global spatial genomics & transcriptomics market, for other spatial genomic technique, 2018 - 2030 (USD Million)
- Fig. 51 Global spatial genomics & transcriptomics market: End - use movement analysis
- Fig. 52 Global spatial genomics & transcriptomics market, for translational research, 2018 - 030 (USD Million)
- Fig. 53 Global spatial genomics & transcriptomics market, for academic customers, 2018 - 030 (USD Million)
- Fig. 54 Global spatial genomics & transcriptomics market, for diagnostic customers, 2018 - 030 (USD Million)
- Fig. 55 Global spatial genomics & transcriptomics market, for pharmaceutical manufacturer, 2018 - 030 (USD Million)
- Fig. 56 Regional marketplace: Key takeaways
- Fig. 57 Regional outlook, 2022 & 2030
- Fig. 58 Global spatial genomics & transcriptomics market: Region movement analysis
- Fig. 59 North America spatial genomics & transcriptomics market, 2018 - 2030 (USD Million)
- Fig. 60 U.S. spatial genomics & transcriptomics market, 2018 - 2030 (USD Million)
- Fig. 61 Canada spatial genomics & transcriptomics market, 2018 - 2030 (USD Million)
- Fig. 62 Europe spatial genomics & transcriptomics market, 2018 - 2030 (USD Million)
- Fig. 63 Germany spatial genomics & transcriptomics market, 2018 - 2030 (USD Million)
- Fig. 64 UK spatial genomics & transcriptomics market, 2018 - 2030 (USD Million)
- Fig. 65 France spatial genomics & transcriptomics market, 2018 - 2030 (USD Million)
- Fig. 66 Italy spatial genomics & transcriptomics market, 2018 - 2030 (USD Million)
- Fig. 67 Spain spatial genomics & transcriptomics market, 2018 - 2030 (USD Million)
- Fig. 68 Denmark spatial genomics & transcriptomics market, 2018 - 2030 (USD Million)
- Fig. 69 Sweden spatial genomics & transcriptomics market, 2018 - 2030 (USD Million)
- Fig. 70 Norway spatial genomics & transcriptomics market, 2018 - 2030 (USD Million)
- Fig. 71 Asia Pacific spatial genomics & transcriptomics market, 2018 - 2030 (USD Million)
- Fig. 72 Japan spatial genomics & transcriptomics market, 2018 - 2030 (USD Million)
- Fig. 73 China spatial genomics & transcriptomics market, 2018 - 2030 (USD Million)
- Fig. 74 India spatial genomics & transcriptomics market, 2018 - 2030 (USD Million)
- Fig. 75 Australia spatial genomics & transcriptomics market, 2018 - 2030 (USD Million)
- Fig. 76 South Korea spatial genomics & transcriptomics market, 2018 - 2030 (USD Million)
- Fig. 77 Thailand spatial genomics & transcriptomics market, 2018 - 2030 (USD Million)
- Fig. 78 Latin America spatial genomics & transcriptomics market, 2018 - 2030 (USD Million)
- Fig. 79 Brazil spatial genomics & transcriptomics market, 2018 - 2030 (USD Million)
- Fig. 80 Mexico spatial genomics & transcriptomics market, 2018 - 2030 (USD Million)
- Fig. 81 Argentina spatial genomics & transcriptomics market, 2018 - 2030 (USD Million)
- Fig. 82 Middle East and Africa spatial genomics & transcriptomics market, 2018 - 2030 (USD Million)
- Fig. 83 South Africa spatial genomics & transcriptomics market, 2018 - 2030 (USD Million)
- Fig. 84 Saudi Arabia spatial genomics & transcriptomics market, 2018 - 2030 (USD Million)
- Fig. 85 UAE spatial genomics & transcriptomics market, 2018 - 2030 (USD Million)
- Fig. 86 Kuwait spatial genomics & transcriptomics market, 2018 - 2030 (USD Million)
Spatial Genomics & Transcriptomics Market Growth & Trends
The global spatial genomics & transcriptomics market size is expected to reach USD 574.3 million by 2030, according to a new report by Grand View Research, Inc. The market is expected to grow at a CAGR of 12.2% from 2023 to 2030. The market is poised for significant growth over the forecast period owing to the increasing potential of spatial genomic analysis as a cancer detection method and the advent of the latest generation of sequencing technology.
The shift toward personalized medicine, which aims to provide tailored healthcare based on individual characteristics, is driving the demand for spatial genomics and transcriptomics. These technologies offer a comprehensive view of the genetic and molecular landscape within patient tissues, enabling precise diagnosis, prognosis, and treatment selection. Spatial genomics and transcriptomics facilitate the identification of specific gene expression patterns associated with disease subtypes, allowing clinicians to make informed decisions about personalized treatment strategies.
The market for spatial genomics & transcriptomics has witnessed significant technological advancements in recent years. Companies have been investing in research and development to improve the accuracy, scalability, and affordability of spatial genomics and transcriptomics platforms. Additionally, the market has seen the introduction of user-friendly and integrated solutions that simplify data analysis and interpretation, making these technologies more accessible to a broader user base.
For instance, in April 2023, Vizgen launched the world's first single-cell spatial genomics platform based on MERFISH technology. The device offers high resolution and maximum efficiency to profile the transcriptome. These advancements have expanded the market potential and attracted investments from both academic and industry sectors.
Spatial Genomics & Transcriptomics Market Report Highlights
- The spatial transcriptomics technology segment accounted for the largest revenue share in 2022, owing to their high adoption as compared to spatial genomic methods, for the transcriptomic study of single cells
- The consumables segment is expected to grow at the fastest CAGR during the forecast period, as this segment covers products that are required to run the instruments across various stages of genome mapping from sample preparation to result derivation
- The translational research segment accounted for the highest revenue share in 2022, because the use of spatial omics technologies in translational research may potentially benefit research by providing a thorough analysis of physiology & state of a disease
- Asia Pacific is anticipated to be growing at the fastest CAGR over the forecast period due to the presence of untapped opportunities in the emerging economies of China and India
- A few major market players include Natera Inc.; 10x Genomics; Dovetail Genomics; Illumina, Inc.; and S2 Genomics, Inc.
Table of Contents
Chapter 1. Methodology and Scope
- 1.1. Market Segmentation and Scope
- 1.2. Market Definitions
- 1.2.1. Information Analysis
- 1.2.2. Market Formulation & Data Visualization
- 1.2.3. Data Validation & Publishing
- 1.3. Research Assumptions
- 1.4. Information Procurement
- 1.4.1. Primary Research
- 1.5. Information or Data Analysis
- 1.6. Market Formulation & Validation
- 1.7. Market Model
- 1.8. Global Market: CAGR Calculation
- 1.9. Objective
- 1.9.1. Objective 1
- 1.9.2. Objective2
Chapter 2. Executive Summary
- 2.1. Market Snapshot
- 2.2. Segment Snapshot
- 2.3. Competitive Landscape Snapshot
Chapter 3. Market Variables, Trends, & Scope
- 3.1. Market Lineage Outlook
- 3.1.1. Parent Market Outlook
- 3.1.2. Related/Ancillary Market Outlook
- 3.2. Market Dynamics
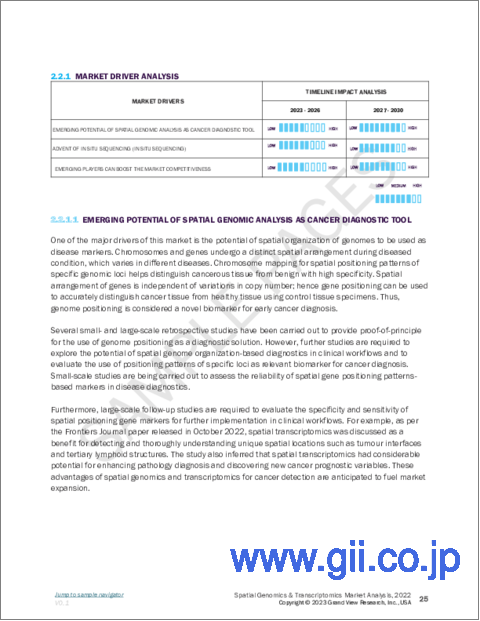
- 3.2.1. Market Driver Analysis
- 3.2.1.1. Emerging potential of spatial genomic analysis as a cancer diagnostic tool
- 3.2.1.2. Advent of the fourth generation of sequencing (in situ sequencing)
- 3.2.1.3. Emerging players can boost the market competitiveness
- 3.2.2. Market Restraint Analysis
- 3.2.2.1. Slow implementation of technology
- 3.2.2.2. Well-established workflows for conventional genomics & transcriptomics analysis
- 3.2.1. Market Driver Analysis
- 3.3. Industry Analysis Tools
- 3.3.1. Porter's Five Forces Analysis
- 3.3.2. PESTEL Analysis
- 3.3.3. COVID-19 Impact Analysis
Chapter 4. Technology Business Analysis
- 4.1. Spatial Genomics & Transcriptomics Market: Technology Movement Analysis
- 4.2. Spatial Transcriptomics
- 4.2.1. Global Spatial Transcriptomics Market, 2018 - 2030 (USD Million)
- 4.2.2. Sequencing-based methods
- 4.2.2.1. Global sequencing-based methods Market, 2018 - 2030 (USD Million)
- 4.2.2.2. Laser Capture Microdissection (LCM)
- 4.2.2.2.1. Global LCM market for spatial transcriptomics, 2018 - 2030 (USD Million)
- 4.2.2.2.2. LCM using FFPE Tissue Samples
- 4.2.2.2.2.1. Global FFPE tissue samples-based LCM market for spatial transcriptomics, 2018 - 2030 (USD Million)
- 4.2.2.2.3. LCM using other Tissue Samples
- 4.2.2.2.3.1. Global other tissue samples-based LCM market for spatial transcriptomics, 2018 - 2030 (USD Million)
- 4.2.2.3. Transcriptome In-vivo Analysis (TIVA)
- 4.2.2.3.1. Global TIVA market for spatial transcriptomics, 2018 - 2030 (USD Million)
- 4.2.2.4. In situ sequencing
- 4.2.2.4.1. Global In situ sequencing market for spatial transcriptomics, 2018 - 2030 (USD Million)
- 4.2.2.5. Microtomy sequencing
- 4.2.2.5.1. Global microtomy sequencing market for spatial transcriptomics, 2018 - 2030 (USD Million)
- 4.2.3. IHC
- 4.2.3.1. Global IHC Market, 2018 - 2030 (USD Million)
- 4.2.4. Microscopy-based RNA imaging techniques
- 4.2.4.1. Global microscopy-based RNA imaging techniques Market, 2018 - 2030 (USD Million)
- 4.2.4.2. Single Molecule RNA fluorescence In-Situ Hybridization (smFISH)
- 4.2.4.2.1. Global Single Molecule RNA fluorescence In-Situ Hybridization (smFISH) market for spatial transcriptomics, 2018 - 2030 (USD Million)
- 4.2.4.3. Padlock Probes/Rolling Circle Amplification
- 4.2.4.3.1. Global Padlock Probes/Rolling Circle Amplification market for spatial transcriptomics, 2018 - 2030 (USD Million)
- 4.2.4.4. Branched DNA Probes
- 4.2.4.4.1. Global Branched DNA probes market for spatial transcriptomics, 2018 - 2030 (USD Million)
- 4.3. Spatial Genomics
- 4.3.1. Global spatial genomics Market, 2018 - 2030 (USD Million)
- 4.3.2. FISH
- 4.3.2.1. Global FISH Market for spatial genomics, 2018 - 2030 (USD Million)
- 4.3.3. Microscopy-based Live DNA Imaging
- 4.3.3.1. Global Microscopy-based Live DNA Imaging Market for spatial genomics, 2018 - 2030 (USD Million)
- 4.3.4. Genome Perturbation tools
- 4.3.4.1. Global genome perturbation tools Market for spatial genomics, 2018 - 2030 (USD Million)
- 4.3.5. Massively-Parallel Sequencing
- 4.3.5.1. Global massively-parallel sequencing Market for spatial genomics, 2018 - 2030 (USD Million)
- 4.3.6. Biochemical Techniques
- 4.3.6.1. Global biochemical techniques Market for spatial genomics, 2018 - 2030 (USD Million)
- 4.3.7. Others
- 4.3.7.1. Global others Market for spatial genomics, 2018 - 2030 (USD Million)
Chapter 5. Product Business Analysis
- 5.1. Spatial Genomics & Transcriptomics Market: Product Movement Analysis
- 5.2. Instruments
- 5.2.1. Global Instruments Market for Spatial Genomics & Transcriptomics, 2018 - 2030 (USD Million)
- 5.2.2. By Mode
- 5.2.2.1. Automated
- 5.2.2.1.1. Global automated Market, 2018 - 2030 (USD Million)
- 5.2.2.2. Semi-Automated
- 5.2.2.2.1. Global semi-automated Market, 2018 - 2030 (USD Million)
- 5.2.2.3. Manual
- 5.2.2.3.1. Global manual Market, 2018 - 2030 (USD Million)
- 5.2.3. By Type
- 5.2.3.1. Sequencing Platforms
- 5.2.3.1.1. Global sequencing platforms Market, 2018 - 2030 (USD Million)
- 5.2.3.2. IHC
- 5.2.3.2.1. Global IHC Market, 2018 - 2030 (USD Million)
- 5.2.3.3. Microscopy
- 5.2.3.3.1. Global microscopy Market, 2018 - 2030 (USD Million)
- 5.2.3.4. Flow Cytometry
- 5.2.3.4.1. Global flow cytometry Market, 2018 - 2030 (USD Million)
- 5.2.3.5. Mass Spectrometry
- 5.2.3.5.1. Global mass spectrometry Market, 2018 - 2030 (USD Million)
- 5.2.3.6. Others
- 5.2.3.6.1. Global others Market, 2018 - 2030 (USD Million)
- 5.3. Consumables
- 5.3.1. Global consumables Market for Spatial Genomics & Transcriptomics, 2018 - 2030 (USD Million)
- 5.4. Software
- 5.4.1. Global software Market for Spatial Genomics & Transcriptomics, 2018 - 2030 (USD Million)
- 5.4.2. Bioinformatics Tools
- 5.4.2.1. Global bioinformatics tools Market for Spatial Genomics & Transcriptomics, 2018 - 2030 (USD Million)
- 5.4.3. Imaging Tools
- 5.4.3.1. Global imaging tools Market for Spatial Genomics & Transcriptomics, 2018 - 2030 (USD Million)
- 5.4.4. Storage and Management Databases
- 5.4.4.1. Global storage and management databases Market for Spatial Genomics & Transcriptomics, 2018 - 2030 (USD Million)
Chapter 6. End-use Business Analysis
- 6.1. Spatial Genomics & Transcriptomics Market: End-use Movement Analysis
- 6.2. Translational Research
- 6.2.1. Global spatial genomics & transcriptomics-based translational research market, 2018 - 2030 (USD Million)
- 6.3. Academic Customers
- 6.3.1. Global spatial genomics & transcriptomics-based academic customers market, 2018 - 2030 (USD Million)
- 6.4. Diagnostic Customers
- 6.4.1. Global spatial genomics & transcriptomics-based diagnostic customers market, 2018 - 2030 (USD Million)
- 6.5. Pharmaceutical Manufacturer
- 6.5.1. Global spatial genomics & transcriptomics-based pharmaceutical manufacturer market, 2018 - 2030 (USD Million)
Chapter 7. Regional Business Analysis
- 7.1. Spatial Genomics & Transcriptomics Market Share By Region, 2022 & 2030
- 7.2. North America
- 7.2.1. SWOT Analysis
- 7.2.2. North America Spatial Genomics & Transcriptomics Market, 2018 - 2030 (USD Million)
- 7.2.3. U.S.
- 7.2.3.1. Key Country Dynamics
- 7.2.3.2. Target Disease Prevalence
- 7.2.3.3. Competitive Scenario
- 7.2.3.4. Regulatory Framework
- 7.2.3.5. U.S. Spatial Genomics & Transcriptomics Market, 2018 - 2030 (USD Million)
- 7.2.4. Canada
- 7.2.4.1. Key Country Dynamics
- 7.2.4.2. Target Disease Prevalence
- 7.2.4.3. Competitive Scenario
- 7.2.4.4. Regulatory Framework
- 7.2.4.5. Canada Spatial Genomics & Transcriptomics Market, 2018 - 2030 (USD Million)
- 7.3. Europe
- 7.3.1. SWOT Analysis
- 7.3.2. Europe Spatial Genomics & Transcriptomics Market, 2018 - 2030 (USD Million)
- 7.3.3. UK
- 7.3.3.1. Key Country Dynamics
- 7.3.3.2. Target Disease Prevalence
- 7.3.3.3. Competitive Scenario
- 7.3.3.4. Regulatory Framework
- 7.3.3.5. UK Spatial Genomics & Transcriptomics Market, 2018 - 2030 (USD Million)
- 7.3.4. Germany
- 7.3.4.1. Key Country Dynamics
- 7.3.4.2. Target Disease Prevalence
- 7.3.4.3. Competitive Scenario
- 7.3.4.4. Regulatory Framework
- 7.3.4.5. Germany Spatial Genomics & Transcriptomics Market, 2018 - 2030 (USD Million)
- 7.3.5. France
- 7.3.5.1. Key Country Dynamics
- 7.3.5.2. Target Disease Prevalence
- 7.3.5.3. Competitive Scenario
- 7.3.5.4. Regulatory Framework
- 7.3.5.5. France Spatial Genomics & Transcriptomics Market, 2018 - 2030 (USD Million)
- 7.3.6. Italy
- 7.3.6.1. Key Country Dynamics
- 7.3.6.2. Target Disease Prevalence
- 7.3.6.3. Competitive Scenario
- 7.3.6.4. Regulatory Framework
- 7.3.6.5. Italy Spatial Genomics & Transcriptomics Market, 2018 - 2030 (USD Million)
- 7.3.7. Spain
- 7.3.7.1. Key Country Dynamics
- 7.3.7.2. Target Disease Prevalence
- 7.3.7.3. Competitive Scenario
- 7.3.7.4. Regulatory Framework
- 7.3.7.5. Spain Spatial Genomics & Transcriptomics Market, 2018 - 2030 (USD Million)
- 7.3.8. Denmark
- 7.3.8.1. Key Country Dynamics
- 7.3.8.2. Target Disease Prevalence
- 7.3.8.3. Competitive Scenario
- 7.3.8.4. Regulatory Framework
- 7.3.8.5. Denmark Spatial Genomics & Transcriptomics Market, 2018 - 2030 (USD Million)
- 7.3.9. Sweden
- 7.3.9.1. Key Country Dynamics
- 7.3.9.2. Target Disease Prevalence
- 7.3.9.3. Competitive Scenario
- 7.3.9.4. Regulatory Framework
- 7.3.9.5. Sweden Spatial Genomics & Transcriptomics Market, 2018 - 2030 (USD Million)
- 7.3.10. Norway
- 7.3.10.1. Key Country Dynamics
- 7.3.10.2. Target Disease Prevalence
- 7.3.10.3. Competitive Scenario
- 7.3.10.4. Regulatory Framework
- 7.3.10.5. Norway Spatial Genomics & Transcriptomics Market, 2018 - 2030 (USD Million)
- 7.4. Asia Pacific
- 7.4.1. SWOT Analysis
- 7.4.2. Asia Pacific Spatial Genomics & Transcriptomics Market, 2018 - 2030 (USD Million)
- 7.4.3. Japan
- 7.4.3.1. Key Country Dynamics
- 7.4.3.2. Target Disease Prevalence
- 7.4.3.3. Competitive Scenario
- 7.4.3.4. Regulatory Framework
- 7.4.3.5. Japan Spatial Genomics & Transcriptomics Market, 2018 - 2030 (USD Million)
- 7.4.4. China
- 7.4.4.1. Key Country Dynamics
- 7.4.4.2. Target Disease Prevalence
- 7.4.4.3. Competitive Scenario
- 7.4.4.4. Regulatory Framework
- 7.4.4.5. China Spatial Genomics & Transcriptomics Market, 2018 - 2030 (USD Million)
- 7.4.5. India
- 7.4.5.1. Key Country Dynamics
- 7.4.5.2. Target Disease Prevalence
- 7.4.5.3. Competitive Scenario
- 7.4.5.4. Regulatory Framework
- 7.4.5.5. India Spatial Genomics & Transcriptomics Market, 2018 - 2030 (USD Million)
- 7.4.6. Australia
- 7.4.6.1. Key Country Dynamics
- 7.4.6.2. Target Disease Prevalence
- 7.4.6.3. Competitive Scenario
- 7.4.6.4. Regulatory Framework
- 7.4.6.5. Australia Spatial Genomics & Transcriptomics Market, 2018 - 2030 (USD Million)
- 7.4.7. Thailand
- 7.4.7.1. Key Country Dynamics
- 7.4.7.2. Target Disease Prevalence
- 7.4.7.3. Competitive Scenario
- 7.4.7.4. Regulatory Framework
- 7.4.7.5. Thailand Spatial Genomics & Transcriptomics Market, 2018 - 2030 (USD Million)
- 7.4.8. South Korea
- 7.4.8.1. Key Country Dynamics
- 7.4.8.2. Target Disease Prevalence
- 7.4.8.3. Competitive Scenario
- 7.4.8.4. Regulatory Framework
- 7.4.8.5. South Korea Spatial Genomics & Transcriptomics Market, 2018 - 2030 (USD Million)
- 7.5. Latin America
- 7.5.1. SWOT Analysis
- 7.5.2. Latin America Spatial Genomics & Transcriptomics Market, 2018 - 2030 (USD Million)
- 7.5.3. Brazil
- 7.5.3.1. Key Country Dynamics
- 7.5.3.2. Target Disease Prevalence
- 7.5.3.3. Competitive Scenario
- 7.5.3.4. Regulatory Framework
- 7.5.3.5. Brazil Spatial Genomics & Transcriptomics Market, 2018 - 2030 (USD Million)
- 7.5.4. Mexico
- 7.5.4.1. Key Country Dynamics
- 7.5.4.2. Target Disease Prevalence
- 7.5.4.3. Competitive Scenario
- 7.5.4.4. Regulatory Framework
- 7.5.4.5. Mexico Spatial Genomics & Transcriptomics Market, 2018 - 2030 (USD Million)
- 7.5.5. Argentina
- 7.5.5.1. Key Country Dynamics
- 7.5.5.2. Target Disease Prevalence
- 7.5.5.3. Competitive Scenario
- 7.5.5.4. Regulatory Framework
- 7.5.5.5. Argentina Spatial Genomics & Transcriptomics Market, 2018 - 2030 (USD Million)
- 7.6. MEA
- 7.6.1. SWOT Analysis
- 7.6.2. MEA Spatial Genomics & Transcriptomics Market, 2018 - 2030 (USD Million)
- 7.6.3. South Africa
- 7.6.3.1. Key Country Dynamics
- 7.6.3.2. Target Disease Prevalence
- 7.6.3.3. Competitive Scenario
- 7.6.3.4. Regulatory Framework
- 7.6.3.5. South Africa Spatial Genomics & Transcriptomics Market, 2018 - 2030 (USD Million)
- 7.6.4. Saudi Arabia
- 7.6.4.1. Key Country Dynamics
- 7.6.4.2. Target Disease Prevalence
- 7.6.4.3. Competitive Scenario
- 7.6.4.4. Regulatory Framework
- 7.6.4.5. Saudi Arabia Spatial Genomics & Transcriptomics Market, 2018 - 2030 (USD Million)
- 7.6.5. UAE
- 7.6.5.1. Key Country Dynamics
- 7.6.5.2. Target Disease Prevalence
- 7.6.5.3. Competitive Scenario
- 7.6.5.4. Regulatory Framework
- 7.6.5.5. UAE Spatial Genomics & Transcriptomics Market, 2018 - 2030 (USD Million)
- 7.6.6. Kuwait
- 7.6.6.1. Key Country Dynamics
- 7.6.6.2. Target Disease Prevalence
- 7.6.6.3. Competitive Scenario
- 7.6.6.4. Regulatory Framework
- 7.6.6.5. Kuwait Spatial Genomics & Transcriptomics Market, 2018 - 2030 (USD Million)
Chapter 8. Competitive Landscape
- 8.1. Company Categorization
- 8.2. Strategy Mapping
- 8.3. Company Market Share Analysis, 2022
- 8.4. Company Profiles/Listing
- 8.4.1. Natera, Inc.
- 8.4.1.1. Overview
- 8.4.1.2. Financial Performance (Net Revenue/Sales/EBITDA/Gross Profit)
- 8.4.1.3. Product Benchmarking
- 8.4.1.4. Strategic Initiatives
- 8.4.2. 10x Genomics
- 8.4.2.1. Overview
- 8.4.2.2. Financial Performance (Net Revenue/Sales/EBITDA/Gross Profit)
- 8.4.2.3. Product Benchmarking
- 8.4.2.4. Strategic Initiatives
- 8.4.3. Dovetail Genomics
- 8.4.3.1. Overview
- 8.4.3.2. Financial Performance (Net Revenue/Sales/EBITDA/Gross Profit)
- 8.4.3.3. Product Benchmarking
- 8.4.3.4. Strategic Initiatives
- 8.4.4. Illumina, Inc.
- 8.4.4.1. Overview
- 8.4.4.2. Financial Performance (Net Revenue/Sales/EBITDA/Gross Profit)
- 8.4.4.3. Product Benchmarking
- 8.4.4.4. Strategic Initiatives
- 8.4.5. S2 Genomics, Inc.
- 8.4.5.1. Overview
- 8.4.5.2. Financial Performance (Net Revenue/Sales/EBITDA/Gross Profit)
- 8.4.5.3. Product Benchmarking
- 8.4.5.4. Strategic Initiatives
- 8.4.6. Nanostring Technologies, Inc.
- 8.4.6.1. Overview
- 8.4.6.2. Financial Performance (Net Revenue/Sales/EBITDA/Gross Profit)
- 8.4.6.3. Product Benchmarking
- 8.4.6.4. Strategic Initiatives
- 8.4.7. Seven Bridges Genomics
- 8.4.7.1. Overview
- 8.4.7.2. Financial Performance (Net Revenue/Sales/EBITDA/Gross Profit)
- 8.4.7.3. Product Benchmarking
- 8.4.7.4. Strategic Initiatives
- 8.4.8. Horizon Discovery Group plc
- 8.4.8.1. Overview
- 8.4.8.2. Financial Performance (Net Revenue/Sales/EBITDA/Gross Profit)
- 8.4.8.3. Product Benchmarking
- 8.4.8.4. Strategic Initiatives
- 8.4.9. Bio-Techne
- 8.4.9.1. Overview
- 8.4.9.2. Financial Performance (Net Revenue/Sales/EBITDA/Gross Profit)
- 8.4.9.3. Product Benchmarking
- 8.4.9.4. Strategic Initiatives
- 8.4.1. Natera, Inc.