|
|
市場調査レポート
商品コード
1097120
LEDドライバーの市場規模、シェア、動向分析レポート:供給タイプ別(定電圧、定電流)、アプリケーション別(自動車、家電、照明)、地域別、セグメント別予測、2022年~2030年LED Driver Market Size, Share & Trends Analysis Report By Supply Type (Constant Voltage, Constant Current), By Application (Automotive, Consumer Electronics, Lighting), By Region, And Segment Forecasts, 2022 - 2030 |
||||||
|
|
|||||||
|
● お客様のご希望に応じて、既存データの加工や未掲載情報(例:国別セグメント)の追加などの対応が可能です。 詳細はお問い合わせください。 |
|||||||


| LEDドライバーの市場規模、シェア、動向分析レポート:供給タイプ別(定電圧、定電流)、アプリケーション別(自動車、家電、照明)、地域別、セグメント別予測、2022年~2030年 |
|
出版日: 2022年06月22日
発行: Grand View Research
ページ情報: 英文 125 Pages
納期: 2~10営業日
|
- 全表示
- 概要
- 図表
- 目次
LEDドライバー市場の成長と動向
グランドビューリサーチ社の最新レポートによると、世界のLEDドライバー市場規模は2030年に308億米ドルに達すると推定されています。
同市場は2022年から2030年にかけて23.5%のCAGRを記録すると予測されています。LEDは、過去10年間に従来の光源に代わるエネルギー効率の高い光源として進化し、産業界の照明やディスプレイ分野での利用が増加しています。
LED照明機器は、長寿命、高いエネルギー効率、環境への配慮、小型化、発熱量の低減、指向性など、さまざまな利点があるため、従来の照明製品からの置き換えが進んでいます。さらに、先進国ではスマートビルやスマートホームの増加が、IoTベースの連携型照明システムの需要を押し上げています。複数の政府が居住する都市の省エネを高めるためにスマートシティの取り組みを開始しており、これが市場をさらに押し上げると予想されます。
2017年から2021年にかけて、定電流LEDドライバーの需要は指数関数的に伸び、これらのドライバーは高輝度や外部照明アプリケーションに頻繁に採用されます。LEDドライバーの主要アプリケーションセグメントは家電製品であり、LEDの需要はテレビとディスプレイパネル分野で急増しています。大手メーカーは、世界中の街で省エネや効率的なメンテナンスのために、遠隔管理に接続された公共照明システムを供給するために他社と協力しています。
例えば、2021年11月にルトロンエレクトロニクス株式会社が発表した「RadioRA 3」は、キーパッド、スイッチ、静電容量式タッチ調光器といった多様な国内接続製品を、現代的なライトバーデザインに接続する照明制御システムであります。RadioRA 3は、IoT(Internet of Things)接続とライトバーデザインを含む壁面制御のラインアップにより、設置者と消費者が家庭用照明システムを体験する方法に革命をもたらしました。
低・中出力域のアプリケーションでは、電力損失が少なく、システムパッケージが小さく、低コストでありながら、優れた信頼性を実現するドライバーへの要求が高まっています。LEDドライバーメーカーは、コスト削減の基準を満たすために、二次応答回路やPower-Factor Correction関連電子回路を削除し、より高い電力品質を実現するPrimary-Side Regulation(PSR)を実装し、コスト削減に取り組んでいます。
LEDドライバー市場のレポートハイライト
- 2022年から2030年までのCAGRは、定電流タイプが23.9%以上と予測されています。一般照明用途では、定電流ドライバーは定電圧ドライバーよりも信頼性が高いです。
- 照明分野は、欧州とアジア太平洋地域での投資拡大により、予測期間中のCAGRが約26.0%に達すると予測されています。
- アジア太平洋地域は、2021年の世界売上高の44.0%以上を占め、業界を支配しています。アジア太平洋地域の政府規制により、エネルギー効率の高い照明の需要が高まりが予想されます。
目次
第1章 調査手法と範囲
- 市場セグメンテーション
- 調査範囲と仮定
- 調査手法
- ボトムアップアプローチ
- トップダウンアプローチ
- データソースのリスト
- 略語のリスト
第2章 エグゼクティブサマリー
- 市場の概要
- 業界のスナップショットと主要な購入基準、2017年から2030年
- 市場の見通し
- セグメントの見通し
第3章 LEDドライバー業界の見通し
- 市場系統の見通し
- LEDドライバーの普及と成長見通しのマッピング
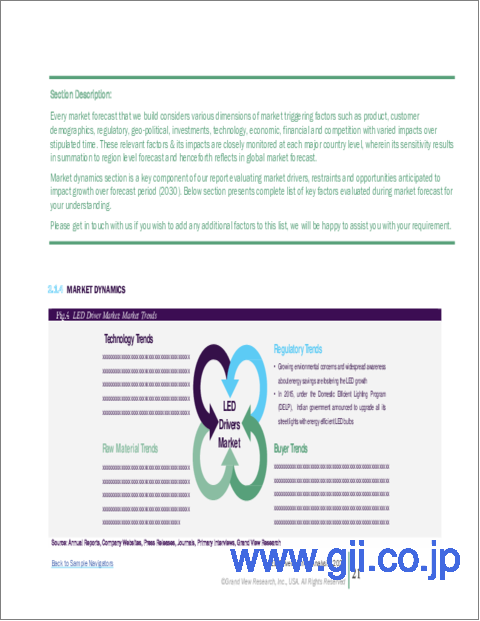
- LEDドライバーの市場動向
- LEDドライバー市場-バリューチェーン分析
- LEDドライバー市場力学
- 市場促進要因分析
- 効率的な照明技術に対する需要の高まり
- 一般照明アプリケーション全体でのLEDドライバーの需要の高まり
- LED照明とモノのインターネット(IoT)のますます収束する
- 市場抑制分析
- さまざまなメーカー間で共通の基準がない
- コンポーネント不足、関税、COVID-19パンデミックなどのマクロ経済ショックがLEDドライバーの価格に影響を与えた
- 市場機会分析
- スマートビルディングと作業スペースの数の増加
- ディスプレイパネルデバイスでのLEDドライバーの使用の増加
- 自動運転車でのLEDドライバーの使用の増加
- 市場促進要因分析
- LEDドライバー市場-ポーターのファイブフォース分析
- LEDドライバー市場PEST分析
- LEDドライバーの平均価格分析
- LED産業の技術動向
- 自動車用途におけるLEDの進歩
- LEDコンポーネントの製造におけるアップグレード
- LEDドライバーのユースケース
- LEDドライバー市場に対するCOVID-19の影響
- 主要な取引と戦略的提携分析
- 合弁事業とパートナーシップ
- 合併と買収
- 新製品開発
- 拡張
第4章 LEDドライバー市場:供給タイプの推定・動向分析
- 定電圧LEDドライバー市場、2017~2030年
- 定電流LEDドライバー市場、2017~2030年
第5章 LEDドライバー市場:アプリケーションタイプの推定・動向分析
- 自動車用LEDドライバー市場、2017~2030年
- 家庭用電化製品のLEDドライバー市場、2017年から2030年
- 照明LEDドライバー市場、2017年-2030年
- 屋外ディスプレイLEDドライバー市場、2017~2030年
第6章 LEDドライバー市場:地域の見通し
- 北米
- 北米のLEDドライバー市場、供給タイプ別、2017~2030年
- 北米のLEDドライバー市場、アプリケーションタイプ別、2017~2030年
- 米国
- 米国のLEDドライバー市場、供給タイプ別、2017~2030年
- 米国のLEDドライバー市場、アプリケーションタイプ別、2017~2030年
- カナダ
- カナダのLEDドライバー市場、供給タイプ別、2017~2030年
- カナダのLEDドライバー市場、アプリケーションタイプ別、2017~2030年
- 欧州
- 欧州のLEDドライバー市場、供給タイプ別、2017~2030年
- 欧州のLEDドライバー市場、アプリケーションタイプ別、2017~2030年
- 英国
- 英国のLEDドライバー市場、供給タイプ別、2017~2030年
- 英国のLEDドライバー市場、アプリケーションタイプ別、2017~2030年
- ドイツ
- ドイツのLEDドライバー市場、供給タイプ別、2017~2030年
- ドイツのLEDドライバー市場、アプリケーションタイプ別、2017~2030年
- フランス
- フランスのLEDドライバー市場、供給タイプ別、2017~2030年
- フランスのLEDドライバー市場、アプリケーションタイプ別、2017~2030年
- アジア太平洋地域
- アジア太平洋地域のLEDドライバー市場、供給タイプ別、2017年~2030年
- アジア太平洋地域のLEDドライバー市場、アプリケーションタイプ別、2017~2030年
- 中国
- 中国のLEDドライバー市場、供給タイプ別、2017~2030年
- 中国のLEDドライバー市場、アプリケーションタイプ別、2017~2030年
- インド
- インドのLEDドライバー市場、供給タイプ別、2017~2030年
- インドのLEDドライバー市場、アプリケーションタイプ別、2017~2030年
- 日本
- 日本のLEDドライバー市場、供給タイプ別、2017~2030年
- 日本のLEDドライバー市場、アプリケーションタイプ別、2017~2030年
- 韓国
- 韓国のLEDドライバー市場、供給タイプ別、2017~2030年
- 韓国のLEDドライバー市場、アプリケーションタイプ別、2017~2030年
- ラテンアメリカ
- ラテンアメリカのLEDドライバー市場、供給タイプ別、2017~2030年
- ラテンアメリカLEDドライバー市場、アプリケーションタイプ別、2017~2030年
- ブラジル
- ブラジルのLEDドライバー市場、供給タイプ別、2017~2030年
- ブラジルのLEDドライバー市場、アプリケーションタイプ別、2017~2030年
- メキシコ
- メキシコのLEDドライバー市場、供給タイプ別、2017~2030年
- メキシコのLEDドライバー市場、アプリケーションタイプ別、2017~2030年
- 中東とアフリカ
- MEA LEDドライバー市場、供給タイプ別、2017~2030年
- MEA LEDドライバー市場、アプリケーションタイプ別、2017~2030年
第7章 競合情勢
- ACE LEDS
- 会社概要
- 財務実績
- 製品のベンチマーク
- 戦略的イニシアチブ
- Microchip Technology, Inc
- 会社概要
- 財務実績
- 製品のベンチマーク
- 戦略的イニシアチブ
- Cree LED
- 会社概要
- 財務実績
- 製品のベンチマーク
- 戦略的イニシアチブ
- GE Current, a Daintree Company
- 会社概要
- 財務実績
- 製品のベンチマーク
- 戦略的イニシアチブ
- Signify Holdings
- 会社概要
- 財務実績
- 製品のベンチマーク
- 戦略的イニシアチブ
- SAMSUNG
- 会社概要
- 財務実績
- 製品のベンチマーク
- 戦略的イニシアチブ
- Lutron Electronics Co., Inc.
- 会社概要
- 財務実績
- 製品のベンチマーク
- 戦略的イニシアチブ
- Macroblock, Inc
- 会社概要
- 財務実績
- 製品のベンチマーク
- 戦略的イニシアチブ
- Maxim Integrated
- 会社概要
- 財務実績
- 製品のベンチマーク
- 戦略的イニシアチブ
- NXP Semiconductors
- 会社概要
- 財務実績
- 製品のベンチマーク
- 戦略的イニシアチブ
- Semiconductors Components Industries, LLC
- 会社概要
- 財務実績
- 製品のベンチマーク
- 戦略的イニシアチブ
- ams OSRAM
- 会社概要
- 財務実績
- 製品のベンチマーク
- 戦略的イニシアチブ
- ROHM Co., Ltd.
- 会社概要
- 財務実績
- 製品のベンチマーク
- 戦略的イニシアチブ
- STMicroelectronics NV
- 会社概要
- 財務実績
- 製品のベンチマーク
- 戦略的イニシアチブ
- Texas Instruments Incorporated
- 会社概要
- 財務実績
- 製品のベンチマーク
- 戦略的イニシアチブ
- Eaglerise Electric &Electronic(China)Co., Ltd.
- 会社概要
- 財務実績
- 製品のベンチマーク
- 戦略的イニシアチブ
- Lifud technology Co., Ltd
- 会社概要
- 財務実績
- 製品のベンチマーク
- 戦略的イニシアチブ
- BOKE Drivers Co., Ltd
- 会社概要
- 財務実績
- 製品のベンチマーク
- 戦略的イニシアチブ
- Shenzhen Xiezhen Electronics Co., Ltd
- 会社概要
- 財務実績
- 製品のベンチマーク
- 戦略的イニシアチブ
- MEAN WELL Enterprises Co., Ltd.
- 会社概要
- 財務実績
- 製品のベンチマーク
- 戦略的イニシアチブ
- Inventronics, Inc.
- 会社概要
- 財務実績
- 製品のベンチマーク
- 戦略的イニシアチブ
- Tridonic
- 会社概要
- 財務実績
- 製品のベンチマーク
- 戦略的イニシアチブ
- TCI Telecomunicazioni Italia Srl
- 会社概要
- 財務実績
- 製品のベンチマーク
- 戦略的イニシアチブ
List of Tables
- Table 1 Global LED driver market, 2017 - 2030 (USD Million)
- Table 2 Global LED driver market estimates and forecasts by region, 2017 - 2030 (USD Million)
- Table 3 Global LED driver market estimates and forecasts by supply type, 2017 - 2030 (USD Million)
- Table 4 Global LED driver market estimates and forecasts by application, 2017 - 2030 (USD Million)
- Table 5 Global constant voltage driver market by region 2017 - 2030 (USD Million)
- Table 6 Global constant current driver market by region 2017 - 2030 (USD Million)
- Table 7 Global automotive market by region 2017 - 2030 (USD Million)
- Table 8 Global consumer electronics market by region 2017 - 2030 (USD Million)
- Table 9 Global lighting market by region 2017 - 2030 (USD Million)
- Table 10 Global outdoor display market by region 2017 - 2030 (USD Million)
- Table 12 Global industrial market by region 2017 - 2030 (USD Million)
- Table 13 Global commercial market by region 2017 - 2030 (USD Million)
- Table 14 Global residential market by region 2017 - 2030 (USD Million)
- Table 15 North America LED driver market by supply type 2017 - 2030 (USD Million)
- Table 16 North America LED driver market by application 2017 - 2030 (USD Million)
- Table 17 U.S. LED driver market by supply type 2017 - 2030 (USD Million)
- Table 18 U.S. LED driver market by application 2017 - 2030 (USD Million)
- Table 19 Canada LED driver market by supply type 2017 - 2030 (USD Million)
- Table 20 Canada LED driver market by application 2017 - 2030 (USD Million)
- Table 21 Europe LED driver market by supply type 2017 - 2030 (USD Million)
- Table 22 Europe LED driver market by application 2017 - 2030 (USD Million)
- Table 23 U.K. LED driver market by supply type 2017 - 2030 (USD Million)
- Table 24 U.K. LED driver market by application 2017 - 2030 (USD Million)
- Table 25 Germany LED driver market by supply type 2017 - 2030 (USD Million)
- Table 26 Germany LED driver market by application 2017 - 2030 (USD Million)
- Table 27 France LED driver market by supply type 2017 - 2030 (USD Million)
- Table 28 France LED driver market by application 2017 - 2030 (USD Million)
- Table 29 Asia Pacific LED driver market by supply type 2017 - 2030 (USD Million)
- Table 30 Asia Pacific LED driver market by application 2017 - 2030 (USD Million)
- Table 31 China LED driver market by supply type 2017 - 2030 (USD Million)
- Table 32 China LED driver market by application 2017 - 2030 (USD Million)
- Table 33 India LED driver market by supply type 2017 - 2030 (USD Million)
- Table 34 India LED driver market by application 2017 - 2030 (USD Million)
- Table 35 Japan LED driver market by supply type 2017 - 2030 (USD Million)
- Table 36 Japan LED driver market by application 2017 - 2030 (USD Million)
- Table 37 South Korea LED driver market by supply type 2017 - 2030 (USD Million)
- Table 38 South Korea LED driver market by application 2017 - 2030 (USD Million)
- Table 39 Latin America LED driver market by supply type 2017 - 2030 (USD Million)
- Table 40 Latin America LED driver market by application 2017 - 2030 (USD Million)
- Table 41 Brazil LED driver market by supply type 2017 - 2030 (USD Million)
- Table 42 Brazil LED driver market by application 2017 - 2030 (USD Million)
- Table 43 Mexico LED driver market by supply type 2017 - 2030 (USD Million)
- Table 44 Mexico LED driver market by application 2017 - 2030 (USD Million)
- Table 45 MEA LED driver market by supply type 2017 - 2030 (USD Million)
- Table 46 MEA LED driver market by application 2017 - 2030 (USD Million)
List of Figures
- Fig. 1 Market segmentation
- Fig. 2 LED driver - Market size and growth prospects
- Fig. 3 LED driver - Value chain analysis
- Fig. 4 Market dynamics
- Fig. 5 Porter's Five Forces Analysis
- Fig. 6 Penetration & growth prospect mapping
- Fig. 7 Global company market share - 2021
- Fig. 8 North America company market share - 2021
- Fig. 9 LED driver - PESTEL analysis
- Fig. 10 LED driver market share by supply type, 2021 & 2030
- Fig. 11 Global constant voltage driver market 2017 - 2030 (USD Million)
- Fig. 12 Global constant current driver market 2017 - 2030 (USD Million)
- Fig. 13 LED driver market share by application, 2021 & 2030
- Fig. 14 Global automotive market 2017 - 2030 (USD Million)
- Fig. 15 Global consumer electronics market 2017 - 2030 (USD Million)
- Fig. 16 Global outdoor lighting market 2017 - 2030 (USD Million)
- Fig. 17 Global outdoor display market 2017 - 2030 (USD Million)
- Fig. 18 Global industrial market 2017 - 2030 (USD Million)
- Fig. 19 Global commercial market 2017 - 2030 (USD Million)
- Fig. 20 Global market for LED drivers in residential 2017 - 2030 (USD Million)
- Fig. 21 LED driver market share by region, 2017 & 2030
LED Driver Market Growth & Trends:
The global LED driver market size is estimated to reach USD 30.8 billion by 2030, according to a new report by Grand View Research, Inc. The market is expected to witness a CAGR of 23.5% from 2022 to 2030. LEDs have evolved as an energy-efficient alternative for conventional light sources during the last decade, and their use in lighting and display segments across industries is increasing.
LED lighting equipment is increasingly replacing traditional lighting products due to a variety of advantages, including longer life, higher energy efficiency, better environmental friendliness, miniaturization, reduced heat output, and directionality. Furthermore, the increasing number of smart buildings and homes in developed countries is driving up demand for IoT-based linked lighting systems. Several governments have initiated Smart City efforts to increase the energy savings of inhabited cities, which is expected to further boost the market.
From 2017 to 2021, the demand for constant current LED drivers grew at an exponential rate; these drivers are frequently employed in high-brightness and exterior lighting applications. The LED driver's major application segment is consumer electronics; demand for LEDs has surged in the television and display panel segments. Leading manufacturers are cooperating with other companies to supply public lighting systems that are connected to remote management for energy savings and efficient maintenance in towns all over the world.
For instance, in November 2021, Lutron Electronics Co., Inc. announced the launch of RadioRA 3. It is a lighting control system that connects a wide variety of connected domestic products-keypads, switches, and capacitive touch dimmers to a contemporary light bar design. RadioRA 3 revolutionized how installers and consumers experience home lighting systems with the line of wall controls, including IoT (Internet of Things) connectivity and light bar design.
For applications in the low- to mid-power range, there is a growing demand for a driver with reduced power loss, a smaller system package, and lower cost while yet delivering good dependability. LED Driver manufacturers have been implementing Primary-Side Regulation (PSR) to reduce costs by removing secondary response circuitry, as well as Power-Factor Correction associated electronics, for greater power quality, to meet the criteria of cost reduction.
LED Driver Market Report Highlights:
- The constant current segment is anticipated to witness a CAGR of over 23.9% from 2022 to 2030. For general lighting applications, the constant current driver is more reliable than a constant voltage driver
- The lighting segment is anticipated to witness a CAGR of nearly 26.0% over the forecast period, owing to the increased investments in Europe and the Asia Pacific
- Asia Pacific dominated the industry contributing to over 44.0% of the global revenue in 2021. Government regulations in the Asia Pacific are likely to increase the demand for energy-efficient lighting
Table of Contents
Chapter 1. Methodology and Scope
- 1.1. Market Segmentation
- 1.2. Research Scope & Assumption
- 1.3. Research Methodology
- 1.3.1. Bottom-up Approach
- 1.3.2. Top-Down Approach
- 1.4. List of Data Sources
- 1.5. List of Abbreviations
Chapter 2. Executive Summary
- 2.1. Market Summary
- 2.2. Industry Snapshot and Key Buying Criteria, 2017 - 2030
- 2.3. Market Outlook
- 2.4. Segmental Outlook
Chapter 3. LED Driver Industry Outlook
- 3.1. Market Lineage Outlook
- 3.2. LED Driver penetration & growth prospects mapping
- 3.3. LED Drivers Market Trends
- 3.4. LED Driver Market - Value Chain Analysis
- 3.5. LED Driver Market Dynamics
- 3.5.1. Market driver analysis
- 3.5.1.1. Growing demand for efficient lighting technology
- 3.5.1.2. Rising demand for LED drivers across general lighting applications
- 3.5.1.3. The growing convergence of LED lighting and the Internet of Things (IoT)
- 3.5.2. Market restraint analysis
- 3.5.2.1. Lack of common standards among various manufacturers
- 3.5.2.2. Macroeconomic shocks such as component shortages, tariffs, and the COVID-19 pandemic affected the pricing of LED Drivers
- 3.5.3. Market opportunity analysis
- 3.5.3.1. The growing number of Smart Buildings and working spaces
- 3.5.3.2. Increasing use of LED Drivers in Display panels devices
- 3.5.3.3. The growing use of LED Drivers in Autonomous vehicles
- 3.5.1. Market driver analysis
- 3.6. LED Drivers Market - Porter's Five Forces Analysis
- 3.7. LED Drivers Market - PEST analysis
- 3.8. Average Pricing Analysis of LED Drivers
- 3.9. Technology Trends in LED Industry
- 3.9.1. Advancements of LED in Automotive Applications
- 3.9.2. Upgrades in the manufacturing of LED components
- 3.9.3. Use Cases on LED Drivers
- 3.10. Impact of COVID-19 on LED Drivers Market
- 3.11. Major deals and Strategic Alliances Analysis
- 3.11.1. Joint Ventures and Partnerships
- 3.11.2. Mergers and Acquisitions
- 3.11.3. New Product Developments
- 3.11.4. Expansion
Chapter 4. LED Driver Market: Supply Type Estimates & Trend Analysis
- 4.1. Constant voltage LED driver market, 2017 - 2030 (USD million)
- 4.2. Constant current LED driver market, 2017 - 2030 (USD million)
Chapter 5. LED Driver Market: Application Type Estimates & Trend Analysis
- 5.1. Automotive LED driver market, 2017 - 2030 (USD million)
- 5.2. Consumer electronics LED driver market, 2017 - 2030 (USD million)
- 5.3. Lighting LED driver market, 2017 - 2030 (USD million)
- 5.4. Outdoor display LED driver market, 2017 - 2030 (USD million)
Chapter 6. LED Driver Market: Regional Outlook
- 6.1. North America
- 6.1.1. North America LED driver market, by supply type, 2017 - 2030 (USD million)
- 6.1.2. North America LED driver market, by application type, 2017 - 2030 (USD million)
- 6.1.3. U.S.
- 6.1.3.1. U.S. LED driver market, by supply type, 2017 - 2030 (USD million)
- 6.1.3.2. U.S. LED driver market, by application type, 2017 - 2030 (USD million)
- 6.1.4. Canada
- 6.1.4.1. Canada LED driver market, by supply type, 2017 - 2030 (USD million)
- 6.1.4.2. Canada LED driver market, by application type, 2017 - 2030 (USD million)
- 6.2. Europe
- 6.2.1. Europe LED driver market, by supply type, 2017 - 2030 (USD million)
- 6.2.2. Europe LED driver market, by application type, 2017 - 2030 (USD million)
- 6.2.3. U.K.
- 6.2.3.1. U.K. LED driver market, by supply type, 2017 - 2030 (USD million)
- 6.2.3.2. U.K. LED driver market, by application type, 2017 - 2030 (USD million)
- 6.2.4. Germany
- 6.2.4.1. Germany LED driver market, by supply type, 2017 - 2030 (USD million)
- 6.2.4.2. Germany LED driver market, by application type, 2017 - 2030 (USD million)
- 6.2.5. France
- 6.2.5.1. France LED driver market, by supply type, 2017 - 2030 (USD million)
- 6.2.5.2. France LED driver market, by application type, 2017 - 2030 (USD million)
- 6.3. Asia Pacific
- 6.3.1. Asia Pacific LED driver market, by supply type, 2017 - 2030 (USD million)
- 6.3.2. Asia Pacific LED driver market, by application type, 2017 - 2030 (USD million)
- 6.3.3. China
- 6.3.3.1. China LED driver market, by supply type, 2017 - 2030 (USD million)
- 6.3.3.2. China LED driver market, by application type, 2017 - 2030 (USD million)
- 6.3.4. India
- 6.3.4.1. India LED driver market, by supply type, 2017 - 2030 (USD million)
- 6.3.4.2. India LED driver market, by application type, 2017 - 2030 (USD million)
- 6.3.5. Japan
- 6.3.5.1. Japan LED driver market, by supply type, 2017 - 2030 (USD million)
- 6.3.5.2. Japan LED driver market, by application type, 2017 - 2030 (USD million)
- 6.3.6. South Korea
- 6.3.6.1. South Korea LED driver market, by supply type, 2017 - 2030 (USD million)
- 6.3.6.2. South Korea LED driver market, by application type, 2017 - 2030 (USD million)
- 6.4. Latin America
- 6.4.1. Latin America LED driver market, by supply type, 2017 - 2030 (USD million)
- 6.4.2. Latin America LED driver market, by application type, 2017 - 2030 (USD million)
- 6.4.3. Brazil
- 6.4.3.1. Brazil LED driver market, by supply type, 2017 - 2030 (USD million)
- 6.4.3.2. Brazil LED driver market, by application type, 2017 - 2030 (USD million)
- 6.4.4. Mexico
- 6.4.4.1. Mexico LED driver market, by supply type, 2017 - 2030 (USD million)
- 6.4.4.2. Mexico LED driver market, by application type, 2017 - 2030 (USD million)
- 6.5. Middle East & Africa
- 6.5.1. MEA LED driver market, by supply type, 2017 - 2030 (USD million)
- 6.5.2. MEA LED driver market, by application type, 2017 - 2030 (USD million)
Chapter 7. Competitive Landscape
- 7.1. ACE LEDS
- 7.1.1. Company Overview
- 7.1.2. Financial Performance
- 7.1.3. Product Benchmarking
- 7.1.4. Strategic Initiatives
- 7.2. Microchip Technology, Inc
- 7.2.1. Company Overview
- 7.2.2. Financial Performance
- 7.2.3. Product Benchmarking
- 7.2.4. Strategic Initiatives
- 7.3. Cree LED
- 7.3.1. Company Overview
- 7.3.2. Financial Performance
- 7.3.3. Product Benchmarking
- 7.3.4. Strategic Initiatives
- 7.4. GE Current, a Daintree Company
- 7.4.1. Company Overview
- 7.4.2. Financial Performance
- 7.4.3. Product Benchmarking
- 7.4.4. Strategic Initiatives
- 7.5. Signify Holdings
- 7.5.1. Company Overview
- 7.5.2. Financial Performance
- 7.5.3. Product Benchmarking
- 7.5.4. Strategic Initiatives
- 7.6. SAMSUNG
- 7.6.1. Company Overview
- 7.6.2. Financial Performance
- 7.6.3. Product Benchmarking
- 7.6.4. Strategic Initiatives
- 7.7. Lutron Electronics Co., Inc.
- 7.7.1. Company Overview
- 7.7.2. Financial Performance
- 7.7.3. Product Benchmarking
- 7.7.4. Strategic Initiatives
- 7.8. Macroblock, Inc
- 7.8.1. Company Overview
- 7.8.2. Financial Performance
- 7.8.3. Product Benchmarking
- 7.8.4. Strategic Initiatives
- 7.9. Maxim Integrated
- 7.9.1. Company Overview
- 7.9.2. Financial Performance
- 7.9.3. Product Benchmarking
- 7.9.4. Strategic Initiatives
- 7.10. NXP Semiconductors
- 7.10.1. Company Overview
- 7.10.2. Financial Performance
- 7.10.3. Product Benchmarking
- 7.10.4. Strategic Initiatives
- 7.11. Semiconductors Components Industries, LLC
- 7.11.1. Company Overview
- 7.11.2. Financial Performance
- 7.11.3. Product Benchmarking
- 7.11.4. Strategic Initiatives
- 7.12. ams OSRAM
- 7.12.1. Company Overview
- 7.12.2. Financial Performance
- 7.12.3. Product Benchmarking
- 7.12.4. Strategic Initiatives
- 7.13. ROHM Co., Ltd.
- 7.13.1. Company Overview
- 7.13.2. Financial Performance
- 7.13.3. Product Benchmarking
- 7.13.4. Strategic Initiatives
- 7.14. STMicroelectronics N.V.
- 7.14.1. Company Overview
- 7.14.2. Financial Performance
- 7.14.3. Product Benchmarking
- 7.14.4. Strategic Initiatives
- 7.15. Texas Instruments Incorporated
- 7.15.1. Company Overview
- 7.15.2. Financial Performance
- 7.15.3. Product Benchmarking
- 7.15.4. Strategic Initiatives
- 7.16. Eaglerise Electric & Electronic (China) Co., Ltd.
- 7.16.1. Company Overview
- 7.16.2. Financial Performance
- 7.16.3. Product Benchmarking
- 7.16.4. Strategic Initiatives
- 7.17. Lifud technology Co., Ltd
- 7.17.1. Company Overview
- 7.17.2. Financial Performance
- 7.17.3. Product Benchmarking
- 7.17.4. Strategic Initiatives
- 7.18. BOKE Drivers Co., Ltd
- 7.18.1. Company Overview
- 7.18.2. Financial Performance
- 7.18.3. Product Benchmarking
- 7.18.4. Strategic Initiatives
- 7.19. Shenzhen Xiezhen Electronics Co., Ltd
- 7.19.1. Company Overview
- 7.19.2. Financial Performance
- 7.19.3. Product Benchmarking
- 7.19.4. Strategic Initiatives
- 7.20. MEAN WELL Enterprises Co., Ltd.
- 7.20.1. Company Overview
- 7.20.2. Financial Performance
- 7.20.3. Product Benchmarking
- 7.20.4. Strategic Initiatives
- 7.21. Inventronics, Inc.
- 7.21.1. Company Overview
- 7.21.2. Financial Performance
- 7.21.3. Product Benchmarking
- 7.21.4. Strategic Initiatives
- 7.22. Tridonic
- 7.22.1. Company Overview
- 7.22.2. Financial Performance
- 7.22.3. Product Benchmarking
- 7.22.4. Strategic Initiatives
- 7.23. TCI Telecomunicazioni Italia Srl
- 7.23.1. Company Overview
- 7.23.2. Financial Performance
- 7.23.3. Product Benchmarking
- 7.23.4. Strategic Initiatives