|
|
市場調査レポート
商品コード
1268626
自動車用粘着テープの市場規模、シェア、動向分析レポート:用途別(パワートレイン、エレクトロニクス)、粘着化学別(溶剤ベース、エマルジョンベース)、地域別、セグメント予測、2023~2030年Automotive Adhesive Tapes Market Size, Share & Trends Analysis Report By Application (Powertrain, Electronics), By Adhesive Chemistry (Solvent-based, Emulsion-based) By Region, And Segment Forecasts, 2023 - 2030 |
||||||
|
|
|||||||
|
● お客様のご希望に応じて、既存データの加工や未掲載情報(例:国別セグメント)の追加などの対応が可能です。 詳細はお問い合わせください。 |
|||||||


| 自動車用粘着テープの市場規模、シェア、動向分析レポート:用途別(パワートレイン、エレクトロニクス)、粘着化学別(溶剤ベース、エマルジョンベース)、地域別、セグメント予測、2023~2030年 |
|
出版日: 2023年04月06日
発行: Grand View Research
ページ情報: 英文 133 Pages
納期: 2~10営業日
|
- 全表示
- 概要
- 図表
- 目次
自動車用粘着テープの市場成長と動向:
Grand View Research, Inc.の最新レポートによると、自動車用粘着テープの世界市場規模は2030年までに54億7,000万米ドルに達すると予測されています。
2023年から2030年までのCAGRは6.0%で拡大すると予測されています。美観の向上、軽量化、車両の性能向上を目的とした高度機能性材料の使用量の増加が、市場を牽引すると予想されます。
米国などの先進国市場からインドなどの新興国市場に至るまで、自動車分野には明るい展望が広がっています。技術開拓や自動車の性能向上により、専用部品の装着が進んでおり、自動車用テープ市場にも好影響を与えると予想されます。
電気自動車の普及と需要の高まりにより、市場の動向は切り替わってきています。著名な自動車メーカーは、自動車の汚染物質をかなりのレベルで削減することで、環境基準や排ガス規制を遵守することを目指しています。そのため、自動車や軽トラックなどのバッテリー駆動の自動車は世界中で人気を集めており、自動車用粘着テープの普及を促進すると予想されます。
自動車用粘着テープの市場レポートハイライト
- 自動車の美観を向上させるための内装用途のテープ需要の高まりにより、内装貼付用途のセグメントは2022年に9億8,830万米ドルの売上を占めました。
- エマルジョン系粘着テープは、VOC排出に関する懸念が高まっており、将来的に規制が厳しくなることが予想されるため、予測期間中、収益CAGR 8.2%で最も速い成長が見込まれています。
- パワートレイン用途は、電気自動車やハイブリッド車のパワートレインへの粘着テープの普及が進んでいることから、予測期間中に11.3%の収益CAGRを記録すると予想されます。
- 欧州は、欧州の自動車ブランドにおけるテープの車両あたりの含有率が高いため、収益面で市場を独占し、2022年には9億5,960万米ドルと評価されました。
- この市場で事業を展開するメーカーは、将来的な市場の可能性を測るために、自動車におけるテープの新たなサブセグメント用途を理解することに期待しています。
目次
第1章 調査手法と範囲
- 市場セグメンテーションと範囲
- 市場の定義
- 情報調達
- 購入したデータベース
- GVRの内部データベース
- 二次情報と第三者の視点
- 1次調査
- 情報分析
- データ分析モデル
- 市場の形成とデータの視覚化
- データの検証と公開
第2章 エグゼクティブサマリー
- 市場の見通し
- セグメント別の見通し
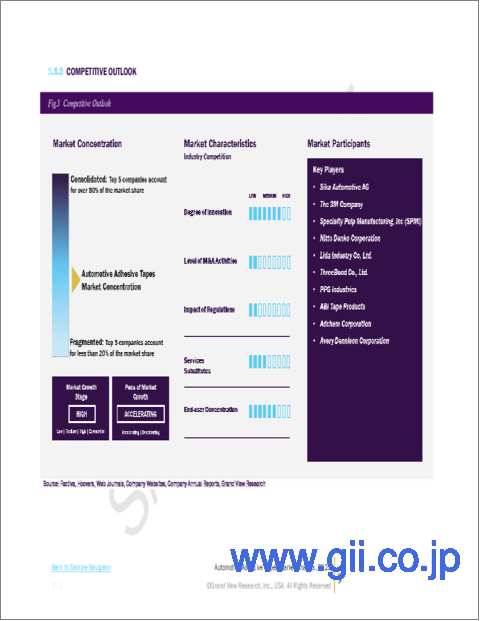
- 競合考察
第3章 市場変数、動向、および範囲
- 市場の付随的な見通し
- 業界のバリューチェーン分析
- 技術概要
- 規制の枠組み
- 市場力学
- 市場促進要因の分析
- 市場抑制要因分析
- 業界の課題
- 市場成長機会
- ビジネス環境ツール分析:自動車用粘着テープ市場
- ポーターのファイブフォース分析
- サプライヤーパワー
- 買い手の交渉力
- 代替の脅威
- 新規参入業者の脅威
- 競争企業間の敵対関係
- SWOT別PESTEL分析
- 政治的情勢
- 経済情勢
- 社会的情勢
- テクノロジーの情勢
- 環境情勢
- 法的情勢
- ポーターのファイブフォース分析
- 市場破壊分析
第4章 自動車用粘着テープ市場:用途推定・動向分析
- 重要なポイント
- 用途市場シェア分析、2022年および2030年
- ワイヤーハーネス
- パワートレイン
- 防音材
- 内装アタッチメント
- 外装アタッチメント
- エレクトロニクス
- シャーシとホイール
第5章 自動車用粘着テープ市場:粘着化学推定・動向分析
- 重要なポイント
- 粘着化学市場シェア分析、2022年および2030年
- 溶剤系接着剤
- エマルジョン系接着剤
- ホットメルト接着剤
- 放射線接着剤
第6章 自動車用粘着テープ市場:地域推定・動向分析
- 地域市場のスナップショット
- 地域トップ5社
- 北米
- 欧州
- アジア太平洋地域
- 世界のその他の地域
- 重要なポイント
- 粘着化学市場シェア分析、2022年および2030年
- 北米
- 米国
- カナダ
- メキシコ
- 欧州
- 英国
- ドイツ
- フランス
- イタリア
- スペイン
- アジア太平洋地域
- 中国
- インド
- 日本
- 韓国
- 世界のその他の地域
第7章 競合情勢
- 主要企業、その最近の展開、および業界への影響
- 主要企業/競合の分類
- 企業の市況分析
- 企業ヒートマップ分析
- 企業の市場シェア分析、2022年
- 戦略マッピング
- 会社一覧
- L&L Products, Inc.
- 会社概要
- 財務実績
- 製品のベンチマーク
- 戦略的取り組み
- Sika Automotive AG
- 会社概要
- 財務実績
- 製品のベンチマーク
- 戦略的取り組み
- The 3M Company
- 会社概要
- 財務実績
- 製品のベンチマーク
- 戦略的取り組み
- Specialty Pulp Manufacturing, Inc(SPMI)
- 会社概要
- 財務実績
- 製品のベンチマーク
- 戦略的取り組み
- Nitto Denko Corporation
- 会社概要
- 財務実績
- 製品のベンチマーク
- 戦略的取り組み
- Lida Industry Co, Ltd.
- 会社概要
- 財務実績
- 製品のベンチマーク
- 戦略的取り組み
- ThreeBond Co., Ltd.
- 会社概要
- 財務実績
- 製品のベンチマーク
- 戦略的取り組み
- PPG Industries
- 会社概要
- 財務実績
- 製品のベンチマーク
- 戦略的取り組み
- ABI Tape Products
- 会社概要
- 財務実績
- 製品のベンチマーク
- 戦略的取り組み
- Adchem Corporation
- 会社概要
- 財務実績
- 製品のベンチマーク
- 戦略的取り組み
- Avery Dennison Corporation
- 会社概要
- 財務実績
- 製品のベンチマーク
- 戦略的取り組み
- Saint Gobain
- 会社概要
- 財務実績
- 製品のベンチマーク
- 戦略的取り組み
- Berry Plastics
- 会社概要
- 財務実績
- 製品のベンチマーク
- 戦略的取り組み
- tesa SE
- 会社概要
- 財務実績
- 製品のベンチマーク
- 戦略的取り組み
- Lintec Corporation
- 会社概要
- 財務実績
- 製品のベンチマーク
- 戦略的取り組み
- Advanced Tapes International Ltd.
- 会社概要
- 財務実績
- 製品のベンチマーク
- 戦略的取り組み
- Scapa
- 会社概要
- 財務実績
- 製品のベンチマーク
- 戦略的取り組み
- Intertape Polymer Group
- 会社概要
- 財務実績
- 製品のベンチマーク
- 戦略的取り組み
- Shurtape
- 会社概要
- 財務実績
- 製品のベンチマーク
- 戦略的取り組み
- Henkel AG
- 会社概要
- 財務実績
- 製品のベンチマーク
- 戦略的取り組み
- L&L Products, Inc.
List of Tables
- Table 1 Automotive Adhesive Tape market estimates and forecasts, by application, 2018 - 2030 (Million Square Meters)
- Table 2 Automotive Adhesive Tape market estimates and forecasts, by application, 2018 - 2030 (USD Million)
- Table 3 Automotive Adhesive Tape market estimates and forecasts, by adhesive chemistry, 2018 - 2030 (USD Million)
- Table 4 Automotive Adhesive Tape market estimates and forecasts, by adhesive chemistry, 2018 - 2030 (USD Million)
List of Figures
- Fig. 1 Market segmentation & scope
- Fig. 2 Information procurement
- Fig. 3 Primary research pattern
- Fig. 4 Primary research process
- Fig. 5 Market research approaches - Bottom-Up Approach
- Fig. 6 Market research approaches - Top-Down Approach
- Fig. 7 Market research approaches - Combined Approach
- Fig. 8 Regional Outlook
- Fig. 9 Segmental Outlook
- Fig. 10 Competitive Outlook
- Fig. 11 Automotive adhesive tapes market - Penetration & growth prospect mapping (Million Square Meters) (USD Million)
- Fig. 12 Automotive adhesive tapes market - Value chain analysis
- Fig. 13 Automotive adhesive tapes - Market dynamics
- Fig. 14 Automotive adhesive tapes market - Market driver impact analysis
- Fig. 15 Automotive adhesive tapes market - Market restraint impact analysis
- Fig. 16 Automotive adhesive tapes market estimates and forecasts, by wire harnessing, 2018 - 2030 (Million Square Meters) (USD Million)
- Fig. 17 Automotive adhesive tapes market estimates and forecasts, by powertrain, 2018 - 2030 (Million Square Meters) (USD Million)
- Fig. 18 Automotive adhesive tapes market estimates and forecasts, by acoustic insulation, 2018 - 2030 (Million Square Meters) (USD Million)
- Fig. 19 Automotive adhesive tapes market estimates and forecasts, by interior attachment, 2018 - 2030 (Million Square Meters) (USD Million)
- Fig. 20 Automotive adhesive tapes market estimates and forecasts, by exterior attachment, 2018 - 2030 (Million Square Meters) (USD Million)
- Fig. 21 Automotive adhesive tapes market estimates and forecasts, by electronics, 2018 - 2030 (Million Square Meters) (USD Million)
- Fig. 22 Automotive adhesive tapes market estimates and forecasts, by chassis & wheels, 2018 - 2030 (Million Square Meters) (USD Million)
- Fig. 23 Automotive adhesive tapes market estimates and forecasts, by solvent-based adhesive, 2018 - 2030 (Million Square Meters) (USD Million)
- Fig. 24 Automotive adhesive tapes market estimates and forecasts, by emulsion-based adhesive, 2018 - 2030 (Million Square Meters) (USD Million)
- Fig. 25 Automotive adhesive tapes market estimates and forecasts, by hot melt adhesive, 2018 - 2030 (Million Square Meters) (USD Million)
- Fig. 26 Automotive adhesive tapes market estimates and forecasts, by radiation adhesive, 2018 - 2030 (Million Square Meters) (USD Million)
- Fig. 27 North America automotive adhesive tapes market estimates and forecasts, 2018 - 2030 (Million Square Meters) (USD Million)
- Fig. 28 U.S. automotive adhesive tapes market estimates and forecasts, 2018 - 2030 (Million Square Meters) (USD Million)
- Fig. 29 Canada automotive adhesive tapes market estimates and forecasts, 2018 - 2030 (Million Square Meters) (USD Million)
- Fig. 30 Mexico automotive adhesive tapes market estimates and forecasts, 2018 - 2030 (Million Square Meters) (USD Million)
- Fig. 31 Europe automotive adhesive tapes market estimates and forecasts, 2018 - 2030 (Million Square Meters) (USD Million)
- Fig. 32 U.K. automotive adhesive tapes market estimates and forecasts, 2018 - 2030 (Million Square Meters) (USD Million)
- Fig. 33 Germany automotive adhesive tapes market estimates and forecasts, 2018 - 2030 (Million Square Meters) (USD Million)
- Fig. 34 France automotive adhesive tapes market estimates and forecasts, 2018 - 2030 (Million Square Meters) (USD Million)
- Fig. 35 Italy automotive adhesive tapes market estimates and forecasts, 2018 - 2030 (Million Square Meters) (USD Million)
- Fig. 36 Spain automotive adhesive tapes market estimates and forecasts, 2018 - 2030 (Million Square Meters) (USD Million)
- Fig. 37 Asia Pacific automotive adhesive tapes market estimates and forecasts, 2018 - 2030 (Million Square Meters) (USD Million)
- Fig. 38 China automotive adhesive tapes market estimates and forecasts, 2018 - 2030 (Million Square Meters) (USD Million)
- Fig. 39 India automotive adhesive tapes market estimates and forecasts, 2018 - 2030 (Million Square Meters) (USD Million)
- Fig. 40 Japan automotive adhesive tapes market estimates and forecasts, 2018 - 2030 (Million Square Meters) (USD Million)
- Fig. 41 South Korea automotive adhesive tapes market estimates and forecasts, 2018 - 2030 (Million Square Meters) (USD Million)
- Fig. 42 Rest of World automotive adhesive tapes market estimates and forecasts, 2018 - 2030 (Million Square Meters) (USD Million)
Automotive Adhesive Tapes Market Growth & Trends:
The global automotive adhesive tapes market size is expected to reach USD 5.47 billion by 2030, according to a new report by Grand View Research, Inc. The market is expected to expand at a CAGR of 6.0% from 2023 to 2030. Growing usage of advanced functional materials to improve aesthetics, reduce weight and enhance the performance of the vehicles is expected to drive the market.
There has been a positive outlook in the automotive sector across the developed markets such as the U.S. to developing markets such as India. Technological developments and performance enhancements in vehicles have led to the installation of specialized components, which is expected to have a positive impact on the automotive tapes market.
The market is witnessing switching trends with growing popularity and demand for electric vehicles. Prominent vehicle manufacturers are aiming to comply with environmental standards and emission norms by reducing vehicle pollutants at a significant level. Thus, battery-operated vehicles including cars, mini trucks, and others are gaining popularity across the globe, which in turn is expected to drive the penetration of automotive adhesive tapes.
Automotive Adhesive Tapes Market Report Highlights:
- The interior attachment application segment accounted for revenue valued at USD 988.3 million in 2022 owing to rising demand for tapes in interior applications to improve the aesthetics of vehicles
- The emulsion-based adhesive tapes segment is expected to witness the fastest growth at a revenue CAGR of 8.2% over the forecast period as the industry is witnessing rising concerns of VOC emissions and thus expect stringent regulations pertaining to the same in the future
- The powertrain application segment is expected to witness a notable revenue CAGR of 11.3% over the forecast period on account of the rising penetration of adhesive tapes in electric and hybrid vehicle powertrains
- Europe dominated the market in terms of revenue and was valued at USD 959.6 million in 2022, owing to the high per vehicle content of tapes in the European automotive brands
- Manufacturers operating in the market are looking forward to understand the emerging sub-segment application of tapes in vehicles to gauge the market potential in the future
Table of Contents
Chapter 1. Methodology and Scope
- 1.1. Market Segmentation & Scope
- 1.2. Market Definition
- 1.3. Information Procurement
- 1.3.1. Purchased Database
- 1.3.2. GVR's Internal Database
- 1.3.3. Secondary Sources & Third-Party Perspectives
- 1.3.4. Primary Research
- 1.4. Information Analysis
- 1.4.1. Data Analysis Models
- 1.5. Market Formulation & Data Visualization
- 1.6. Data Validation & Publishing
Chapter 2. Executive Summary
- 2.1. Market Outlook
- 2.2. Segmental Outlook
- 2.3. Competitive Insights
Chapter 3. Market Variables, Trends, and Scope
- 3.1. Market Ancillary Outlook
- 3.2. Industry Value Chain Analysis
- 3.3. Technology Overview
- 3.4. Regulatory Framework
- 3.5. Market Dynamics
- 3.5.1. Market Driver Analysis
- 3.5.2. Market Restraint Analysis
- 3.5.3. Industry challenges
- 3.5.4. Market Growth Opportunities
- 3.6. Business Environmental Tool Analysis: Automotive Adhesive Tapes Market
- 3.6.1. Porter's Five Forces Analysis
- 3.6.1.1. Supplier Power
- 3.6.1.2. Buyer Power
- 3.6.1.3. Substitution Threat
- 3.6.1.4. Threat of New Entrants
- 3.6.1.5. Competitive Rivalry
- 3.6.2. PESTEL Analysis by SWOT
- 3.6.2.1. Political Landscape
- 3.6.2.2. Economic Landscape
- 3.6.2.3. Social Landscape
- 3.6.2.4. Technology Landscape
- 3.6.2.5. Environmental Landscape
- 3.6.2.6. Legal Landscape
- 3.6.1. Porter's Five Forces Analysis
- 3.7. Market Disruption Analysis
Chapter 4. Automotive Adhesive Tapes Market: Application Estimates & Trend Analysis
- 4.1. Key Takeaways
- 4.2. Application Market Share Analysis, 2022 & 2030
- 4.3. Wire Harnessing
- 4.3.1. Market estimates and forecasts, 2018 - 2030 (Million Square Meters) (USD Million)
- 4.4. Power Train
- 4.4.1. Market estimates and forecasts, 2018 - 2030 (Million Square Meters) (USD Million)
- 4.5. Acoustic Insulation
- 4.5.1. Market estimates and forecasts, 2018 - 2030 (Million Square Meters) (USD Million)
- 4.6. Interior Attachment
- 4.6.1. Market estimates and forecasts, 2018 - 2030 (Million Square Meters) (USD Million)
- 4.7. Exterior Attachment
- 4.7.1. Market estimates and forecasts, 2018 - 2030 (Million Square Meters) (USD Million)
- 4.8. Electronics
- 4.8.1. Market estimates and forecasts, 2018 - 2030 (Million Square Meters) (USD Million)
- 4.9. Chassis & Wheels
- 4.9.1. Market estimates and forecasts, 2018 - 2030 (Million Square Meters) (USD Million)
Chapter 5. Automotive Adhesive Tapes Market: Adhesive Chemistry Estimates & Trend Analysis
- 5.1. Key Takeaways
- 5.2. Adhesive Chemistry Market Share Analysis, 2022 & 2030
- 5.3. Solvent-based Adhesives
- 5.3.1. Market estimates and forecasts, 2018 - 2030 (Million Square Meters) (USD Million)
- 5.4. Emulsion-based Adhesives
- 5.4.1. Market estimates and forecasts, 2018 - 2030 (Million Square Meters) (USD Million)
- 5.5. Hot Melt Adhesives
- 5.5.1. Market estimates and forecasts, 2018 - 2030 (Million Square Meters) (USD Million)
- 5.6. Radiation Adhesives
- 5.6.1. Market estimates and forecasts, 2018 - 2030 (Million Square Meters) (USD Million)
Chapter 6. Automotive Adhesive Tapes Market: Regional Estimates & Trend Analysis
- 6.1. Regional Market Snapshot
- 6.2. Regional Top Five Players
- 6.2.1. North America
- 6.2.2. Europe
- 6.2.3. Asia Pacific
- 6.2.4. Rest of World
- 6.3. Key Takeaways
- 6.4. Adhesive Chemistry Market Share Analysis, 2022 & 2030
- 6.5. North America
- 6.5.1. Market estimates and forecasts, 2018 - 2030 (Million Square Meters) (USD Million)
- 6.5.2. U.S.
- 6.5.2.1. Market estimates and forecasts, 2018 - 2030 (Million Square Meters) (USD Million)
- 6.5.3. Canada
- 6.5.3.1. Market estimates and forecasts, 2018 - 2030 (Million Square Meters) (USD Million)
- 6.5.4. Mexico
- 6.5.4.1. Market estimates and forecasts, 2018 - 2030 (Million Square Meters) (USD Million)
- 6.6. Europe
- 6.6.1. Market estimates and forecasts, 2018 - 2030 (Million Square Meters) (USD Million)
- 6.6.2. U.K.
- 6.6.2.1. Market estimates and forecasts, 2018 - 2030 (Million Square Meters) (USD Million)
- 6.6.3. Germany
- 6.6.3.1. Market estimates and forecasts, 2018 - 2030 (Million Square Meters) (USD Million)
- 6.6.4. France
- 6.6.4.1. Market estimates and forecasts, 2018 - 2030 (Million Square Meters) (USD Million)
- 6.6.5. Italy
- 6.6.5.1. Market estimates and forecasts, 2018 - 2030 (Million Square Meters) (USD Million)
- 6.6.6. Spain
- 6.6.6.1. Market estimates and forecasts, 2018 - 2030 (Million Square Meters) (USD Million)
- 6.7. Asia Pacific
- 6.7.1. Market estimates and forecasts, 2018 - 2030 (Million Square Meters) (USD Million)
- 6.7.2. China
- 6.7.2.1. Market estimates and forecasts, 2018 - 2030 (Million Square Meters) (USD Million)
- 6.7.3. India
- 6.7.3.1. Market estimates and forecasts, 2018 - 2030 (Million Square Meters) (USD Million)
- 6.7.4. Japan
- 6.7.4.1. Market estimates and forecasts, 2018 - 2030 (Million Square Meters) (USD Million)
- 6.7.5. South Korea
- 6.7.5.1. Market estimates and forecasts, 2018 - 2030 (Million Square Meters) (USD Million)
- 6.8. Rest of World
- 6.8.1. Market estimates and forecasts, 2018 - 2030 (Million Square Meters) (USD Million)
Chapter 7. Competitive Landscape
- 7.1. Key Players, their Recent Developments, and Their Impact on the Industry
- 7.2. Key Company/Competition Categorization
- 7.3. Company Market Position Analysis
- 7.4. Company Heat Map Analysis
- 7.5. Company Market Share Analysis, 2022
- 7.6. Strategy Mapping
- 7.7. Company Listing
- 7.7.1. L&L Products, Inc.
- 7.7.1.1. Company overview
- 7.7.1.2. Financial performance
- 7.7.1.3. Product benchmarking
- 7.7.1.4. Strategic initiatives
- 7.7.2. Sika Automotive AG
- 7.7.2.1. Company overview
- 7.7.2.2. Financial performance
- 7.7.2.3. Product benchmarking
- 7.7.2.4. Strategic initiatives
- 7.7.3. The 3M Company
- 7.7.3.1. Company overview
- 7.7.3.2. Financial performance
- 7.7.3.3. Product benchmarking
- 7.7.3.4. Strategic initiatives
- 7.7.4. Specialty Pulp Manufacturing, Inc (SPMI)
- 7.7.4.1. Company overview
- 7.7.4.2. Financial performance
- 7.7.4.3. Product benchmarking
- 7.7.4.4. Strategic initiatives
- 7.7.5. Nitto Denko Corporation
- 7.7.5.1. Company overview
- 7.7.5.2. Financial performance
- 7.7.5.3. Product benchmarking
- 7.7.5.4. Strategic initiatives
- 7.7.6. Lida Industry Co, Ltd.
- 7.7.6.1. Company overview
- 7.7.6.2. Financial performance
- 7.7.6.3. Product benchmarking
- 7.7.6.4. Strategic initiatives
- 7.7.7. ThreeBond Co., Ltd.
- 7.7.7.1. Company overview
- 7.7.7.2. Financial performance
- 7.7.7.3. Product benchmarking
- 7.7.7.4. Strategic initiatives
- 7.7.8. PPG Industries
- 7.7.8.1. Company overview
- 7.7.8.2. Financial performance
- 7.7.8.3. Product benchmarking
- 7.7.8.4. Strategic initiatives
- 7.7.9. ABI Tape Products
- 7.7.9.1. Company overview
- 7.7.9.2. Financial performance
- 7.7.9.3. Product benchmarking
- 7.7.9.4. Strategic initiatives
- 7.7.10. Adchem Corporation
- 7.7.10.1. Company overview
- 7.7.10.2. Financial performance
- 7.7.10.3. Product benchmarking
- 7.7.10.4. Strategic initiatives
- 7.7.11. Avery Dennison Corporation
- 7.7.11.1. Company overview
- 7.7.11.2. Financial performance
- 7.7.11.3. Product benchmarking
- 7.7.11.4. Strategic initiatives
- 7.7.12. Saint Gobain
- 7.7.12.1. Company overview
- 7.7.12.2. Financial performance
- 7.7.12.3. Product benchmarking
- 7.7.12.4. Strategic initiatives
- 7.7.13. Berry Plastics
- 7.7.13.1. Company overview
- 7.7.13.2. Financial performance
- 7.7.13.3. Product benchmarking
- 7.7.13.4. Strategic initiatives
- 7.7.14. tesa SE
- 7.7.14.1. Company overview
- 7.7.14.2. Financial performance
- 7.7.14.3. Product benchmarking
- 7.7.14.4. Strategic initiatives
- 7.7.15. Lintec Corporation
- 7.7.15.1. Company overview
- 7.7.15.2. Financial performance
- 7.7.15.3. Product benchmarking
- 7.7.15.4. Strategic initiatives
- 7.7.16. Advanced Tapes International Ltd.
- 7.7.16.1. Company overview
- 7.7.16.2. Financial performance
- 7.7.16.3. Product benchmarking
- 7.7.16.4. Strategic initiatives
- 7.7.17. Scapa
- 7.7.17.1. Company overview
- 7.7.17.2. Financial performance
- 7.7.17.3. Product benchmarking
- 7.7.17.4. Strategic initiatives
- 7.7.18. Intertape Polymer Group
- 7.7.18.1. Company overview
- 7.7.18.2. Financial performance
- 7.7.18.3. Product benchmarking
- 7.7.18.4. Strategic initiatives
- 7.7.19. Shurtape
- 7.7.19.1. Company overview
- 7.7.19.2. Financial performance
- 7.7.19.3. Product benchmarking
- 7.7.19.4. Strategic initiatives
- 7.7.20. Henkel AG
- 7.7.20.1. Company overview
- 7.7.20.2. Financial performance
- 7.7.20.3. Product benchmarking
- 7.7.20.4. Strategic initiatives
- 7.7.1. L&L Products, Inc.