|
|
市場調査レポート
商品コード
1092588
コンクリート強化繊維市場の規模、シェア、動向分析レポート:製品別、用途別、セグメント別予測、2022年~2030年Concrete Reinforcing Fiber Market Size, Share & Trends Analysis Report By Product (PE, PP, Steel, Basalt), By Application (Infrastructure, Building & Construction, Industrial), And Segment Forecasts, 2022 - 2030 |
||||||
|
|
|||||||
|
● お客様のご希望に応じて、既存データの加工や未掲載情報(例:国別セグメント)の追加などの対応が可能です。 詳細はお問い合わせください。 |
|||||||


| コンクリート強化繊維市場の規模、シェア、動向分析レポート:製品別、用途別、セグメント別予測、2022年~2030年 |
|
出版日: 2022年05月13日
発行: Grand View Research
ページ情報: 英文 181 Pages
納期: 2~10営業日
|
- 全表示
- 概要
- 図表
- 目次
世界のコンクリート強化繊維の市場規模は、予測期間中に6.8%のCAGRで拡大、2030年までに39億6,000万米ドルに達すると予測されています。
建設業界における軽量非腐食性材料の需要の増加が、予測期間中の製品需要を押し上げると予想されます。
当レポートでは、世界のコンクリート強化繊維市場について調査し、市場の現状とともに、製品別、用途別、地域別動向、および市場に参入する企業のプロファイルなどを提供しています。
目次
第1章 調査手法と範囲
第2章 エグゼクティブサマリー
第3章 コンクリート強化繊維市場:市場変数、動向および範囲
- 市場セグメンテーションと範囲
- 浸透と成長見通しマッピング
- コンクリート強化繊維市場:バリューチェーン分析
- 市場力学
- コンクリート強化繊維市場-ポーターのファイブフォース分析
- コンクリート強化繊維市場-PESTLE分析
第4章 コンクリート強化繊維市場:製品別推定と動向分析
- コンクリート強化繊維市場:製品別動向分析、2021年および2030年
- ポリエチレン(PE)繊維
- ポリプロピレン(PP)繊維
- 鋼繊維
- 玄武岩繊維
- その他
第5章 コンクリート強化繊維市場:用途別推定と動向分析
- コンクリート強化繊維市場:用途別動向分析、2021年および2030年
- インフラ建設
- 住宅および商業建設
- 産業建設
第6章 コンクリート強化繊維市場:地域別推定と傾向分析
- コンクリート強化繊維市場:地域別概要
- コンクリート強化繊維市場:地域別動向分析、2021年および2030年
- 北米
- 欧州
- アジア太平洋
- 中南米
- 中東・アフリカ
第7章 競合情勢
第8章 企業プロファイル
- BASF Se
- Bekaert
- Cemex Sab de CV
- Sika AG
- ABC Polymer Industries, LLC
- Nycon Corporation
- Ultratech Concrete
- Owens Corning
- Forta Corporation
- The Euclid Chemical Company
List of Tables
- Table 1 Polyethylene (PE) Concrete reinforcing fiber market estimates and forecasts, 2017 - 2030 (Kilotons) (USD Million)
- Table 2 Polypropylene (PP) Concrete reinforcing fiber market estimates and forecasts, 2017 - 2030 (Kilotons) (USD Million)
- Table 3 Steel concrete reinforcing fiber market estimates and forecasts, 2017 - 2030 (Kilotons) (USD Million)
- Table 4 Basalt concrete reinforcing fiber market estimates and forecasts, 2017 - 2030 (Kilotons) (USD Million)
- Table 5 Other concrete reinforcing fiber market estimates and forecasts, 2017 - 2030 (Kilotons) (USD Million)
- Table 6 Concrete reinforcing fiber market estimates and forecasts in infrastructure, 2017 - 2030 (Kilotons) (USD Million)
- Table 7 Concrete reinforcing fiber market volume in infrastructure, by product, 2017 - 2030 (Kilotons)
- Table 8 Concrete reinforcing fiber market revenue in infrastructure, by product, 2017 - 2030 (USD Million)
- Table 9 Concrete reinforcing fiber market estimates and forecasts in residential and commercial, 2017 - 2030 (Kilotons) (USD Million)
- Table 10 Concrete reinforcing fiber market volume in residential and commercial construction, by product, 2017 - 2030 (Kilotons)
- Table 11 Concrete reinforcing fiber market revenue in residential and commercial construction, by product, 2017 - 2030 (USD Million)
- Table 12 Concrete reinforcing fiber market estimates and forecasts in industrial flooring, 2017 - 2030 (Kilotons) (USD Million)
- Table 13 Concrete reinforcing fiber market volume in industrial flooring, by product, 2017 - 2030 (Kilotons)
- Table 14 Concrete reinforcing fiber market revenue in industrial flooring, by product, 2017 - 2030 (USD Million)
- Table 15 North America concrete reinforcing fiber market estimates and forecasts, 2017 - 2030 (Kilotons) (USD Million)
- Table 16 North America concrete reinforcing fiber market volume by product, 2017 - 2030 (Kilotons)
- Table 17 North America concrete reinforcing fiber market revenue by product, 2017 - 2030 (USD Million)
- Table 18 North America concrete reinforcing fiber market volume, by application, 2017 - 2030 (Kilotons)
- Table 19 North America concrete reinforcing fiber market revenue, by application, 2017 - 2030 (USD Million)
- Table 20 North America concrete reinforcing fiber market volume in infrastructure, by product, 2017 - 2030 (Kilotons)
- Table 21 North America concrete reinforcing fiber market revenue in infrastructure, by product, 2017 - 2030 (USD Million)
- Table 22 North America concrete reinforcing fiber market volume in residential & commercial, by product, 2017 - 2030 (Kilotons)
- Table 23 North America concrete reinforcing fiber market revenue in residential & commercial, by product, 2017 - 2030 (USD Million)
- Table 24 North America concrete reinforcing fiber market volume in industrial construction, by product, 2017 - 2030 (Kilotons)
- Table 25 North America concrete reinforcing fiber market revenue in industrial construction, by product, 2017 - 2030 (USD Million)
- Table 26 U.S. concrete reinforcing fiber market estimates and forecasts, 2014 - 2025, (Kilotons) (USD Million)
- Table 27 U.S. concrete reinforcing fiber market volume by product, 2017 - 2030 (Kilotons)
- Table 28 U.S. concrete reinforcing fiber market revenue by product, 2017 - 2030 (USD Million)
- Table 29 U.S. concrete reinforcing fiber market volume, by application, 2017 - 2030 (Kilotons)
- Table 30 U.S. concrete reinforcing fiber market revenue, by application, 2017 - 2030 (USD Million)
- Table 31 U.S. concrete reinforcing fiber market volume in infrastructure, by product, 2017 - 2030 (Kilotons)
- Table 32 U.S. concrete reinforcing fiber market revenue in infrastructure, by product, 2017 - 2030 (USD Million)
- Table 33 U.S. concrete reinforcing fiber market volume in residential & commercial, by product, 2017 - 2030 (Kilotons)
- Table 34 U.S. concrete reinforcing fiber market revenue in residential & commercial, by product, 2017 - 2030 (USD Million)
- Table 35 U.S. concrete reinforcing fiber market volume in industrial construction, by product, 2017 - 2030 (Kilotons)
- Table 36 U.S. concrete reinforcing fiber market revenue in industrial construction, by product, 2017 - 2030 (USD Million)
- Table 37 Canada concrete reinforcing fiber market estimates and forecasts, 2014 - 2025, (Kilotons) (USD Million)
- Table 38 Canada concrete reinforcing fiber market volume by product, 2017 - 2030 (Kilotons)
- Table 39 Canada concrete reinforcing fiber market revenue by product, 2017 - 2030 (USD Million)
- Table 40 Canada concrete reinforcing fiber market volume, by application, 2017 - 2030 (Kilotons)
- Table 41 Canada concrete reinforcing fiber market revenue, by application, 2017 - 2030 (USD Million)
- Table 42 Canada concrete reinforcing fiber market volume in infrastructure, by product, 2017 - 2030 (Kilotons)
- Table 43 Canada concrete reinforcing fiber market revenue in infrastructure, by product, 2017 - 2030 (USD Million)
- Table 44 Canada concrete reinforcing fiber market volume in residential & commercial, by product, 2017 - 2030 (Kilotons)
- Table 45 Canada concrete reinforcing fiber market revenue in residential & commercial, by product, 2017 - 2030 (USD Million)
- Table 46 Canada concrete reinforcing fiber market volume in industrial construction, by product, 2017 - 2030 (Kilotons)
- Table 47 Canada concrete reinforcing fiber market revenue in industrial construction, by product, 2017 - 2030 (USD Million)
- Table 48 Mexico concrete reinforcing fiber market estimates and forecasts, 2014 - 2025, (Kilotons) (USD Million)
- Table 49 Mexico concrete reinforcing fiber market volume by product, 2017 - 2030 (Kilotons)
- Table 50 Mexico concrete reinforcing fiber market revenue by product, 2017 - 2030 (USD Million)
- Table 51 Mexico concrete reinforcing fiber market volume, by application, 2017 - 2030 (Kilotons)
- Table 52 Mexico concrete reinforcing fiber market revenue, by application, 2017 - 2030 (USD Million)
- Table 53 Mexico concrete reinforcing fiber market volume in infrastructure, by product, 2017 - 2030 (Kilotons)
- Table 54 Mexico concrete reinforcing fiber market revenue in infrastructure, by product, 2017 - 2030 (USD Million)
- Table 55 Mexico concrete reinforcing fiber market volume in residential & commercial, by product, 2017 - 2030 (Kilotons)
- Table 56 Mexico concrete reinforcing fiber market revenue in residential & commercial, by product, 2017 - 2030 (USD Million)
- Table 57 Mexico concrete reinforcing fiber market volume in industrial construction, by product, 2017 - 2030 (Kilotons)
- Table 58 Mexico concrete reinforcing fiber market revenue in industrial construction, by product, 2017 - 2030 (USD Million)
- Table 59 Europe concrete reinforcing fiber market estimates and forecasts, 2017 - 2030 (Kilotons) (USD Million)
- Table 60 Europe concrete reinforcing fiber market volume by product, 2017 - 2030 (Kilotons)
- Table 61 Europe concrete reinforcing fiber market revenue by product, 2017 - 2030 (USD Million)
- Table 62 Europe concrete reinforcing fiber market volume, by application, 2017 - 2030 (Kilotons)
- Table 63 Europe concrete reinforcing fiber market revenue, by application, 2017 - 2030 (USD Million)
- Table 64 Europe concrete reinforcing fiber market volume in infrastructure, by product, 2017 - 2030 (Kilotons)
- Table 65 Europe concrete reinforcing fiber market revenue in infrastructure, by product, 2017 - 2030 (USD Million)
- Table 66 Europe concrete reinforcing fiber market volume in residential & commercial, by product, 2017 - 2030 (Kilotons)
- Table 67 Europe concrete reinforcing fiber market revenue in residential & commercial, by product, 2017 - 2030 (USD Million)
- Table 68 Europe concrete reinforcing fiber market volume in industrial construction, by product, 2017 - 2030 (Kilotons)
- Table 69 Europe concrete reinforcing fiber market revenue in industrial construction, by product, 2017 - 2030 (USD Million)
- Table 70 Germany concrete reinforcing fiber market estimates and forecasts, 2014 - 2025, (Kilotons) (USD Million)
- Table 71 Germany concrete reinforcing fiber market volume by product, 2017 - 2030 (Kilotons)
- Table 72 Germany concrete reinforcing fiber market revenue, by product, 2017 - 2030 (USD Million)
- Table 73 Germany concrete reinforcing fiber market volume, by application, 2017 - 2030 (Kilotons)
- Table 74 Germany concrete reinforcing fiber market revenue, by application, 2017 - 2030 (USD Million)
- Table 75 Germany concrete reinforcing fiber market volume in infrastructure, by product, 2017 - 2030 (Kilotons)
- Table 76 Germany concrete reinforcing fiber market revenue in infrastructure, by product, 2017 - 2030 (USD Million)
- Table 77 Germany concrete reinforcing fiber market volume in residential & commercial, by product, 2017 - 2030 (Kilotons)
- Table 78 Germany concrete reinforcing fiber market revenue in residential & commercial, by product, 2017 - 2030 (USD Million)
- Table 79 Germany concrete reinforcing fiber market volume in industrial construction, by product, 2017 - 2030 (Kilotons)
- Table 80 Germany concrete reinforcing fiber market revenue in industrial construction, by product, 2017 - 2030 (USD Million)
- Table 81 UK concrete reinforcing fiber market estimates and forecasts, 2014 - 2025, (Kilotons) (USD Million)
- Table 82 UK concrete reinforcing fiber market volume by product, 2017 - 2030 (Kilotons)
- Table 83 UK concrete reinforcing fiber market revenue by product, 2017 - 2030 (USD Million)
- Table 84 UK concrete reinforcing fiber market volume, by application, 2017 - 2030 (Kilotons)
- Table 85 UK concrete reinforcing fiber market revenue, by application, 2017 - 2030 (USD Million)
- Table 86 UK concrete reinforcing fiber market volume in infrastructure, by product, 2017 - 2030 (Kilotons)
- Table 87 UK concrete reinforcing fiber market revenue in infrastructure, by product, 2017 - 2030 (USD Million)
- Table 88 UK concrete reinforcing fiber market volume in residential & commercial, by product, 2017 - 2030 (Kilotons)
- Table 89 UK concrete reinforcing fiber market revenue in residential & commercial, by product, 2017 - 2030 (USD Million)
- Table 90 UK concrete reinforcing fiber market volume in industrial construction, by product, 2017 - 2030 (Kilotons)
- Table 91 UK concrete reinforcing fiber market revenue in industrial construction, by product, 2017 - 2030 (USD Million)
- Table 92 Italy concrete reinforcing fiber market estimates and forecasts, 2014 - 2025 (Kilotons) (USD Million)
- Table 93 Italy concrete reinforcing fiber market volume by product, 2017 - 2030 (Kilotons)
- Table 94 Italy concrete reinforcing fiber market revenue by product, 2017 - 2030 (USD Million)
- Table 95 Italy concrete reinforcing fiber market volume, by application, 2017 - 2030 (Kilotons)
- Table 96 Italy concrete reinforcing fiber market revenue, by application, 2017 - 2030 (USD Million)
- Table 97 Italy concrete reinforcing fiber market volume in infrastructure, by product, 2017 - 2030 (Kilotons)
- Table 98 Italy concrete reinforcing fiber market revenue in infrastructure, by product, 2017 - 2030 (USD Million)
- Table 99 Italy concrete reinforcing fiber market volume in residential & commercial, by product, 2017 - 2030 (Kilotons)
- Table 100 Italy concrete reinforcing fiber market revenue in residential & commercial, by product, 2017 - 2030 (USD Million)
- Table 101 Italy concrete reinforcing fiber market volume in industrial construction, by product, 2017 - 2030 (Kilotons)
- Table 102 Italy concrete reinforcing fiber market revenue in industrial construction, by product, 2017 - 2030 (USD Million)
- Table 103 France concrete reinforcing fiber market estimates and forecasts, 2014 - 2025, (Kilotons) (USD Million)
- Table 104 France concrete reinforcing fiber market volume by product, 2017 - 2030 (Kilotons)
- Table 105 France concrete reinforcing fiber market revenue by product, 2017 - 2030 (USD Million)
- Table 106 France concrete reinforcing fiber market volume, by application, 2017 - 2030 (Kilotons)
- Table 107 France concrete reinforcing fiber market revenue, by application, 2017 - 2030 (USD Million)
- Table 108 France concrete reinforcing fiber market volume in infrastructure, by product, 2017 - 2030 (Kilotons)
- Table 109 France concrete reinforcing fiber market revenue in infrastructure, by product, 2017 - 2030 (USD Million)
- Table 110 France concrete reinforcing fiber market volume in residential & commercial, by product, 2017 - 2030 (Kilotons)
- Table 111 France concrete reinforcing fiber market revenue in residential & commercial, by product, 2017 - 2030 (USD Million)
- Table 112 France concrete reinforcing fiber market volume in industrial construction, by product, 2017 - 2030 (Kilotons)
- Table 113 France concrete reinforcing fiber market revenue in industrial construction, by product, 2017 - 2030 (USD Million)
- Table 114 Asia Pacific concrete reinforcing fiber market estimates and forecasts, 2017 - 2030 (Kilotons) (USD Million)
- Table 115 Asia Pacific concrete reinforcing fiber market volume, by product, 2017 - 2030 (Kilotons)
- Table 116 Asia Pacific concrete reinforcing fiber market revenue by product, 2017 - 2030 (USD Million)
- Table 117 Asia Pacific concrete reinforcing fiber market volume, by application, 2017 - 2030 (Kilotons)
- Table 118 Asia Pacific concrete reinforcing fiber market revenue, by application, 2017 - 2030 (USD Million)
- Table 119 Asia Pacific concrete reinforcing fiber market volume in infrastructure, by product, 2017 - 2030 (Kilotons)
- Table 120 Asia Pacific concrete reinforcing fiber market revenue in infrastructure, by product, 2017 - 2030 (USD Million)
- Table 121 Asia Pacific concrete reinforcing fiber market volume in residential & commercial, by product, 2017 - 2030 (Kilotons)
- Table 122 Asia Pacific concrete reinforcing fiber market revenue in residential & commercial, by product, 2017 - 2030 (USD Million)
- Table 123 Asia Pacific concrete reinforcing fiber market volume in industrial construction, by product, 2017 - 2030 (Kilotons)
- Table 124 Asia Pacific concrete reinforcing fiber market revenue in industrial construction, by product, 2017 - 2030 (USD Million)
- Table 125 China concrete reinforcing fiber market estimates and forecasts, 2014 - 2025, (Kilotons) (USD Million)
- Table 126 China concrete reinforcing fiber market volume by product, 2017 - 2030 (Kilotons)
- Table 127 China concrete reinforcing fiber market revenue by product, 2017 - 2030 (USD Million)
- Table 128 China concrete reinforcing fiber market volume, by application, 2017 - 2030 (Kilotons)
- Table 129 China concrete reinforcing fiber market revenue, by application, 2017 - 2030 (USD Million)
- Table 130 China concrete reinforcing fiber market volume in infrastructure, by product, 2017 - 2030 (Kilotons)
- Table 131 China concrete reinforcing fiber market revenue in infrastructure, by product, 2017 - 2030 (USD Million)
- Table 132 China concrete reinforcing fiber market volume in residential & commercial, by product, 2017 - 2030 (Kilotons)
- Table 133 China concrete reinforcing fiber market revenue in residential & commercial, by product, 2017 - 2030 (USD Million)
- Table 134 China concrete reinforcing fiber market volume in industrial construction, by product, 2017 - 2030 (Kilotons)
- Table 135 China concrete reinforcing fiber market revenue in industrial construction, by product, 2017 - 2030 (USD Million)
- Table 136 India concrete reinforcing fiber market estimates and forecasts, 2014 - 2025, (Kilotons) (USD Million)
- Table 137 India concrete reinforcing fiber market volume by product, 2017 - 2030 (Kilotons)
- Table 138 India concrete reinforcing fiber market revenue by product, 2017 - 2030 (USD Million)
- Table 139 India concrete reinforcing fiber market volume, by application, 2017 - 2030 (Kilotons)
- Table 140 India concrete reinforcing fiber market revenue, by application, 2017 - 2030 (USD Million)
- Table 141 India concrete reinforcing fiber market volume in infrastructure, by product, 2017 - 2030 (Kilotons)
- Table 142 India concrete reinforcing fiber market revenue in infrastructure, by product, 2017 - 2030 (USD Million)
- Table 143 India concrete reinforcing fiber market volume in residential & commercial, by product, 2017 - 2030 (Kilotons)
- Table 144 India concrete reinforcing fiber market revenue in residential & commercial, by product, 2017 - 2030 (USD Million)
- Table 145 India concrete reinforcing fiber market volume in industrial construction, by product, 2017 - 2030 (Kilotons)
- Table 146 India concrete reinforcing fiber market revenue in industrial construction, by product, 2017 - 2030 (USD Million)
- Table 147 Japan concrete reinforcing fiber market estimates and forecasts, 2014 - 2025, (Kilotons) (USD Million)
- Table 148 Japan concrete reinforcing fiber market volume by product, 2017 - 2030 (Kilotons)
- Table 149 Japan concrete reinforcing fiber market revenue by product, 2017 - 2030 (USD Million)
- Table 150 Japan concrete reinforcing fiber market volume, by application, 2017 - 2030 (Kilotons)
- Table 151 Japan concrete reinforcing fiber market revenue, by application, 2017 - 2030 (USD Million)
- Table 152 Japan concrete reinforcing fiber market volume in infrastructure, by product, 2017 - 2030 (Kilotons)
- Table 153 Japan concrete reinforcing fiber market revenue in infrastructure, by product, 2017 - 2030 (USD Million)
- Table 154 Japan concrete reinforcing fiber market volume in residential & commercial, by product, 2017 - 2030 (Kilotons)
- Table 155 Japan concrete reinforcing fiber market revenue in residential & commercial, by product, 2017 - 2030 (USD Million)
- Table 156 Japan concrete reinforcing fiber market volume in industrial construction, by product, 2017 - 2030 (Kilotons)
- Table 157 Japan concrete reinforcing fiber market revenue in industrial construction, by product, 2017 - 2030 (USD Million)
- Table 158 Central & South America concrete reinforcing fiber market estimates and forecasts, 2014 - 2025, (Kilotons) (USD Million)
- Table 159 Central & South America concrete reinforcing fiber market volume by product, 2017 - 2030 (Kilotons)
- Table 160 Central & South America concrete reinforcing fiber market revenue by product, 2017 - 2030 (USD Million)
- Table 161 Central & South America concrete reinforcing fiber market volume, by application, 2017 - 2030 (Kilotons)
- Table 162 Central & South America concrete reinforcing fiber market revenue, by application, 2017 - 2030 (USD Million)
- Table 163 Central & South America concrete reinforcing fiber market volume in infrastructure, by product, 2017 - 2030 (Kilotons)
- Table 164 Central & South America concrete reinforcing fiber market revenue in infrastructure, by product, 2017 - 2030 (USD Million)
- Table 165 Central & South America concrete reinforcing fiber market volume in residential & commercial, by product, 2017 - 2030 (Kilotons)
- Table 166 Central & South America concrete reinforcing fiber market revenue in residential & commercial, by product, 2017 - 2030 (USD Million)
- Table 167 Central & South America concrete reinforcing fiber market volume in industrial construction, by product, 2017 - 2030 (Kilotons)
- Table 168 Central & South America concrete reinforcing fiber market revenue in industrial construction, by product, 2017 - 2030 (USD Million)
- Table 169 Brazil concrete reinforcing fiber market estimates and forecasts, 2014 - 2025, (Kilotons) (USD Million)
- Table 170 Brazil concrete reinforcing fiber market volume by product, 2017 - 2030 (Kilotons)
- Table 171 Brazil concrete reinforcing fiber market revenue by product, 2017 - 2030 (USD Million)
- Table 172 Brazil concrete reinforcing fiber market volume, by application, 2017 - 2030 (Kilotons)
- Table 173 Brazil concrete reinforcing fiber market revenue, by application, 2017 - 2030 (USD Million)
- Table 174 Brazil concrete reinforcing fiber market volume in infrastructure, by product, 2017 - 2030 (Kilotons)
- Table 175 Brazil concrete reinforcing fiber market revenue in infrastructure, by product, 2017 - 2030 (USD Million)
- Table 176 Brazil concrete reinforcing fiber market volume in residential & commercial, by product, 2017 - 2030 (Kilotons)
- Table 177 Brazil concrete reinforcing fiber market revenue in residential & commercial, by product, 2017 - 2030 (USD Million)
- Table 178 Brazil concrete reinforcing fiber market volume in industrial construction, by product, 2017 - 2030 (Kilotons)
- Table 179 Brazil concrete reinforcing fiber market revenue in industrial construction, by product, 2017 - 2030 (USD Million)
- Table 180 Middle East & Africa concrete reinforcing fiber market estimates and forecasts, 2014 - 2025, (Kilotons) (USD Million)
- Table 181 Middle East & Africa concrete reinforcing fiber market volume by product, 2017 - 2030 (Kilotons)
- Table 182 Middle East & Africa concrete reinforcing fiber market revenue by product, 2017 - 2030 (USD Million)
- Table 183 Middle East & Africa concrete reinforcing fiber market volume, by application, 2017 - 2030 (Kilotons)
- Table 184 Middle East & Africa concrete reinforcing fiber market revenue, by application, 2017 - 2030 (USD Million)
- Table 185 Middle East & Africa concrete reinforcing fiber market volume in infrastructure, by product, 2017 - 2030 (Kilotons)
- Table 186 Middle East & Africa concrete reinforcing fiber market revenue in infrastructure, by product, 2017 - 2030 (USD Million)
- Table 187 Middle East & Africa concrete reinforcing fiber market volume in residential & commercial, by product, 2017 - 2030 (Kilotons)
- Table 188 Middle East & Africa concrete reinforcing fiber market revenue in residential & commercial, by product, 2017 - 2030 (USD Million)
- Table 189 Middle East & Africa concrete reinforcing fiber market volume in industrial construction, by product, 2017 - 2030 (Kilotons)
- Table 190 Middle East & Africa concrete reinforcing fiber market revenue in industrial construction, by product, 2017 - 2030 (USD Million)
- Table 191 Saudi Arabia concrete reinforcing fiber market estimates and forecasts, 2014 - 2025, (Kilotons) (USD Million)
- Table 192 Saudi Arabia concrete reinforcing fiber market volume by product, 2017 - 2030 (Kilotons)
- Table 193 Saudi Arabia concrete reinforcing fiber market revenue by product, 2017 - 2030 (USD Million)
- Table 194 Saudi Arabia concrete reinforcing fiber market volume, by application, 2017 - 2030 (Kilotons)
- Table 195 Saudi Arabia concrete reinforcing fiber market revenue, by application, 2017 - 2030 (USD Million)
- Table 196 Saudi Arabia concrete reinforcing fiber market volume in infrastructure, by product, 2017 - 2030 (Kilotons)
- Table 197 Saudi Arabia concrete reinforcing fiber market revenue in infrastructure, by product, 2017 - 2030 (USD Million)
- Table 198 Saudi Arabia concrete reinforcing fiber market volume in residential & commercial, by product, 2017 - 2030 (Kilotons)
- Table 199 Saudi Arabia concrete reinforcing fiber market revenue in residential & commercial, by product, 2017 - 2030 (USD Million)
- Table 200 Saudi Arabia concrete reinforcing fiber market volume in industrial construction, by product, 2017 - 2030 (Kilotons)
- Table 201 Saudi Arabia concrete reinforcing fiber market revenue in industrial construction, by product, 2017 - 2030 (USD Million)
- Table 202 Vendor landscape
List of Figures
- Fig. 1 Market snapshot
- Fig. 2 Market segmentation
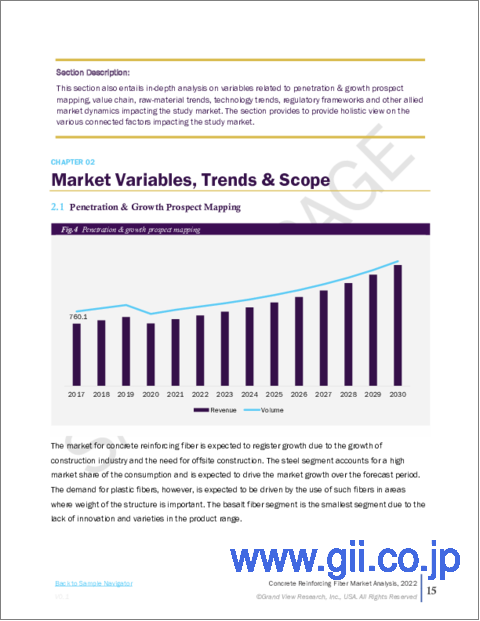
- Fig. 3 Penetration & growth prospect mapping
- Fig. 4 Concrete reinforcing fiber market - Value chain analysis
- Fig. 5 Concrete reinforcing fiber market: Market dynamics
- Fig. 6 Concrete reinforcing fiber market driver impact
- Fig. 7 Global Construction Growth, by region (%)
- Fig. 8 Total infrastructure investments in Asia Pacific (USD billion)
- Fig. 9 Concrete reinforcing fiber market restraint impact
- Fig. 10 Total infrastructure investments in Asia Pacific, 2009 - 2016 (USD billion)
- Fig. 11 Concrete reinforced fiber market - Porter's five forces analysis
- Fig. 12 Concrete reinforced fiber market - PESTLE analysis
- Fig. 13 Concrete reinforcing fiber market: Product movement analysis, 2021 & 2030
- Fig. 14 Concrete reinforcing fiber market: Application movement analysis, 2021 & 2030
- Fig. 15 Regional market place: Key takeaways
- Fig. 16 Concrete reinforcing fiber market: Regional movement analysis, 2021 & 2030
- Fig. 17 Strategy framework
Concrete Reinforcing Fiber Market Growth & Trends:
The global concrete reinforcing fiber market size is expected to reach USD 3.96 billion by 2030, registering a CAGR of 6.8% during the forecast period, according to a new report by Grand View Research, Inc. Increasing demand for lightweight non-corrosive materials in the construction industry is expected to boost product demand in the forecast period. The advantages offered by the reinforcing fibers in concrete include widening of joint spacing and reduction in slab thickness. In addition, they also in reducing the spalling at joint edges and the overall formation & maintenance cost. The aforementioned benefits offered by the product are expected to augment its demand in heavy-load operating structures such as runways, aircraft, and warehouses.
The rising utilization of high-performance concrete is anticipated to have a positive impact on market growth. The industry is witnessing a growing substitution of steel fibers for plastic in a bid to decrease the overall structure weight, thereby driving product sales. Players in the industry are actively involved in the research & development of the production of fibers for reinforcement purposes and lay high emphasis on the manufacturing of advanced reinforcing fiber products with varying sizes and properties. However, fluctuating raw material prices are supposed to be a significant concern for the manufacturers over the forecast period.
Concrete Reinforcing Fiber Market Report Highlight:
- Steel accounted for 49.86% of the volume share in 2021 owing to the increasing demand for the product in the replacement of traditional steel-reinforced concrete in crack prone structures such as canals, dams, and water storage tanks
- Basalt fiber is expected to expand at a CAGR of 10.33% in the forecast period, on account of its properties including high damping and radio transparency, which aids its adoption in the construction activities
- The consumption of the product in infrastructure construction is expected to expand at a CAGR of 7.1% in terms of revenue, from 2017 to 2030 due to increasing government spending on urban planning and management.
- The industry in the Asia Pacific accounted for 34.6% of the global revenue in 2021 owing to the heavy investments by most governments in railway, highway, & road infrastructure expansion and residential construction
- Major players in the industry focus on integration to engage in the production of raw materials including synthetic materials and fibers obtain a competitive edge in the market.
Table of Contents
Chapter 1. Methodology and Scope
- 1.1. Research methodology
- 1.2. Research scope & assumptions
- 1.3. Information Procurement
- 1.3.1. Purchased Database
- 1.3.2. GVR's Internal Database
- 1.3.3. Secondary Sources
- 1.3.4. Third-Party Perspective
- 1.3.5. Primary Research
- 1.4. Information Analysis
- 1.4.1. Data Analysis Models
- 1.5. Market Formulation and Data Visualization
- 1.6. List of data sources
Chapter 2. Executive Summary
- 2.1. Market snapshot
Chapter 3. Concrete Reinforcing Fiber Market: Market Variables, Trends & Scope
- 3.1. Market Segmentation & Scope
- 3.2. Penetration & Growth Prospect Mapping
- 3.3. Concrete Reinforcing Fiber Market: Value chain analysis
- 3.4. Market Dynamics
- 3.4.1. Market Driver Analysis
- 3.4.1.1. Upward penetration in the construction industry
- 3.4.1.2. Upsurge in demand for non-corrosive materials
- 3.4.2. Market Restraint Analysis
- 3.4.2.1. Volatile prices of raw material
- 3.4.3. Key Opportunity Prioritized
- 3.4.3.1. Growth of the Off-site construction industry
- 3.4.1. Market Driver Analysis
- 3.5. Concrete Reinforced Fiber Market - Porter's Five Forces Analysis
- 3.5.1. Supplier Power
- 3.5.2. Buyer Power
- 3.5.3. Substitution Threat
- 3.5.4. Threat from New Entrant
- 3.5.5. Competitive Rivalry
- 3.6. Concrete Reinforced Fiber Market - PESTLE Analysis
- 3.6.1. Political Landscape
- 3.6.2. Environmental Landscape
- 3.6.3. Social Landscape
- 3.6.4. Technology Landscape
- 3.6.5. Economic Landscape
- 3.6.6. Legal Landscape
Chapter 4. Concrete Reinforcing Fiber Market: Product Estimates & Trend Analysis
- 4.1. Concrete reinforcing fiber market: Product movement analysis, 2021 & 2030
- 4.2. Polyethylene (PE) Fiber
- 4.2.1. Market estimates and forecasts, 2017 - 2030 (Kilotons) (USD Million)
- 4.3. Polypropylene (PP) Fiber
- 4.3.1. Market estimates and forecasts, 2017 - 2030 (Kilotons) (USD Million)
- 4.4. Steel Fiber
- 4.4.1. Market estimates and forecasts, 2017 - 2030 (Kilotons) (USD Million)
- 4.5. Basalt Fiber
- 4.5.1. Market estimates and forecasts, 2017 - 2030 (Kilotons) (USD Million)
- 4.6. Other Fiber
- 4.6.1. Market estimates and forecasts, 2017 - 2030 (Kilotons) (USD Million)
Chapter 5. Concrete Reinforcing Fiber Market: Application Estimates & Trend Analysis
- 5.1. Concrete reinforcing fiber market: Application movement analysis, 2021 & 2030
- 5.2. Infrastructure construction
- 5.2.1. Market estimates and forecasts, 2017 - 2030 (Kilotons) (USD Million)
- 5.2.2. Market estimates and forecasts, by product, 2017 - 2030 (Kilotons) (USD Million)
- 5.3. Residential and commercial construction
- 5.3.1. Market estimates and forecasts, 2017 - 2030 (Kilotons) (USD Million)
- 5.3.2. Market estimates and forecasts, by product, 2017 - 2030 (Kilotons) (USD Million)
- 5.4. Industrial Construction
- 5.4.1. Market estimates and forecasts, 2014 - 2025 (Kilotons) (USD Million)
- 5.4.2. Market estimates and forecasts, by product, 2014 - 2025 (Kilotons) (USD Million)
Chapter 6. Concrete Reinforcing Fiber Market: Regional Estimates & Trend Analysis
- 6.1. Concrete reinforcing fiber market: Regional overview
- 6.2. Concrete reinforcing fiber market: Regional movement analysis, 2021 & 2030
- 6.3. North America
- 6.3.1. Market estimates and forecasts, 2017 - 2030 (Kilotons) (USD Million)
- 6.3.2. Market estimates and forecasts, by product, 2017 - 2030 (Kilotons) (USD Million)
- 6.3.3. Market estimates and forecasts, by application, 2017 - 2030 (Kilotons) (USD Million)
- 6.3.4. Market estimates and forecasts, in infrastructure construction, by product, 2017 - 2030 (Kilotons) (USD Million)
- 6.3.5. Market estimates and forecasts, in residential & commercial construction, by product, 2017 - 2030 (Kilotons) (USD Million)
- 6.3.6. Market estimates and forecasts, in industrial construction, by product, 2017 - 2030 (Kilotons) (USD Million)
- 6.3.7. U.S.
- 6.3.7.1. Market estimates and forecasts, 2017 - 2030 (Kilotons) (USD Million)
- 6.3.7.2. Market estimates and forecasts, by product, 2017 - 2030 (Kilotons) (USD Million)
- 6.3.7.3. Market estimates and forecasts, by application, 2017 - 2030 (Kilotons) (USD Million)
- 6.3.7.4. Market estimates and forecasts, in infrastructure construction, by product, 2017 - 2030 (Kilotons) (USD Million)
- 6.3.7.5. Market estimates and forecasts, in residential & commercial construction, by product, 2017 - 2030 (Kilotons) (USD Million)
- 6.3.7.6. Market estimates and forecasts, in industrial construction, by product, 2017 - 2030 (Kilotons) (USD Million)
- 6.3.8. Canada
- 6.3.8.1. Market estimates and forecasts, 2017 - 2030 (Kilotons) (USD Million)
- 6.3.8.2. Market estimates and forecasts, by product, 2017 - 2030 (Kilotons) (USD Million)
- 6.3.8.3. Market estimates and forecasts, by application, 2017 - 2030 (Kilotons) (USD Million)
- 6.3.8.4. Market estimates and forecasts, in infrastructure construction, by product, 2017 - 2030 (Kilotons) (USD Million)
- 6.3.8.5. Market estimates and forecasts, in residential & commercial construction, by product, 2017 - 2030 (Kilotons) (USD Million)
- 6.3.8.6. Market estimates and forecasts, in industrial construction, by product, 2017 - 2030 (Kilotons) (USD Million)
- 6.3.9. Mexico
- 6.3.9.1. Market estimates and forecasts, 2017 - 2030 (Kilotons) (USD Million)
- 6.3.9.2. Market estimates and forecasts, by product, 2017 - 2030 (Kilotons) (USD Million)
- 6.3.9.3. Market estimates and forecasts, by application, 2017 - 2030 (Kilotons) (USD Million)
- 6.3.9.4. Market estimates and forecasts, in infrastructure construction, by product, 2017 - 2030 (Kilotons) (USD Million)
- 6.3.9.5. Market estimates and forecasts, in residential & commercial construction, by product, 2017 - 2030 (Kilotons) (USD Million)
- 6.3.9.6. Market estimates and forecasts, in industrial construction, by product, 2017 - 2030 (Kilotons) (USD Million)
- 6.4. Europe
- 6.4.1. Market estimates and forecasts, 2017 - 2030 (Kilotons) (USD Million)
- 6.4.2. Market estimates and forecasts, by product, 2017 - 2030 (Kilotons) (USD Million)
- 6.4.3. Market estimates and forecasts, by application, 2017 - 2030 (Kilotons) (USD Million)
- 6.4.4. Market estimates and forecasts, in infrastructure construction, by product, 2017 - 2030 (Kilotons) (USD Million)
- 6.4.5. Market estimates and forecasts, in residential & commercial construction, by product, 2017 - 2030 (Kilotons) (USD Million)
- 6.4.6. Market estimates and forecasts, in industrial construction, by product, 2017 - 2030 (Kilotons) (USD Million)
- 6.4.7. Germany
- 6.4.7.1. Market estimates and forecasts, 2017 - 2030 (Kilotons) (USD Million)
- 6.4.7.2. Market estimates and forecasts, by product, 2017 - 2030 (Kilotons) (USD Million)
- 6.4.7.3. Market estimates and forecasts, by application, 2017 - 2030 (Kilotons) (USD Million)
- 6.4.7.4. Market estimates and forecasts, in infrastructure construction, by product, 2017 - 2030 (Kilotons) (USD Million)
- 6.4.7.5. Market estimates and forecasts, in residential & commercial construction, by product, 2017 - 2030 (Kilotons) (USD Million)
- 6.4.7.6. Market estimates and forecasts, in industrial construction, by product, 2017 - 2030 (Kilotons) (USD Million)
- 6.4.8. UK
- 6.4.8.1. Market estimates and forecasts, 2017 - 2030 (Kilotons) (USD Million)
- 6.4.8.2. Market estimates and forecasts, by product, 2017 - 2030 (Kilotons) (USD Million)
- 6.4.8.3. Market estimates and forecasts, by application, 2017 - 2030 (Kilotons) (USD Million)
- 6.4.8.4. Market estimates and forecasts, in infrastructure construction, by product, 2017 - 2030 (Kilotons) (USD Million)
- 6.4.8.5. Market estimates and forecasts, in residential & commercial construction, by product, 2017 - 2030 (Kilotons) (USD Million)
- 6.4.8.6. Market estimates and forecasts, in industrial construction, by product, 2017 - 2030 (Kilotons) (USD Million)
- 6.4.9. France
- 6.4.9.1. Market estimates and forecasts, 2017 - 2030 (Kilotons) (USD Million)
- 6.4.9.2. Market estimates and forecasts, by product, 2017 - 2030 (Kilotons) (USD Million)
- 6.4.9.3. Market estimates and forecasts, by application, 2017 - 2030 (Kilotons) (USD Million)
- 6.4.9.4. Market estimates and forecasts, in infrastructure construction, by product, 2017 - 2030 (Kilotons) (USD Million)
- 6.4.9.5. Market estimates and forecasts, in residential & commercial construction, by product, 2017 - 2030 (Kilotons) (USD Million)
- 6.4.9.6. Market estimates and forecasts, in industrial construction, by product, 2017 - 2030 (Kilotons) (USD Million)
- 6.4.10. Italy
- 6.4.10.1. Market estimates and forecasts, 2017 - 2030 (Kilotons) (USD Million)
- 6.4.10.2. Market estimates and forecasts, by product, 2017 - 2030 (Kilotons) (USD Million)
- 6.4.10.3. Market estimates and forecasts, by application, 2017 - 2030 (Kilotons) (USD Million)
- 6.4.10.4. Market estimates and forecasts, in infrastructure construction, by product, 2017 - 2030 (Kilotons) (USD Million)
- 6.4.10.5. Market estimates and forecasts, in residential & commercial construction, by product, 2017 - 2030 (Kilotons) (USD Million)
- 6.4.10.6. Market estimates and forecasts, in industrial construction, by product, 2017 - 2030 (Kilotons) (USD Million)
- 6.5. Asia Pacific
- 6.5.1. Market estimates and forecasts, 2017 - 2030 (Kilotons) (USD Million)
- 6.5.2. Market estimates and forecasts, by product, 2017 - 2030 (Kilotons) (USD Million)
- 6.5.3. Market estimates and forecasts, by application, 2017 - 2030 (Kilotons) (USD Million)
- 6.5.4. Market estimates and forecasts, in infrastructure construction, by product, 2017 - 2030 Kilotons) (USD Million)
- 6.5.5. Market estimates and forecasts, in residential & commercial construction, by product, 2017 - 2030 (Kilotons) (USD Million)
- 6.5.6. Market estimates and forecasts, in industrial construction, by product, 2017 - 2030 (Kilotons) (USD Million)
- 6.5.7. China
- 6.5.7.1. Market estimates and forecasts, 2017 - 2030 (Kilotons) (USD Million)
- 6.5.7.2. Market estimates and forecasts, by product, 2017 - 2030 (Kilotons) (USD Million)
- 6.5.7.3. Market estimates and forecasts, by application, 2017 - 2030 (Kilotons) (USD Million)
- 6.5.7.4. Market estimates and forecasts, in infrastructure construction, by product, 2017 - 2030 (Kilotons) (USD Million)
- 6.5.7.5. Market estimates and forecasts, in residential & commercial construction, by product, 2017 - 2030 (Kilotons) (USD Million)
- 6.5.7.6. Market estimates and forecasts, in industrial construction, by product, 2017 - 2030 (Kilotons) (USD Million)
- 6.5.8. India
- 6.5.8.1. Market estimates and forecasts, 2017 - 2030 (Kilotons) (USD Million)
- 6.5.8.2. Market estimates and forecasts, by product, 2017 - 2030 (Kilotons) (USD Million)
- 6.5.8.3. Market estimates and forecasts, by application, 2017 - 2030 (Kilotons) (USD Million)
- 6.5.8.4. Market estimates and forecasts, in infrastructure construction, by product, 2017 - 2030 (Kilotons) (USD Million)
- 6.5.8.5. Market estimates and forecasts, in residential & commercial construction, by product, 2017 - 2030 (Kilotons) (USD Million)
- 6.5.8.6. Market estimates and forecasts, in industrial construction, by product, 2017 - 2030 (Kilotons) (USD Million)
- 6.5.9. Japan
- 6.5.9.1. Market estimates and forecasts, 2017 - 2030 (Kilotons) (USD Million)
- 6.5.9.2. Market estimates and forecasts, by product, 2017 - 2030 (Kilotons) (USD Million)
- 6.5.9.3. Market estimates and forecasts, by application, 2017 - 2030 (Kilotons) (USD Million)
- 6.5.9.4. Market estimates and forecasts, in infrastructure construction, by product, 2017 - 2030 (Kilotons) (USD Million)
- 6.5.9.5. Market estimates and forecasts, in residential & commercial construction, by product, 2017 - 2030 (Kilotons) (USD Million)
- 6.5.9.6. Market estimates and forecasts, in industrial construction, by product, 2017 - 2030 (Kilotons) (USD Million)
- 6.6. Central & South America
- 6.6.1. Market estimates and forecasts, 2017 - 2030 (Kilotons) (USD Million)
- 6.6.2. Market estimates and forecasts, by product, 2017 - 2030 (Kilotons) (USD Million)
- 6.6.3. Market estimates and forecasts, by application, 2017 - 2030 (Kilotons) (USD Million)
- 6.6.4. Market estimates and forecasts, in infrastructure construction, by product, 2017 - 2030 (Kilotons) (USD Million)
- 6.6.5. Market estimates and forecasts, in residential & commercial construction, by product, 2017 - 2030 (Kilotons) (USD Million)
- 6.6.6. Market estimates and forecasts, in industrial construction, by product, 2017 - 2030 (Kilotons) (USD Million)
- 6.6.7. Brazil
- 6.6.7.1. Market estimates and forecasts, 2017 - 2030 (Kilotons) (USD Million)
- 6.6.7.2. Market estimates and forecasts, by product, 2017 - 2030 (Kilotons) (USD Million)
- 6.6.7.3. Market estimates and forecasts, by application, 2017 - 2030 (Kilotons) (USD Million)
- 6.6.7.4. Market estimates and forecasts, in infrastructure construction, by product, 2017 - 2030 (Kilotons) (USD Million)
- 6.6.7.5. Market estimates and forecasts, in residential & commercial construction, by product, 2017 - 2030 (Kilotons) (USD Million)
- 6.6.7.6. Market estimates and forecasts, in industrial construction, by product, 2017 - 2030 (Kilotons) (USD Million)
- 6.7. Middle East & Africa
- 6.7.1. Market estimates and forecasts, 2017 - 2030 (Kilotons) (USD Million)
- 6.7.2. Market estimates and forecasts, by product, 2017 - 2030 (Kilotons) (USD Million)
- 6.7.3. Market estimates and forecasts, by application, 2017 - 2030 (Kilotons) (USD Million)
- 6.7.4. Market estimates and forecasts, in infrastructure construction, by product, 2017 - 2030 (Kilotons) (USD Million)
- 6.7.5. Market estimates and forecasts, in residential & commercial construction, by product, 2017 - 2030 (Kilotons) (USD Million)
- 6.7.6. Market estimates and forecasts, in industrial construction, by product, 2017 - 2030 (Kilotons) (USD Million)
- 6.7.7. South Africa
- 6.7.7.1. Market estimates and forecasts, 2017 - 2030 (Kilotons) (USD Million)
- 6.7.7.2. Market estimates and forecasts, by product, 2017 - 2030 (Kilotons) (USD Million)
- 6.7.7.3. Market estimates and forecasts, by application, 2017 - 2030 (Kilotons) (USD Million)
- 6.7.7.4. Market estimates and forecasts, in infrastructure construction, by product, 2017 - 2030 (Kilotons) (USD Million)
- 6.7.7.5. Market estimates and forecasts, in residential & commercial construction, by product, 2017 - 2030 (Kilotons) (USD Million)
- 6.7.7.6. Market estimates and forecasts, in industrial construction, by product, 2017 - 2030 (Kilotons) (USD Million)
Chapter 7. Competitive Landscape
- 7.1. Vendor Landscape
- 7.2. Competitive Environment
- 7.3. Strategy framework
Chapter 8. Company Profiles
- 8.1.BASF Se
- 8.1.1 Company Overview
- 8.1.2 Financial Performance
- 8.1.3 Product Benchmarking
- 8.2. Bekaert
- 8.2.1 Company Overview
- 8.2.2 Financial Performance
- 8.2.3 Product Benchmarking
- 8.3. Cemex S.a.b. de C.V.
- 8.3.1 Company Overview
- 8.3.2 Financial performance
- 8.3.3 Product benchmarking
- 8.4. Sika AG
- 8.4.1 Company overview
- 8.4.2 Financial performance
- 8.4.3 Product benchmarking
- 8.5. ABC Polymer Industries, LLC
- 8.5.1 Company overview
- 8.5.2 Product benchmarking
- 8.6. Nycon Corporation
- 8.6.1 Company overview
- 8.6.2 Product benchmarking
- 8.8. Ultratech Concrete
- 8.8.1 Company overview
- 8.8.2 Financial performance
- 8.8.3 Product benchmarking
- 8.8.4 Strategic Initiatives
- 8.8. Owens Corning
- 8.8.1 Company Overview
- 8.8.2 Financial Performance
- 8.8.3 Product Benchmarking
- 8.8.4 Strategic Initiatives
- 8.9. Forta Corporation
- 8.9.1 Company overview
- 8.9.2 Product benchmarking
- 8.9.3 Strategic initiatives
- 8.10. The Euclid Chemical Company
- 8.10.1 Company overview
- 8.10.2 Financial performance
- 8.10.3 Product benchmarking