|
|
市場調査レポート
商品コード
1147480
幹細胞市場:規模、シェア、動向分析レポート:製品別(成体幹細胞、ヒト胚性幹細胞)、用途別、技術別、治療法別、最終用途別、地域別、セグメント別予測、2022年~2030年Stem Cells Market Size, Share & Trends Analysis Report By Product (Adult Stem Cells, Human Embryonic Stem Cells), By Application, By Technology, By Therapy, By End Use, By Region, And Segment Forecasts, 2022 - 2030 |
||||||
|
|
|||||||
|
● お客様のご希望に応じて、既存データの加工や未掲載情報(例:国別セグメント)の追加などの対応が可能です。 詳細はお問い合わせください。 |
|||||||


| 幹細胞市場:規模、シェア、動向分析レポート:製品別(成体幹細胞、ヒト胚性幹細胞)、用途別、技術別、治療法別、最終用途別、地域別、セグメント別予測、2022年~2030年 |
|
出版日: 2022年10月07日
発行: Grand View Research
ページ情報: 英文 150 Pages
納期: 2~10営業日
|
- 全表示
- 概要
- 図表
- 目次
幹細胞市場の成長と動向
Grand View Research, Inc.の新しいレポートによると、世界の幹細胞市場規模は、2022年から2030年にかけて11.4%のCAGRを記録し、2030年までに316億米ドルに達すると予測されています。幹細胞は、他のさまざまな細胞に分化し、最終的に臓器や組織を形成することができる細胞です。幹細胞の真の可能性を評価するために長年にわたって多くの研究が行われ、遺伝性疾患治療、神経疾患、腫瘍、臓器再生の分野でさまざまな応用が生まれています。市場を牽引しているのは、銀行数の増加、これらの製品の治療可能性を高めることへの注目の高まり、再生医療開発のための広範な研究などです。
再生治療への注目の高まりが市場拡大を後押ししています。iPS細胞は、カスタマイズされた細胞治療の作成に利用され、再生医療の新たな可能性を切り開くものとして人気を集めています。例えば、2020年9月、デュークNUSとモナシュ大学の研究者は、妊娠中の胎盤の問題の治療を助けることができる最初の幹細胞を発見しました。研究者らは、胎盤細胞の生成に使用できる人工絨毛幹細胞の新しい製造方法を考案しました。この研究は、体外ヒト胎盤モデルの開発を助け、将来の治療法への道を開くものです。
さらに、COVID-19はマーケットの成長を促進する触媒として作用しています。米国、中国、イランなどいくつかの国では、COVID-19感染症の治療に細胞療法を用いた臨床試験の実施を開始しています。さらに、COVID-19患者の治療に細胞療法を使用することで、優れた結果が得られており、これが市場拡大の原動力となっています。2020年1月、中国・北京の研究グループは、幹細胞治療がCOVID-19に対して有益かどうか、患者を対象に試験を行いました。この研究では、治療の初回試験時にCOVID-19患者に臨床グレードのMSCを静脈内投与したところ、機能的な結果が改善し、回復の促進が見られたことが判明しました。
がんの有病率の増加は、予測期間中の成長に寄与する重要な要因の1つです。がん治療における併用療法や化学療法の失敗は、医師がそれらの治療法から自家および同種幹細胞療法にシフトすることにつながり、それによって成長が促進されます。さらに、主要な市場関係者や政府機関は、がん研究に継続的に投資しています。例えば、2021年11月、カリフォルニア再生医療研究所は、急性リンパ芽球性白血病(ALL)、慢性リンパ性白血病(CLL)、マントル細胞リンパ腫(MCL)の患者を対象とした療法に400万米ドルを投資しました。
細胞ベースの治療法の使用と採用のための新しい技術の導入が、予測期間中の成長を後押しすると予想されます。成人幹細胞や臍帯血の処理・保管の自動化は、市場成長にプラスの影響を与えると予想される主要技術です。例えば、様々な科学者が、幅広い疾患において幹細胞を用いた安全で成功する治療法の承認を目指しています。2021年、Biotech Cellinoなどの企業は、自動化された幹細胞製造の開発のために人工知能技術を融合させる取り組みに7500万米ドルを投資し、費用対効果を目指しながら細胞治療へのアクセスを規則化する能力を持っています。
一方、治療費の高さが市場成長の妨げになると予想されます。例えば、幹細胞研究会社のバイオインフォーマントは、幹細胞治療の費用は患者一人当たり5,000米ドルから8,000米ドルで、手順の複雑さによっては25,000米ドル以上になるケースもあると報告しています。さらに、幹細胞の研究活動に対する規制が従来から胚性幹細胞の成長を妨げてきたため、その利点にもかかわらず市場全体のシェアはわずかなものにとどまっています。
幹細胞市場レポートハイライト
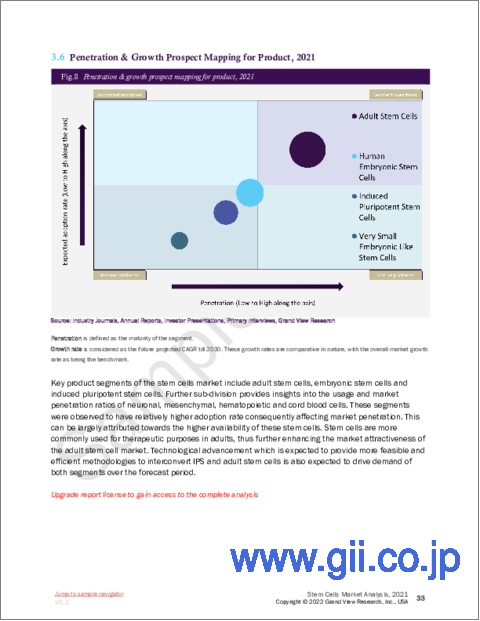
幹細胞を用いた治療のゴールドスタンダードとされるASCs分野が2021年に最大のシェアを占めました。特に造血幹細胞移植における一貫した臨床的成功により、広く受け入れられており、その起源に関する論争も比較的少なくなっている
iPSCは、2022年から2030年にかけてCAGRが上昇すると予想されています。これは、細胞治療にiPSを使用する企業が増加しているためです。例えば、2020年7月にCynata Therapeutics Limitedは、同社の主力製品であるiPS細胞由来のCymerus、CYP-001の第1相臨床試験で良好な結果を発表しました。
再生医療は、再生医療開発のための政府による資金提供の増加により、2021年の市場を独占しました。例えば、2020年10月にAusBiotech主導のコンソーシアムは、オーストラリアにおける再生医療開発のために、MTPConnectのIndustry Growth Centre Project Fundから30万米ドルの資金提供を受けた
細胞採取技術が2021年に最大の市場シェアを占め、細胞採取を伴う研究調査の増加により、2022年から2030年にかけて最も速いCAGRで拡大すると予想される
がん治療における同種幹細胞移植の増加により、2021年には同種療法が市場を席巻
2021年は製薬会社およびバイオテクノロジー会社が最大の市場シェアを占め、研究開発の活発化、臨床試験の増加、主要企業の戦略的活動により、最も速いCAGRで推移すると予測されます。
北米市場には、米国とカナダが含まれます。同地域の市場成長の要因としては、政府による強力な資金援助、研究の増加、同地域における有力プレイヤーの存在などが挙げられます。
アジア太平洋地域は、主要企業の事業拡大により、2022年から2030年にかけて最も速いCAGRで成長すると予想されます。例えば、2020年4月、Seneca Biopharmaは、中国の蘇州に新しい幹細胞製造施設を完成させました。
目次
Chapter 1:調査技術
- 市場セグメンテーションと範囲
- 調査技術学
- 情報調達
- 購入したデータベース
- Gvrの内部データベース
- 二次情報
- 1次調査
- 1次調査の詳細
- 情報またはデータ分析
- データ分析モデル
- 市場の策定と検証
- モデルの詳細
- コモディティフロー分析
- アプローチ1:コモディティフローアプローチ
- アプローチ2:ボトムアップアプローチを使用した国別の市場推定
- コモディティフロー分析
- 世界市場:CAGR計算
- 調査の仮定
- 二次情報一覧
- 一次情報のリスト
- 目的
- 略語一覧
第2章 市場の定義
第3章 エグゼクティブサマリー
- 市場概要
第4章 世界の幹細胞市場の市場:変数、動向、および範囲
- 幹細胞市場系統の見通し
- 親市場の見通し
- 浸透と成長の見通しのマッピング
- 規制の枠組み
- 市場促進要因分析
- 再生医療の発展
- 幹細胞調査を加速するための資金の増加
- 幹細胞バンキングの需要の高まり
- 遺伝性疾患の有病率の増加
- 市場抑制要因分析
- 幹細胞調査に関する倫理的懸念
- 幹細胞の特定の用途における明確な規制枠組みの欠如
- 主な機会
- 細胞および遺伝子治療の需要
- 主な課題
- 製造プロセスに関連する技術的制限
- 幹細胞市場-PESTLE分析
- 業界分析- ポーターズ
- 主要取引と戦略的提携分析
- 合弁事業
- 合併と買収
- ライセンシングとパートナーシップ
- 技術協力
- 戦略的売却
- COVID-19影響分析
第5章 幹細胞市場:セグメント分析、製品別、2018年から2030年(100万米ドル)
- 世界の幹細胞市場:製品変動分析
- 成体幹細胞(ASC)
- 造血幹細胞(血液幹細胞)
- 間葉系幹細胞
- 神経幹細胞
- 上皮/皮膚幹細胞
- その他の成体幹細胞
- ヒト胚性幹細胞
- 人工多能性幹細胞
- 非常に小さな胚様幹細胞
第6章 幹細胞市場:セグメント分析、アプリケーション別、2018年から2030年(100万米ドル)
- 幹細胞市場:アプリケーションの変動分析
- 再生医療
- 神経学
- 整形外科
- 腫瘍学
- 血液学
- 心血管および心筋梗塞
- けが
- 糖尿病
- 肝障害
- 失禁
- その他
- 創薬と開発
第7章 幹細胞市場:セグメント分析、テクノロジー別、2018年から2030年(100万米ドル)
- 世界の幹細胞市場:技術変動分析
- セル取得
- 骨髄採取
- 臍帯血
- アフェレシス
- 細胞生産
- 治療用クローニング
- 体外受精で
- 細胞培養
- 隔離
- 凍結保存
- 拡大とサブカルチャー
第8章 幹細胞市場:セグメント分析、治療別、2018年から2030年(100万米ドル)
- 世界の幹細胞市場:治療変動分析
- 自家
- 同種異系
第9章 幹細胞市場:セグメント分析、エンドユーザー別、2018年から2030年(100万米ドル)
- 世界の幹細胞市場:エンドユーザーの変動分析
- 製薬およびバイオテクノロジー企業
- 病院と細胞バンク
- 学術・調査機関
第10章 幹細胞市場:セグメント分析、地域別、2018年~2030年(100万米ドル)
- 幹細胞市場:地域変動分析
- 北米
- 米国
- カナダ
- 欧州
- 英国
- ドイツ
- フランス
- イタリア
- スペイン
- アジア太平洋地域
- 日本
- 中国
- インド
- 韓国
- オーストラリア
- ラテンアメリカ
- ブラジル
- メキシコ
- アルゼンチン
- 中東およびアフリカ(MEA)
- 南アフリカ
- サウジアラビア
- アラブ首長国連邦
第11章 競合情勢
- 公開会社
- 会社の市況分析
- 競合ダッシュボード分析
- 戦略的枠組み
- 非公開会社
- 主要な新興企業/テクノロジーディスラプター/イノベーターのリスト
- 地域ネットワークマップ
- 企業プロファイル
- ADVANCED CELL TECHNOLOGY, INC.
- 会社概要
- 財務実績
- 製品のベンチマーク
- 戦略的イニシアチブ
- STEMCELL Technologies, Inc.
- 会社概要
- 財務実績
- 製品のベンチマーク
- 戦略的イニシアチブ
- CELLULAR ENGINEERING TECHNOLOGIES INC.
- 会社概要
- 財務実績
- 製品のベンチマーク
- 戦略的イニシアチブ
- CELLGENIX GmbH
- 会社概要
- 財務実績
- 製品のベンチマーク
- 戦略的イニシアチブ
- PROMOCELL GMBH
- 会社概要
- 財務実績
- 製品のベンチマーク
- 戦略的イニシアチブ
- LONZA
- 会社概要
- 財務実績
- 製品のベンチマーク
- 戦略的イニシアチブ
- KITE PHARMA
- 会社概要
- 財務実績
- 製品のベンチマーク
- 戦略的イニシアチブ
- CELLARTIS AB
- 会社概要
- 財務実績
- 製品のベンチマーク
- 戦略的イニシアチブ
- ANGEL BIOTECHNOLOGY
- 会社概要
- 財務実績
- 製品のベンチマーク
- 戦略的イニシアチブ
- BRAINSTORM CELL THERAPEUTICS
- 会社概要
- 財務実績
- 製品のベンチマーク
- 戦略的イニシアチブ
- CELGENE CORPORATION
- 会社概要
- 財務実績
- 製品のベンチマーク
- 戦略的イニシアチブ
- OSIRIS THERAPEUTICS, INC.
- 会社概要
- 財務実績
- 製品のベンチマーク
- 戦略的イニシアチブ
- GENEA BIOCELLS
- 会社概要
- 財務実績
- 製品のベンチマーク
- 戦略的イニシアチブ
- BIOHEART INC.
- 会社概要
- 財務実績
- 製品のベンチマーク
- 戦略的イニシアチブ
- WAISMAN BIOMANUFACTURING
- 会社概要
- 財務実績
- 製品のベンチマーク
- 戦略的イニシアチブ
- TIGENIX
- 会社概要
- 財務実績
- 製品のベンチマーク
- 戦略的イニシアチブ
- CALADRIUS
- 会社概要
- 財務実績
- 製品のベンチマーク
- 戦略的イニシアチブ
- GAMIDA CELL.
- 会社概要
- 財務実績
- 製品のベンチマーク
- 戦略的イニシアチブ
- PLURISTEM THERAPEUTICS INC.
- 会社概要
- 財務実績
- 製品のベンチマーク
- 戦略的イニシアチブ
- ADVANCED CELL TECHNOLOGY, INC.
List of Tables
- TABLE 1 List of Secondary Sources
- TABLE 2 List of Abbreviations
- TABLE 3 Global Stem Cells Market, by Product 2018 - 2030 (USD Million)
- TABLE 4 Global Stem Cells Market, by Application 2018 - 2030 (USD Million)
- TABLE 5 Global Stem Cells Market, by Technology 2018 - 2030 (USD Million)
- TABLE 6 Global Stem Cells Market, by Therapy 2018 - 2030 (USD Million)
- TABLE 7 Global Stem Cells Market, by End-use, 2018 - 2030 (USD Million)
- TABLE 8 Global Stem Cells Market, by Region, 2018 - 2030 (USD Million)
- TABLE 9 North America Stem Cells Market, by Country, 2018 - 2030 (USD Million)
- TABLE 10 North America Stem Cells Market, by Product 2018 - 2030 (USD Million)
- TABLE 11 North America Stem Cells Market, by Application 2018 - 2030 (USD Million)
- TABLE 12 North America Stem Cells Market, by Technology 2018 - 2030 (USD Million)
- TABLE 13 North America Stem Cells Market, by Therapy 2018 - 2030 (USD Million)
- TABLE 14 North America Stem Cells Market, by End-use, 2018 - 2030 (USD Million)
- TABLE 15 U.S. Stem Cells Market, by Product 2018 - 2030 (USD Million)
- TABLE 16 U.S. Stem Cells Market, by Application 2018 - 2030 (USD Million)
- TABLE 17 U.S. Stem Cells Market, by Technology 2018 - 2030 (USD Million)
- TABLE 18 U.S. Stem Cells Market, by Therapy 2018 - 2030 (USD Million)
- TABLE 19 U.S. Stem Cells Market, by End-use, 2018 - 2030 (USD Million)
- TABLE 20 Canada Stem Cells Market, by Product 2018 - 2030 (USD Million)
- TABLE 21 Canada Stem Cells Market, by Application 2018 - 2030 (USD Million)
- TABLE 22 Canada Stem Cells Market, by Technology 2018 - 2030 (USD Million)
- TABLE 23 Canada Stem Cells Market, by Therapy 2018 - 2030 (USD Million)
- TABLE 24 Canada Stem Cells Market, by End-use, 2018 - 2030 (USD Million)
- TABLE 25 Europe Stem Cells Market, by Country, 2018 - 2030 (USD Million)
- TABLE 26 Europe Stem Cells Market, by Product 2018 - 2030 (USD Million)
- TABLE 27 Europe Stem Cells Market, by Application 2018 - 2030 (USD Million)
- TABLE 28 Europe Stem Cells Market, by Technology 2018 - 2030 (USD Million)
- TABLE 29 Europe Stem Cells Market, by Therapy 2018 - 2030 (USD Million)
- TABLE 30 Europe Stem Cells Market, by End-use, 2018 - 2030 (USD Million)
- TABLE 31 Germany Stem Cells Market, by Product 2018 - 2030 (USD Million)
- TABLE 32 Germany Stem Cells Market, by Application 2018 - 2030 (USD Million)
- TABLE 33 Germany Stem Cells Market, by Technology 2018 - 2030 (USD Million)
- TABLE 34 Germany Stem Cells Market, by Therapy 2018 - 2030 (USD Million)
- TABLE 35 Germany Stem Cells Market, by End-use, 2018 - 2030 (USD Million)
- TABLE 36 U.K. Stem Cells Market, by Product 2018 - 2030 (USD Million)
- TABLE 37 U.K. Stem Cells Market, by Application 2018 - 2030 (USD Million)
- TABLE 38 U.K. Stem Cells Market, by Technology 2018 - 2030 (USD Million)
- TABLE 39 U.K. Stem Cells Market, by Therapy 2018 - 2030 (USD Million)
- TABLE 40 U.K. Stem Cells Market, by End-use, 2018 - 2030 (USD Million)
- TABLE 41 France Stem Cells Market, by Product 2018 - 2030 (USD Million)
- TABLE 42 France Stem Cells Market, by Application 2018 - 2030 (USD Million)
- TABLE 43 France Stem Cells Market, by Technology 2018 - 2030 (USD Million)
- TABLE 44 France Stem Cells Market, by Therapy 2018 - 2030 (USD Million)
- TABLE 45 France Stem Cells Market, by End-use, 2018 - 2030 (USD Million)
- TABLE 46 Italy Stem Cells Market, by Product 2018 - 2030 (USD Million)
- TABLE 47 Italy Stem Cells Market, by Application 2018 - 2030 (USD Million)
- TABLE 48 Italy Stem Cells Market, by Technology 2018 - 2030 (USD Million)
- TABLE 49 Italy Stem Cells Market, by Therapy 2018 - 2030 (USD Million)
- TABLE 50 Italy Stem Cells Market, by End-use, 2018 - 2030 (USD Million)
- TABLE 51 Spain Stem Cells Market, by Product 2018 - 2030 (USD Million)
- TABLE 52 Spain Stem Cells Market, by Application 2018 - 2030 (USD Million)
- TABLE 53 Spain Stem Cells Market, by Technology 2018 - 2030 (USD Million)
- TABLE 54 Spain Stem Cells Market, by Therapy 2018 - 2030 (USD Million)
- TABLE 55 Spain Stem Cells Market, by End-use, 2018 - 2030 (USD Million)
- TABLE 56 Asia Pacific Stem Cells Market, by Country, 2018 - 2030 (USD Million)
- TABLE 57 Asia Pacific Stem Cells Market, by Product 2018 - 2030 (USD Million)
- TABLE 58 Asia Pacific Stem Cells Market, by Application 2018 - 2030 (USD Million)
- TABLE 59 Asia Pacific Stem Cells Market, by Technology 2018 - 2030 (USD Million)
- TABLE 60 Asia Pacific Stem Cells Market, by Therapy 2018 - 2030 (USD Million)
- TABLE 61 Asia Pacific Stem Cells Market, by End-use, 2018 - 2030 (USD Million)
- TABLE 62 China Stem Cells Market, by Product 2018 - 2030 (USD Million)
- TABLE 63 China Stem Cells Market, by Application 2018 - 2030 (USD Million)
- TABLE 64 China Stem Cells Market, by Technology 2018 - 2030 (USD Million)
- TABLE 65 China Stem Cells Market, by Therapy 2018 - 2030 (USD Million)
- TABLE 66 China Stem Cells Market, by End-use, 2018 - 2030 (USD Million)
- TABLE 67 Japan Stem Cells Market, by Product 2018 - 2030 (USD Million)
- TABLE 68 Japan Stem Cells Market, by Application 2018 - 2030 (USD Million)
- TABLE 69 Japan Stem Cells Market, by Technology 2018 - 2030 (USD Million)
- TABLE 70 Japan Stem Cells Market, by Therapy 2018 - 2030 (USD Million)
- TABLE 71 Japan Stem Cells Market, by End-use, 2018 - 2030 (USD Million)
- TABLE 72 India Stem Cells Market, by Product 2018 - 2030 (USD Million)
- TABLE 73 India Stem Cells Market, by Application 2018 - 2030 (USD Million)
- TABLE 74 India Stem Cells Market, by Technology 2018 - 2030 (USD Million)
- TABLE 75 India Stem Cells Market, by Therapy 2018 - 2030 (USD Million)
- TABLE 76 India Stem Cells Market, by End-use, 2018 - 2030 (USD Million)
- TABLE 77 South Korea Stem Cells Market, by Product 2018 - 2030 (USD Million)
- TABLE 78 South Korea Stem Cells Market, by Application 2018 - 2030 (USD Million)
- TABLE 79 South Korea Stem Cells Market, by Technology 2018 - 2030 (USD Million)
- TABLE 80 South Korea Stem Cells Market, by Therapy 2018 - 2030 (USD Million)
- TABLE 81 South Korea Stem Cells Market, by End-use, 2018 - 2030 (USD Million)
- TABLE 82 Australia Stem Cells Market, by Product 2018 - 2030 (USD Million)
- TABLE 83 Australia Stem Cells Market, by Application 2018 - 2030 (USD Million)
- TABLE 84 Australia Stem Cells Market, by Technology 2018 - 2030 (USD Million)
- TABLE 85 Australia Stem Cells Market, by Therapy 2018 - 2030 (USD Million)
- TABLE 86 Australia Stem Cells Market, by End-use, 2018 - 2030 (USD Million)
- TABLE 87 Latin America Stem Cells Market, by Country, 2018 - 2030 (USD Million)
- TABLE 88 Latin America Stem Cells Market, by Product 2018 - 2030 (USD Million)
- TABLE 89 Latin America Stem Cells Market, by Application 2018 - 2030 (USD Million)
- TABLE 90 Latin America Stem Cells Market, by Technology 2018 - 2030 (USD Million)
- TABLE 91 Latin America Stem Cells Market, by Therapy 2018 - 2030 (USD Million)
- TABLE 92 Latin America Stem Cells Market, by End-use, 2018 - 2030 (USD Million)
- TABLE 93 Brazil Stem Cells Market, by Product 2018 - 2030 (USD Million)
- TABLE 94 Brazil Stem Cells Market, by Application 2018 - 2030 (USD Million)
- TABLE 95 Brazil Stem Cells Market, by Technology 2018 - 2030 (USD Million)
- TABLE 96 Brazil Stem Cells Market, by Therapy 2018 - 2030 (USD Million)
- TABLE 97 Brazil Stem Cells Market, by End-use, 2018 - 2030 (USD Million)
- TABLE 98 Mexico Stem Cells Market, by Product 2018 - 2030 (USD Million)
- TABLE 99 Mexico Stem Cells Market, by Application 2018 - 2030 (USD Million)
- TABLE 100 Mexico Stem Cells Market, by Technology 2018 - 2030 (USD Million)
- TABLE 101 Mexico Stem Cells Market, by Therapy 2018 - 2030 (USD Million)
- TABLE 102 Mexico Stem Cells Market, by End-use, 2018 - 2030 (USD Million)
- TABLE 103 Argentina Stem Cells Market, by Product 2018 - 2030 (USD Million)
- TABLE 104 Argentina Stem Cells Market, by Application 2018 - 2030 (USD Million)
- TABLE 105 Argentina Stem Cells Market, by Technology 2018 - 2030 (USD Million)
- TABLE 106 Argentina Stem Cells Market, by Therapy 2018 - 2030 (USD Million)
- TABLE 107 Argentina Stem Cells Market, by End-use, 2018 - 2030 (USD Million)
- TABLE 108 Middle East & Africa Stem Cells Market, by Country, 2018 - 2030 (USD Million)
- TABLE 109 Middle East & Africa Stem Cells Market, by Product 2018 - 2030 (USD Million)
- TABLE 110 Middle East & Africa Stem Cells Market, by Application 2018 - 2030 (USD Million)
- TABLE 111 Middle East & Africa Stem Cells Market, by Technology 2018 - 2030 (USD Million)
- TABLE 112 Middle East & Africa Stem Cells Market, by Therapy 2018 - 2030 (USD Million)
- TABLE 113 Middle East & Africa Stem Cells Market, by End-use, 2018 - 2030 (USD Million)
- TABLE 114 South Africa Stem Cells Market, by Product 2018 - 2030 (USD Million)
- TABLE 115 South Africa Stem Cells Market, by Application 2018 - 2030 (USD Million)
- TABLE 116 South Africa Stem Cells Market, by Technology 2018 - 2030 (USD Million)
- TABLE 117 South Africa Stem Cells Market, by Therapy 2018 - 2030 (USD Million)
- TABLE 118 South Africa Stem Cells Market, by End-use, 2018 - 2030 (USD Million)
- TABLE 119 Saudi Arabia Stem Cells Market, by Product 2018 - 2030 (USD Million)
- TABLE 120 Saudi Arabia Stem Cells Market, by Application 2018 - 2030 (USD Million)
- TABLE 121 Saudi Arabia Stem Cells Market, by Technology 2018 - 2030 (USD Million)
- TABLE 122 Saudi Arabia Stem Cells Market, by Therapy 2018 - 2030 (USD Million)
- TABLE 123 Saudi Arabia Stem Cells Market, by End-use, 2018 - 2030 (USD Million)
- TABLE 124 UAE Stem Cells Market, by Product 2018 - 2030 (USD Million)
- TABLE 125 UAE Stem Cells Market, by Application 2018 - 2030 (USD Million)
- TABLE 126 UAE Stem Cells Market, by Technology 2018 - 2030 (USD Million)
- TABLE 127 UAE Stem Cells Market, by Therapy 2018 - 2030 (USD Million)
- TABLE 128 UAE Stem Cells Market, by End-use, 2018 - 2030 (USD Million)
List of Figures
- FIG. 1 Market research process
- FIG. 2 Information Procurement
- FIG. 3 Primary Research Pattern
- FIG. 4 Market Research Approaches
- FIG. 5 Value Chain-Based Sizing & Forecasting
- FIG. 6 Market Formulation & Validation
- FIG. 7 Stem Cells Market Segmentation
- FIG. 8 Market Snapshot, 2021
- FIG. 9 Market Trends & Outlook
- FIG. 10 Market Driver Relevance Analysis (Current & Future Impact)
- FIG. 11 Market Restraint Relevance Analysis (Current & Future Impact)
- FIG. 12 Market Challenge Relevance Analysis (Current & Future Impact)
- FIG. 13 SWOT Analysis, By Factor (Political & Legal, Economic and Technological)
- FIG. 14 Porter's Five Forces Analysis
- FIG. 15 Market Penetration Vs Growth Prospect Mapping, 2021
- FIG. 16 Global Stem Cells Market: Product Movement Analysis
- FIG. 17 Global Stem Cells Market, for Adult Stem Cells, 2018 - 2030 (USD Million)
- FIG. 18 Global Stem Cells Market, for Hematopoietic Stem Cells (Blood Stem Cells), 2018 - 2030 (USD Million)
- FIG. 19 Global Stem Cells Market, for Mesenchymal Stem Cells, 2018 - 2030 (USD Million)
- FIG. 20 Global Stem Cells Market, for Neural Stem Cells, 2018 - 2030 (USD Million)
- FIG. 21 Global Stem Cells Market, for Epithelial/Skin Stem Cells, 2018 - 2030 (USD Million)
- FIG. 22 Global Stem Cells Market, for Other Adult Stem Cells, 2018 - 2030 (USD Million)
- FIG. 23 Global Stem Cells Market, for Human Embryonic Stem Cells, 2018 - 2030 (USD Million)
- FIG. 24 Global Stem Cells Market, for Induced Pluripotent Stem Cells, 2018 - 2030 (USD Million)
- FIG. 25 Global Stem Cells Market, for Very Small Embryonic Like Stem Cells, 2018 - 2030 (USD Million)
- FIG. 26 Global Stem Cells Market: Application Movement Analysis
- FIG. 27 Global Stem Cells Market, for Regenerative Medicine, 2018 - 2030 (USD Million)
- FIG. 28 Global Stem Cells Market, for Neurology, 2018 - 2030 (USD Million)
- FIG. 29 Global Stem Cells Market, for Orthopedics, 2018 - 2030 (USD Million)
- FIG. 30 Global Stem Cells Market, for Oncology, 2018 - 2030 (USD Million)
- FIG. 31 Global Stem Cells Market, for Hematology, 2018 - 2030 (USD Million)
- FIG. 32 Global Stem Cells Market, for Cardiovascular and Myocardial Infraction, 2018 - 2030 (USD Million)
- FIG. 33 Global Stem Cells Market, for Injuries, 2018 - 2030 (USD Million)
- FIG. 34 Global Stem Cells Market, for Diabetes, 2018 - 2030 (USD Million)
- FIG. 35 Global Stem Cells Market, for Liver Disorder, 2018 - 2030 (USD Million)
- FIG. 36 Global Stem Cells Market, for Incontinence, 2018 - 2030 (USD Million)
- FIG. 37 Global Stem Cells Market, for Others, 2018 - 2030 (USD Million)
- FIG. 38 Global Stem Cells Market, for Drug Discovery and Development, 2018 - 2030 (USD Million)
- FIG. 39 Global Stem Cells Market: Technology Movement Analysis
- FIG. 40 Global Stem Cells Market, for Cell Acquisition, 2018 - 2030 (USD Million)
- FIG. 41 Global Stem Cells Market, for Bone Marrow Harvest, 2018 - 2030 (USD Million)
- FIG. 42 Global Stem Cells Market, for Umbilical Blood Cord, 2018 - 2030 (USD Million)
- FIG. 43 Global Stem Cells Market, for Apheresis, 2018 - 2030 (USD Million)
- FIG. 44 Global Stem Cells Market, for Cell Production, 2018 - 2030 (USD Million)
- FIG. 45 Global Stem Cells Market, for Therapeutic Cloning, 2018 - 2030 (USD Million)
- FIG. 46 Global Stem Cells Market, for In Vitro Fertilization, 2018 - 2030 (USD Million)
- FIG. 47 Global Stem Cells Market, for Cell Culture, 2018 - 2030 (USD Million)
- FIG. 48 Global Stem Cells Market, for Isolation, 2018 - 2030 (USD Million)
- FIG. 49 Global Stem Cells Market, for Cryopreservation, 2018 - 2030 (USD Million)
- FIG. 50 Global Stem Cells Market, for Expansion and Sub-Culture, 2018 - 2030 (USD Million)
- FIG. 51 Global Stem Cells Market: Therapy Movement Analysis
- FIG. 52 Global Stem Cells Market, for Autologous, 2018 - 2030 (USD Million)
- FIG. 53 Global Stem Cells Market, for Allogenic, 2018 - 2030 (USD Million)
- FIG. 54 Global Stem Cells Market, End-User Movement Analysis
- FIG. 55 Global Stem Cells Market, for Pharmaceutical and Biotechnology Companies, 2018 - 2030 (USD Million)
- FIG. 56 Global Stem Cells Market, for Hospitals & Cell Banks, 2018 - 2030 (USD Million)
- FIG. 57 Global Stem Cells Market, for Academic & Research Institutes, 2018 - 2030 (USD Million)
- FIG. 58 Regional Marketplace: Key Takeaways
- FIG. 59 Regional Outlook, 2021 & 2030
- FIG. 60 Global Stem Cells Market: Region Movement Analysis
- FIG. 61 North America Stem Cells Market, 2018 - 2030 (USD Million)
- FIG. 62 U.S. Stem Cells Market, 2018 - 2030 (USD Million)
- FIG. 63 Canada Stem Cells Market, 2018 - 2030 (USD Million)
- FIG. 64 Europe Stem Cells Market, 2018 - 2030 (USD Million)
- FIG. 65 Germany Stem Cells Market, 2018 - 2030 (USD Million)
- FIG. 66 U.K. Stem Cells Market, 2018 - 2030 (USD Million)
- FIG. 67 France Stem Cells Market, 2018 - 2030 (USD Million)
- FIG. 68 Italy Stem Cells Market, 2018 - 2030 (USD Million)
- FIG. 69 Spain Stem Cells Market, 2018 - 2030 (USD Million)
- FIG. 70 Asia Pacific Stem Cells Market, 2018 - 2030 (USD Million)
- FIG. 71 Japan Stem Cells Market, 2018 - 2030 (USD Million)
- FIG. 72 China Stem Cells Market, 2018 - 2030 (USD Million)
- FIG. 73 India Stem Cells Market, 2018 - 2030 (USD Million)
- FIG. 74 Australia Stem Cells Market, 2018 - 2030 (USD Million)
- FIG. 75 South Korea Stem Cells Market, 2018 - 2030 (USD Million)
- FIG. 76 Latin America Stem Cells Market, 2018 - 2030 (USD Million)
- FIG. 77 Brazil Stem Cells Market, 2018 - 2030 (USD Million)
- FIG. 78 Mexico Stem Cells Market, 2018 - 2030 (USD Million)
- FIG. 79 Argentina Stem Cells Market, 2018 - 2030 (USD Million)
- FIG. 80 Middle East and Africa Stem Cells Market, 2018 - 2030 (USD Million)
- FIG. 81 South Africa Stem Cells Market, 2018 - 2030 (USD Million)
- FIG. 82 Saudi Arabia Stem Cells Market, 2018 - 2030 (USD Million)
- FIG. 83 UAE Stem Cells Market, 2018 - 2030 (USD Million)
Stem Cells Market Growth & Trends:
The global stem cells market size is expected to reach USD 31.6 billion by 2030, registering a CAGR of 11.4% from 2022 to 2030, according to a new report by Grand View Research, Inc. Stem cells are cells that can differentiate into a variety of other cells, eventually forming organs or tissues. Many studies have been conducted over the years to assess the true potential of stem cells, leading to a variety of applications in the fields of genetic disease treatment, neurological disorders, oncology, and organ regeneration. The market is driven by the rising number of banks, growing focus on increasing therapeutic potential of these products, and extensive research for the development of regenerative medicines, among other factors.
The growing focus on regenerative therapies is fueling market expansion. iPSCs are becoming increasingly popular for the creation of customized cellular therapies, and opening up new possibilities in regenerative medicine. For instance, in September 2020, researchers from Duke-NUS and Monash University discovered the first stem cell that can aid in the treatment of placenta issues during pregnancy. The researchers devised a new method for producing induced trophoblast stem cells that can be used to generate placenta cells. The research will aid in the development of an in-vitro human placenta model and pave the way for future therapies.
Moreover, COVID-19 is acting as a catalyst for promoting the market growth. Several countries such as U.S., China, and Iran, have started conducting clinical trials using cellular therapies for treatment of COVID-19 infections. Furthermore, the use of cell therapy in the treatment of COVID-19 patients has yielded excellent results, which is fueling market expansion. In January 2020, a group of researchers in Beijing, China, tested stem cell treatment on patients to see if it was beneficial against COVID-19. The study found that administering intravenous clinical-grade MSCs to COVID-19 patients during first trial of treatment, improved their functional results and promoted enhanced recovery.
Increasing prevalence of cancer is one of the key factors contributing to the growth over the forecast period. Failure of combination therapy and chemotherapy for treatment of cancer has led to the shift in preference of physicians from such therapies to autologous and allogeneic stem cell therapy, thereby boosting the growth. Moreover, key market players and the government bodies are continuously investing in cancer research. For instance, in November 2021, California Institute for Regenerative Medicine invested USD 4 million in therapy targeting patients with acute lymphoblastic leukemia (ALL), chronic lymphocytic leukemia (CLL) and mantle cell lymphoma (MCL)
Introduction of novel technologies for the usage and adoption of cell based therapy is expected to boost the growth over the forecast period. Automation in adult stem cell & cord blood processing and storage are the key technologies expected to positively influence the market growth. For instance, various scientists are aiming for the approval of safe, and successful treatments using stem cells in a broad range of diseases. In 2021, companies such as Biotech Cellino invested USD 75 million in an effort to merge Artificial Intelligence technology for the development of automated stem cell manufacturing, that has the ability to regularizing access to cell treatments while aiming to be cost effective.
On the other hand, high cost of therapy is expected to hinder the market growth. For example, Bio informant, a stem cell research firm, reported that the cost of stem cell therapy ranges between USD 5,000 and USD 8,000 per patient, with some cases costing as much as USD 25,000 or more depending on the complexity of the procedure. Furthermore, restrictions on stem cell research activities have traditionally hampered embryonic stem cell growth, resulting in a meager share of the total market despite its advantages.
Stem Cells Market Report Highlights:
- ASCs segment accounted for the largest share in 2021 as it is considered as a gold standard in stem cell-based therapies. They are widely accepted owing to their consistent clinical success especially in hematopoietic transplants and there is a relatively less controversial view regarding their origin
- The iPSC segment is expected to witness a lucrative CAGR through 2022-2030 owing to the increasing focus of companies in using iPS for cell therapies. For instance, in July 2020, Cynata Therapeutics Limited announced positive results for the phase 1 clinical trial of CYP-001, the company's lead iPSC derived Cymerus
- Regenerative medicine dominated the market in 2021 owing to increasing funding by the government for the development of regenerative medicines. For instance, in October 2020, the AusBiotech-led consortium received funding of USD 300,000 from MTPConnect's Industry Growth Centre Project Fund for the development of regenerative medicines in Australia
- Cell acquisition technology held the largest market share in 2021 and is expected to expand at the fastest CAGR through 2022-2030 owing to increasing research studies involving cell harvesting
- Allogenic therapy dominated the market in 2021 owing to the increasing application of allogeneic stem cell transplants for cancer treatment
- Pharmaceutical and biotechnology companies held the largest market share in 2021, and is anticipated to exhibit at fastest CAGR owing to upsurge in R&D, increasing clinical trials coupled with strategic activities by major market players
- North America market encompasses U.S. and Canada. The factors contributing to the market growth in the region include robust government funding, increasing research, and the presence of prominent players in this region
- Asia Pacific is expected to grow with the fastest CAGR of through 2022 to 2030 owing to increasing expansion by key companies in this region. For instance, in April 2020, Seneca Biopharma completed its new stem cell manufacturing facility in Suzhou, China
Table of Contents
Chapter 1 Research Technologyology
- 1.1 Market Segmentation & Scope
- 1.1.1 Estimates And Forecast Timeline
- 1.2 Research Technologyology
- 1.3 Information Procurement
- 1.3.1 Purchased Database
- 1.3.2 Gvr's Internal Database
- 1.3.3 Secondary Sources
- 1.3.4 Primary Research
- 1.3.5 Details Of Primary Research
- 1.4 Information or Data Analysis
- 1.4.1 Data Analysis Models
- 1.5 Market Formulation & Validation
- 1.6 Model Details
- 1.6.1 Commodity Flow Analysis
- 1.6.1.1 Approach 1: Commodity flow approach
- 1.6.1.2 Approach 2: Country-wise market estimation using bottom-up approach
- 1.6.1 Commodity Flow Analysis
- 1.7 Global Market: CAGR Calculation
- 1.8 Research Assumptions
- 1.9 List of Secondary Sources
- 1.10 List of Primary Sources
- 1.11 Objectives
- 1.11.1 Objective 1:
- 1.11.2 Objective 2:
- 1.12 List Of Abbreviations
Chapter 2 Market Definitions
Chapter 3 Executive Summary
- 3.1 Market Summary
Chapter 4 Global Stem Cells Market Market Variables, Trends, & Scope
- 4.1 Stem Cells Market Lineage Outlook
- 4.1.1 Parent Market Outlook
- 4.2 Penetration and Growth Prospect Mapping
- 4.3 Regulatory Framework
- 4.4 Market Driver Analysis
- 4.4.1 Ongoing Developments In Regenerative Medicine
- 4.4.2 Rising Funds For Accelerating Stem Cell Research
- 4.4.3 Growing Demand For Stem Cell Banking
- 4.4.4 Increasing Prevalence Of Genetic Disorders
- 4.5 Market Restraint Analysis
- 4.5.1 Ethical Concern Related To Stem Cell Research
- 4.5.1 Lack Of A Well-Defined Regulatory Framework In Certain Applications Of Stem Cell
- 4.6 Key Opportunities
- 4.6.1 Demand For Cell & Gene Therapies
- 4.7 Key Challenge
- 4.7.1 Technical Limitations Associated With Manufacturing Processes
- 4.8 Stem Cells Market - Pestle Analysis
- 4.9 Industry Analysis - Porter's
- 4.10 Major Deals And Strategic Alliances Analysis
- 4.10.1 Joint Ventures
- 4.10.2 Mergers And Acquisitions
- 4.10.3 Licensing And Partnership
- 4.10.4 Technology Collaborations
- 4.10.5 Strategic Divestments
- 4.11 COVID-19 Impact Analysis
Chapter 5 Stem Cells Market - Segment Analysis, by Product, 2018 - 2030 (USD Million)
- 5.1 Global Stem Cells Market: Product Movement Analysis
- 5.2 Adult Stem Cells (ASCs)
- 5.2.1 Adult Stem Cells (Ascs) Market Estimates And Forecast, 2018 - 2030 (USD Million)
- 5.2.2 Hematopoietic Stem Cells (Blood Stem Cells)
- 5.2.2.1 Hematopoietic stem cells (blood stem cells) market estimates and forecasts, 2018 - 2030 (USD Million)
- 5.2.3 Mesenchymal Stem Cells
- 5.2.3.1 Mesenchymal stem cells market estimates and forecasts, 2018 - 2030 (USD Million)
- 5.2.4 Neural Stem Cells
- 5.2.4.1 Neural stem cells market estimates and forecasts, 2018 - 2030 (USD Million)
- 5.2.5 Epithelial/Skin Stem Cells
- 5.2.5.1 Epithelial/Skin stem cells market estimates and forecasts, 2018 - 2030 (USD Million)
- 5.2.6 Other Adult Stem Cells
- 5.2.6.1 Other adult stem cells market estimates and forecasts, 2018 - 2030 (USD Million)
- 5.3 Human Embryonic Stem Cells
- 5.3.1 Human Embryonic Stem Cells Market Estimates And Forecast, 2018 - 2030 (USD Million)
- 5.4 Induced Pluripotent Stem Cells
- 5.4.1 Induced Pluripotent Stem Cells Market Estimates And Forecast, 2018 - 2030 (USD Million)
- 5.5 Very Small Embryonic Like Stem Cells
- 5.5.1 Very Small Embryonic Like Stem Cells Market Estimates And Forecast, 2018 - 2030 (USD Million)
Chapter 6 Stem Cells Market- Segment Analysis, by Application, 2018 - 2030 (USD Million)
- 6.1 Stem Cells Market: Application Movement Analysis
- 6.2 Regenerative Medicine
- 6.2.1 Regenerative Medicine Market Estimates And Forecast, 2018 - 2030 (USD Million)
- 6.2.2 Neurology
- 6.2.2.1 Neurology market estimates and forecasts, 2018 - 2030 (USD Million)
- 6.2.3 Orthopedics
- 6.2.3.1 Orthopedics market estimates and forecasts, 2018 - 2030 (USD Million)
- 6.2.4 Oncology
- 6.2.4.1 Oncology market estimates and forecasts, 2018 - 2030 (USD Million)
- 6.2.5 Hematology
- 6.2.5.1 Hematology market estimates and forecasts, 2018 - 2030 (USD Million)
- 6.2.6 Cardiovascular and Myocardial Infraction
- 6.2.6.1 Cardiovascular and myocardial infraction market estimates and forecasts, 2018 - 2030 (USD Million)
- 6.2.7 Injuries
- 6.2.7.1 Injuries market estimates and forecasts, 2018 - 2030 (USD Million)
- 6.2.8 Diabetes
- 6.2.8.1 Diabetes market estimates and forecasts, 2018 - 2030 (USD Million)
- 6.2.9 Liver Disorder
- 6.2.9.1 Liver Disorder market estimates and forecasts, 2018 - 2030 (USD Million)
- 6.2.10 Incontinence
- 6.2.10.1 Incontinence market estimates and forecasts, 2018 - 2030 (USD Million)
- 6.2.11 Others
- 6.2.11.1 Others market estimates and forecasts, 2018 - 2030 (USD Million)
- 6.3 Drug Discovery and Development
- 6.3.1 Drug Discovery And Development Market Estimates And Forecast, 2018 - 2030 (USD Million)
Chapter 7 Stem Cells Market - Segment Analysis, by Technology, 2018 - 2030 (USD Million)
- 7.1 Global Stem Cells Market: Technology Movement Analysis
- 7.2 Cell Acquisition
- 7.2.1 Cell Acquisition Market Estimates And Forecast, 2018 - 2030 (USD Million)
- 7.2.2 Bone Marrow Harvest
- 7.2.2.1 Bone Marrow Harvest market estimates and forecasts, 2018 - 2030 (USD Million)
- 7.2.3 Umbilical Blood Cord
- 7.2.3.1 Umbilical Blood Cord market estimates and forecasts, 2018 - 2030 (USD Million)
- 7.2.4 Apheresis
- 7.2.4.1 Apheresis market estimates and forecasts, 2018 - 2030 (USD Million)
- 7.3 Cell Production
- 7.3.1 Cell Production Market Estimates And Forecast, 2018 - 2030 (USD Million)
- 7.3.2 Therapeutic Cloning
- 7.2.3.1 Therapeutic Cloning market estimates and forecasts, 2018 - 2030 (USD Million)
- 7.3.3 In Vitro Fertilization
- 7.3.3.1 In Vitro Fertilization market estimates and forecasts, 2018 - 2030 (USD Million)
- 7.3.4 Cell Culture
- 7.3.4.1 Cell Culture market estimates and forecasts, 2018 - 2030 (USD Million)
- 7.3.5 Isolation
- 7.3.5.1 Isolation market estimates and forecasts, 2018 - 2030 (USD Million)
- 7.4 Cryopreservation
- 7.4.1 Cryopreservation Market Estimates And Forecast, 2018 - 2030 (USD Million)
- 7.5 Expansion And Sub-Culture
- 7.5.1 Expansion And Sub-Culture Market Estimates And Forecast, 2018 - 2030 (USD Million)
Chapter 8 Stem Cells Market - Segment Analysis, By Therapy, 2018 - 2030 (USD Million)
- 8.1 Global Stem Cells Market: Therapy Movement Analysis
- 8.2 Autologous
- 8.2.1 Autologous Market Estimates And Forecast, 2018 - 2030 (USD Million)
- 8.3 Allogenic
- 8.3.1 Allogenic Market Estimates And Forecast, 2018 - 2030 (USD Million)
Chapter 9 Stem Cells Market - Segment Analysis, By End-User, 2018 - 2030 (USD Million)
- 9.1 Global Stem Cells Market: End-User Movement Analysis
- 9.2 Pharmaceutical And Biotechnology Companies
- 9.2.1 Pharmaceutical And Biotechnology Companies Market Estimates And Forecast, 2018 - 2030 (USD Million)
- 9.3 Hospitals & Cell Banks
- 9.3.1 Hospitals & Cell Banks Market Estimates And Forecast, 2018 - 2030 (USD Million)
- 9.4 Academic & Research Institutes
- 9.4.1 Academic & Research Institutes Market Estimates And Forecast, 2018 - 2030 (USD Million)
Chapter 10 Stem Cells Market: - Segment Analysis, By Region, 2018 - 2030 (USD Million)
- 10.1 Stem Cells Market: Regional Movement Analysis
- 10.2 North America
- 10.2.1 North America Market Estimates And Forecast, 2018 - 2030 (USD Million)
- 10.2.2 U.S.
- 10.2.2.1 U.S. market estimates and forecast, 2018 - 2030 (USD Million)
- 10.2.3 Canada
- 10.2.3.1 Canada market estimates and forecast, 2018 - 2030 (USD Million)
- 10.3 Europe
- 10.3.1 Europe Market Estimates And Forecast, 2018 - 2030 (USD Million)
- 10.3.2 U.K.
- 10.3.2.1 U.K. market estimates and forecast, 2018 - 2030 (USD Million)
- 10.3.3. Germany
- 10.3.3.1 Germany market estimates and forecast, 2018 - 2030 (USD Million)
- 10.3.4 France
- 10.3.4.1 France market estimates and forecast, 2018 - 2030 (USD Million)
- 10.3.5. Italy
- 10.3.5.1 Italy market estimates and forecast, 2018 - 2030 (USD Million)
- 10.3.5 Spain
- 10.3.5.1 Spain market estimates and forecast, 2018 - 2030 (USD Million)
- 10.4 Asia Pacific
- 10.4.1 Asia Pacific Market Estimates And Forecast, 2018 - 2030 (USD Million)
- 10.4.2 Japan
- 10.4.2.1 Japan market estimates and forecast, 2018 - 2030 (USD Million)
- 10.4.3 China
- 10.4.3.1 China market estimates and forecast, 2018 - 2030 (USD Million)
- 10.4.4 India
- 10.4.4.1 India Market Estimates And Forecast, 2018 - 2030 (USD Million)
- 10.4.5 South Korea
- 10.4.5.1 South Korea Market Estimates And Forecast, 2018 - 2030 (USD Million)
- 10.4.6 Australia
- 10.4.6.1 Australia Market Estimates And Forecast, 2018 - 2030 (USD Million)
- 10.5 Latin America
- 10.5.1 Latin America Market Estimates And Forecast, 2018 - 2030 (USD Million)
- 10.5.2 Brazil
- 10.5.2.1 Brazil Market Estimates And Forecast, 2018 - 2030 (USD Million)
- 10.5.3 Mexico
- 10.5.3.1 Mexico Market Estimates And Forecast, 2018 - 2030 (USD Million)
- 10.5.4 Argentina
- 10.5.4.1 Argentina market estimates and forecast, 2018 - 2030 (USD Million)
- 10.6 Middle East & Africa (MEA)
- 10.6.1 Middle East & Africa Market Estimates And Forecast, 2018 - 2030 (USD Million)
- 10.6.1 South Africa
- 10.6.1.1 South Africa Market Estimates And Forecast, 2018 - 2030 (USD Million)
- 10.6.2 Saudi Arabia
- 10.6.2.1 Saudi Arabia market estimates and forecast, 2018 - 2030 (USD Million)
- 10.6.3 UAE
- 10.6.3.1 UAE market estimates and forecast, 2018 - 2030 (USD Million)
Chapter 11 Competitive Landscape
- 11.1 Public Companies
- 11.1.1 Company Market Position Analysis
- 11.1.2 Competitive Dashboard Analysis
- 11.1.3 Strategic Framework
- 11.2 Private Companies
- 11.2.1 List Of Key Emerging Companies/Technology Disruptors/Innovators
- 11.2.2 Regional Network Map
- 11.3 Company Profiles
- 11.3.1 ADVANCED CELL TECHNOLOGY, INC.
- 11.3.1.1 Company Overview
- 11.3.1.2 Financial Performance
- 11.3.1.3 Product Benchmarking
- 11.3.1.4 Strategic Initiatives
- 11.3.2 STEMCELL Technologies, Inc.
- 11.3.2.1 Company Overview
- 11.3.2.2 Financial Performance
- 11.3.2.3 Product Benchmarking
- 11.3.2.4 Strategic Initiatives
- 11.3.3 CELLULAR ENGINEERING TECHNOLOGIES INC.
- 11.3.3.1 Company Overview
- 11.3.3.2 Financial Performance
- 11.3.3.3 Product Benchmarking
- 11.3.3.4 Strategic Initiatives
- 11.3.4 CELLGENIX GmbH
- 11.3.4.1 Company Overview
- 11.3.4.2 Financial Performance
- 11.3.4.3 Product Benchmarking
- 11.3.4.4 Strategic Initiatives
- 11.3.5 PROMOCELL GMBH
- 11.3.5.1 Company Overview
- 11.3.5.2 Financial Performance
- 11.3.5.3 Product Benchmarking
- 11.3.5.4 Strategic Initiatives
- 11.3.6 LONZA
- 11.3.6.1 Company Overview
- 11.3.6.2 Financial Performance
- 11.3.6.3 Product Benchmarking
- 11.3.6.4 Strategic Initiatives
- 11.3.7 KITE PHARMA
- 11.3.7.1 Company Overview
- 11.3.7.2 Financial Performance
- 11.3.7.3 Product Benchmarking
- 11.3.7.4 Strategic Initiatives
- 11.3.8 CELLARTIS AB
- 11.3.8.1 Company Overview
- 11.3.8.2 Financial Performance
- 11.3.8.3 Product Benchmarking
- 11.3.8.4 Strategic Initiatives
- 11.3.9 ANGEL BIOTECHNOLOGY
- 11.3.9.1 Company Overview
- 11.3.9.2 Financial Performance
- 11.3.9.3 Product Benchmarking
- 11.3.9.4 Strategic Initiatives
- 11.3.10 BRAINSTORM CELL THERAPEUTICS
- 11.3.10.1 Company Overview
- 11.3.10.2 Financial Performance
- 11.3.10.3 Product Benchmarking
- 11.3.10.4 Strategic Initiatives
- 11.3.11 CELGENE CORPORATION
- 11.3.11.1 Company Overview
- 11.3.11.2 Financial Performance
- 11.3.11.3 Product Benchmarking
- 11.3.11.4 Strategic Initiatives
- 11.3.12 OSIRIS THERAPEUTICS, INC.
- 11.3.12.1 Company Overview
- 11.3.12.2 Financial Performance
- 11.3.12.3 Product Benchmarking
- 11.3.12.4 Strategic Initiatives
- 11.3.13 GENEA BIOCELLS
- 11.3.13.1 Company Overview
- 11.3.13.2 Financial Performance
- 11.3.13.3 Product Benchmarking
- 11.3.13.4 Strategic Initiatives
- 11.3.14 BIOHEART INC.
- 11.3.14.1 Company Overview
- 11.3.14.2 Financial Performance
- 11.3.14.3 Product Benchmarking
- 11.3.14.4 Strategic Initiatives
- 11.3.15 WAISMAN BIOMANUFACTURING
- 11.3.15.1 Company Overview
- 11.3.15.2 Financial Performance
- 11.3.15.3 Product Benchmarking
- 11.3.15.4 Strategic Initiatives
- 11.3.16 TIGENIX
- 11.3.16.1 Company Overview
- 11.3.16.2 Financial Performance
- 11.3.16.3 Product Benchmarking
- 11.3.16.4 Strategic Initiatives
- 11.3.17 CALADRIUS
- 11.3.17.1 Company Overview
- 11.3.17.2 Financial Performance
- 11.3.17.3 Product Benchmarking
- 11.3.17.4 Strategic Initiatives
- 11.3.18 GAMIDA CELL.
- 11.3.18.1 Company Overview
- 11.3.18.2 Financial Performance
- 11.3.18.3 Product Benchmarking
- 11.3.18.4 Strategic Initiatives
- 11.3.19 PLURISTEM THERAPEUTICS INC.
- 11.3.19.1 Company Overview
- 11.3.19.2 Financial Performance
- 11.3.19.3 Product Benchmarking
- 11.3.19.4 Strategic Initiatives
- 11.3.1 ADVANCED CELL TECHNOLOGY, INC.