|
|
市場調査レポート
商品コード
1122133
マテリアルハンドリング機器の市場規模、シェア、動向分析レポート:製品別(クレーン・昇降装置、ラック・保管装置)、用途別、地域別、セグメント別予測、2022年~2030年Material Handling Equipment Market Size, Share & Trends Analysis Report By Product (Cranes & Lifting Equipment, Racking & Storage Equipment), By Application, By Region, And Segment Forecasts, 2022 - 2030 |
||||||
|
|
|||||||
|
● お客様のご希望に応じて、既存データの加工や未掲載情報(例:国別セグメント)の追加などの対応が可能です。 詳細はお問い合わせください。 |
|||||||


| マテリアルハンドリング機器の市場規模、シェア、動向分析レポート:製品別(クレーン・昇降装置、ラック・保管装置)、用途別、地域別、セグメント別予測、2022年~2030年 |
|
出版日: 2022年08月04日
発行: Grand View Research
ページ情報: 英文 137 Pages
納期: 2~10営業日
|
- 全表示
- 概要
- 図表
- 目次
マテリアルハンドリング機器市場の成長と動向
Grand View Research, Inc.の最新レポートによると、マテリアルハンドリング機器の世界市場規模は2030年までに3502億1000万米ドルに達し、2022年から2030年までCAGR5.7%で拡大すると予測されています。倉庫運営の柔軟性とサプライチェーンの透明性に対する需要の高まりが、業界の成長に好影響を与えると予想されます。マテリアルハンドリング機器の市場は、COVID-19の発生により、製造施設の操業停止や物流業界の減速が発生し、一時的に停止しました。事業停止が続いていることは、産業界を中心に業界の成長にマイナスの影響を及ぼしています。
倉庫では、小型ハンドトラック、パレットジャッキ、無人搬送車(AGV)、棚やラックなどが、在庫の所在確認、商品の迅速な移動、注文の管理、在庫のローカライズなどに必要とされます。倉庫の運用の柔軟性に対する需要の高まりとサプライチェーンの透明性の向上が、これらの製品の世界の需要を促進すると予想されます。ロボットシステムやコンベヤーの導入など、市場における継続的な自動化と技術的な改善、および自動搬送車やロボットシステムなどの自動化製品に対する需要の増加が、業界の成長を押し上げると予想されます。
マテリアルハンドリング機器は、産業オペレーションを強化し、タイムリーな材料供給を保証し、必要な労働力を削減します。また、最適なリソース活用のためのメーカーの増加要件と倉庫のダウンタイム上の急増懸念は、市場の成長を促進することが期待されます。本製品のメーカーは、市場への浸透を強化するために、M&Aやジョイントベンチャーなど、いくつかの戦略を採用しています。例えば、2022年6月、BEUMERグループは、コンベヤシステムのサプライヤーであるFAMグループを買収しました。この取り組みにより、BEUMER Groupは鉱物・鉱業分野での市場ポジションを強化しました。
マテリアルハンドリング機器市場のレポートハイライト
製品別では、建設、製造、半導体・電子機器などのさまざまな最終用途産業への浸透が進んだことから、クレーンとリフティング装置が2021年の世界収益の35.0%超を占めました。
eコマース分野は、オンラインショッピングプラットフォームの普及、大手オンラインマーチャントの存在、物流インフラの整備などの要因により、2021年に20.0%を超える最大の売上シェアを占めました。
アジア太平洋地域は、ピッキングとソートプロセスの効率と速度を向上させるアジア太平洋地域の食品小売セクターの成長により、2021年に35.0%を超える最大の売上高シェアを占めました。
ラテンアメリカは、自動車、eコマース、飲食品など、さまざまな最終用途産業への投資の増加により、予測期間中にCAGR 6.0%を記録すると推定されます。
マテリアルハンドリング機器のメーカーは、市場浸透を高めるために、買収、合併、合弁事業、新製品開発、地理的拡大など、さまざまな戦略を採用しています。
目次
第1章 調査手法と範囲
- 調査手法
- 調査範囲と前提
- 情報調達
- 購入したデータベース
- GVRの内部データベース
- 二次情報
- 第三者の視点
- 1次調査
- 情報分析
- データ分析モデル
- 市場形成とデータ可視化
- データソースへのリスト
第2章 エグゼクティブサマリー
- 市場の見通し
- セグメント別見通し
- 競合考察
第3章 市場変数、動向、および範囲
- 市場セグメンテーションと範囲
- 浸透と成長の見通しのマッピング
- バリューチェーン分析
- 市場力学
- 市場促進要因分析
- 市場制約分析
- 市場機会分析
- COVID-19影響分析
- ビジネス環境ツール分析
- ポーターのファイブフォース分析
- 供給企業の交渉力
- 買い手の交渉力
- 代替の脅威
- 新規参入業者の脅威
- 競争企業間の敵対関係
- PESTLE分析
- 政治情勢
- 経済情勢
- 社会情勢
- テクノロジー情勢
- 環境情勢
- 法的情勢
- ポーターのファイブフォース分析
第4章 マテリアルハンドリング機器市場:製品の推定・動向分析
- マテリアルハンドリング機器市場:製品変動分析、2021年および2030年
- クレーンおよび吊り上げ装置
- 産業用トラック
- 連続処理装置
- ラックおよび保管機器
第5章 マテリアルハンドリング機器市場:アプリケーションの推定・動向分析
- マテリアルハンドリング機器市場:アプリケーションの変動分析、2021年と2030年
- 自動車
- 食品と飲料
- 化学
- 半導体・エレクトロニクス
- eコマース
- 航空
- 医薬品
- その他
第6章 マテリアルハンドリング機器市場:地域の推定・動向分析
- マテリアルハンドリング機器の地域変動分析、2021年および2030年
- 北米
- 米国
- カナダ
- 欧州
- ドイツ
- フランス
- 英国
- イタリア
- スペイン
- アジア太平洋地域
- 中国
- インド
- 日本
- 韓国
- オーストラリア
- ラテンアメリカ
- ブラジル
- メキシコ
- アルゼンチン
- 中東とアフリカ
- 南アフリカ
- サウジアラビア
第7章 競合情勢
- 主要なプレーヤー、最近の開発、業界への影響
- 主要企業/競合の分類
- ベンダー情勢
- 競合ダッシュボード分析
- 公開会社
- 会社の市況分析
- プライベートカンパニー
- 主要な新興企業とその地理的プレゼンスのリスト
第8章 企業プロファイル
- BEUMER GROUP
- 会社概要
- 財務実績
- 製品のベンチマーク
- 戦略的イニシアチブ
- Daifuku Co., Ltd.
- 会社概要
- 財務実績
- 製品のベンチマーク
- 戦略的イニシアチブ
- Honeywell International, Inc.
- 会社概要
- 財務実績
- 製品のベンチマーク
- 戦略的イニシアチブ
- KION GROUP AG
- 会社概要
- 財務実績
- 製品のベンチマーク
- 戦略的イニシアチブ
- Mecalux, SA
- 会社概要
- 財務実績
- 製品のベンチマーク
- 戦略的イニシアチブ
- Murata Manufacturing Co., Ltd.
- 会社概要
- 財務実績
- 製品のベンチマーク
- 戦略的イニシアチブ
- SSI SCHAEFER
- 会社概要
- 財務実績
- 製品のベンチマーク
- 戦略的イニシアチブ
- Swisslog Holding AG
- 会社概要
- 財務実績
- 製品のベンチマーク
- 戦略的イニシアチブ
- TOYOTA INDUSTRIES CORPORATION
- 会社概要
- 財務実績
- 製品のベンチマーク
- 戦略的イニシアチブ
- Vanderlande Industries BV
- 会社概要
- 財務実績
- 製品のベンチマーク
- 戦略的イニシアチブ
List of Tables
- Table 1. Cranes & lifting equipment market estimates and forecasts, 2017 - 2030 (USD Billion)
- Table 2. Industrial trucks market estimates and forecasts, 2017 - 2030 (USD Billion)
- Table 3. Continuous handling equipment market estimates and forecasts, 2017 - 2030 (USD Billion)
- Table 4. Racking & storage equipment market estimates and forecasts, 2017 - 2030 (USD Billion)
- Table 5. Material handling equipment market estimates and forecasts, in automotive, 2017 - 2030 (USD Billion)
- Table 6. Material handling equipment market estimates and forecasts, in food & beverages, 2017 - 2030 (USD Billion)
- Table 7. Material handling equipment market estimates and forecasts, in chemical, 2017 - 2030 (USD Billion)
- Table 8. Material handling equipment market estimates and forecasts, in semiconductor & electronics, 2017 - 2030 (USD Billion)
- Table 9. Material handling equipment market estimates and forecasts, in e-commerce, 2017 - 2030 (USD Billion)
- Table 10. Material handling equipment market estimates and forecasts, in aviation, 2017 - 2030 (USD Billion)
- Table 11. Material handling equipment market estimates and forecasts, in pharmaceutical, 2017 - 2030 (USD Billion)
- Table 12. Material handling equipment market estimates and forecasts, in other applications, 2017 - 2030 (USD Billion)
- Table 13. North America material handling equipment market estimates and forecasts, 2017 - 2030 (USD Billion)
- Table 14. North America material handling equipment market estimates and forecasts, by product, 2017 - 2030 (USD Billion)
- Table 15. North America material handling equipment market estimates and forecasts, by application, 2017 - 2030 (USD Billion)
- Table 16. U.S. material handling equipment market estimates and forecasts, 2017 - 2030 (USD Billion)
- Table 17. U.S. material handling equipment market estimates and forecasts, by product, 2017 - 2030 (USD Billion)
- Table 18. U.S. material handling equipment market estimates and forecasts, by application, 2017 - 2030 (USD Billion)
- Table 19. Canada material handling equipment market estimates and forecasts, 2017 - 2030 (USD Billion)
- Table 20. Canada material handling equipment market estimates and forecasts, by product, 2017 - 2030 (USD Billion)
- Table 21. Canada material handling equipment market estimates and forecasts, by application, 2017 - 2030 (USD Billion)
- Table 22. Europe material handling equipment market estimates and forecasts, 2017 - 2030 (USD Billion)
- Table 23. Europe material handling equipment market estimates and forecasts, by product, 2017 - 2030 (USD Billion)
- Table 24. Europe material handling equipment market estimates and forecasts, by application, 2017 - 2030 (USD Billion)
- Table 25. Germany material handling equipment market estimates and forecasts, 2017 - 2030 (USD Billion)
- Table 26. Germany material handling equipment market estimates and forecasts, by product, 2017 - 2030 (USD Billion)
- Table 27. Germany material handling equipment market estimates and forecasts, by application, 2017 - 2030 (USD Billion)
- Table 28. France material handling equipment market estimates and forecasts, 2017 - 2030 (USD Billion)
- Table 29. France material handling equipment market estimates and forecasts, by product, 2017 - 2030 (USD Billion)
- Table 30. France material handling equipment market estimates and forecasts, by application, 2017 - 2030 (USD Billion)
- Table 31. U.K. material handling equipment market estimates and forecasts, 2017 - 2030 (USD Billion)
- Table 32. U.K. material handling equipment market estimates and forecasts, by product, 2017 - 2030 (USD Billion)
- Table 33. U.K. material handling equipment market estimates and forecasts, by application, 2017 - 2030 (USD Billion)
- Table 34. Italy material handling equipment market estimates and forecasts, 2017 - 2030 (USD Billion)
- Table 35. Italy material handling equipment market estimates and forecasts, by product, 2017 - 2030 (USD Billion)
- Table 36. Italy material handling equipment market estimates and forecasts, by application, 2017 - 2030 (USD Billion)
- Table 37. Spain material handling equipment market estimates and forecasts, 2017 - 2030 (USD Billion)
- Table 38. Spain material handling equipment market estimates and forecasts, by product, 2017 - 2030 (USD Billion)
- Table 39. Spain material handling equipment market estimates and forecasts, by application, 2017 - 2030 (USD Billion)
- Table 40. Asia Pacific material handling equipment market estimates and forecasts, 2017 - 2030 (USD Billion)
- Table 41. Asia Pacific material handling equipment market estimates and forecasts, by product, 2017 - 2030 (USD Billion)
- Table 42. Asia Pacific material handling equipment market estimates and forecasts, by application, 2017 - 2030 (USD Billion)
- Table 43. China material handling equipment market estimates and forecasts, 2017 - 2030 (USD Billion)
- Table 44. China material handling equipment market estimates and forecasts, by product, 2017 - 2030 (USD Billion)
- Table 45. China material handling equipment market estimates and forecasts, by application, 2017 - 2030 (USD Billion)
- Table 46. India material handling equipment market estimates and forecasts, 2017 - 2030 (USD Billion)
- Table 47. India material handling equipment market estimates and forecasts, by product, 2017 - 2030 (USD Billion)
- Table 48. India material handling equipment market estimates and forecasts, by application, 2017 - 2030 (USD Billion)
- Table 49. Japan material handling equipment market estimates and forecasts, 2017 - 2030 (USD Billion)
- Table 50. Japan material handling equipment market estimates and forecasts, by product, 2017 - 2030 (USD Billion)
- Table 51. Japan material handling equipment market estimates and forecasts, by application, 2017 - 2030 (USD Billion)
- Table 52. South Korea material handling equipment market estimates and forecasts, 2017 - 2030 (USD Billion)
- Table 53. South Korea material handling equipment market estimates and forecasts, by product, 2017 - 2030 (USD Billion)
- Table 54. South Korea material handling equipment market estimates and forecasts, by application, 2017 - 2030 (USD Billion)
- Table 55. Australia material handling equipment market estimates and forecasts, 2017 - 2030 (USD Billion)
- Table 56. Australia material handling equipment market estimates and forecasts, by product, 2017 - 2030 (USD Billion)
- Table 57. Australia material handling equipment market estimates and forecasts, by application, 2017 - 2030 (USD Billion)
- Table 58. Latin America material handling equipment market estimates and forecasts, 2017 - 2030 (USD Billion)
- Table 59. Latin America material handling equipment market estimates and forecasts, by product, 2017 - 2030 (USD Billion)
- Table 60. Latin America material handling equipment market estimates and forecasts, by application, 2017 - 2030 (USD Billion)
- Table 61. Brazil material handling equipment market estimates and forecasts, 2017 - 2030 (USD Billion)
- Table 62. Brazil material handling equipment market estimates and forecasts, by product, 2017 - 2030 (USD Billion)
- Table 63. Brazil material handling equipment market estimates and forecasts, by application, 2017 - 2030 (USD Billion)
- Table 64. Mexico material handling equipment market estimates and forecasts, 2017 - 2030 (USD Billion)
- Table 65. Mexico material handling equipment market estimates and forecasts, by product, 2017 - 2030 (USD Billion)
- Table 66. Mexico material handling equipment market estimates and forecasts, by application, 2017 - 2030 (USD Billion)
- Table 67. Argentina material handling equipment market estimates and forecasts, 2017 - 2030 (USD Billion)
- Table 68. Argentina material handling equipment market estimates and forecasts, by product, 2017 - 2030 (USD Billion)
- Table 69. Argentina material handling equipment market estimates and forecasts, by application, 2017 - 2030 (USD Billion)
- Table 70. Middle East & Africa material handling equipment market estimates and forecasts, 2017 - 2030 (USD Billion)
- Table 71. Middle East & Africa material handling equipment market estimates and forecasts, by product, 2017 - 2030 (USD Billion)
- Table 72. Middle East & Africa material handling equipment market estimates and forecasts, by application, 2017 - 2030 (USD Billion)
- Table 73. South Africa material handling equipment market estimates and forecasts, 2017 - 2030 (USD Billion)
- Table 74. South Africa material handling equipment market estimates and forecasts, by product, 2017 - 2030 (USD Billion)
- Table 75. South Africa material handling equipment market estimates and forecasts, by application, 2017 - 2030 (USD Billion)
- Table 76. Saudi Arabia material handling equipment market estimates and forecasts, 2017 - 2030 (USD Billion)
- Table 77. Saudi Arabia material handling equipment market estimates and forecasts, by product, 2017 - 2030 (USD Billion)
- Table 78. Middle East & Africa material handling equipment market estimates and forecasts, by application, 2017 - 2030 (USD Billion)
List of Figures
- Fig. 1 Information Procurement
- Fig. 2 Primary Research Pattern
- Fig. 3 Primary Research Process
- Fig. 4 Market research approaches - Bottom-Up Approach
- Fig. 5 Market research approaches - Top-Down Approach
- Fig. 6 Market research approaches - Combined Approach
- Fig. 7 Market Outlook
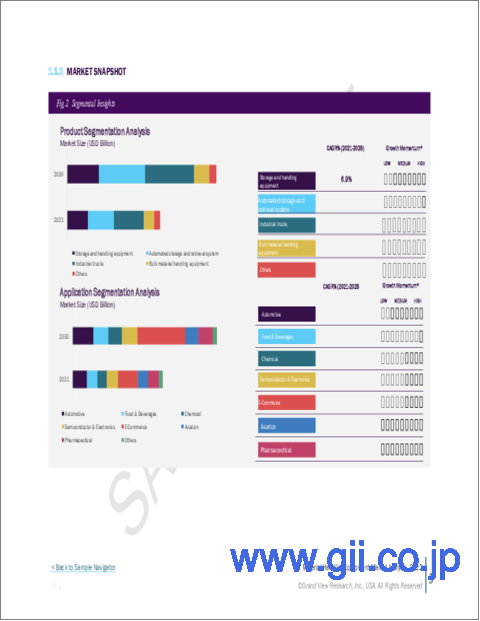
- Fig. 8 Segmental Outlook
- Fig. 9 Competitive Insights
- Fig. 10 Market Segmentation & Scope
- Fig. 11 Penetration and Growth Prospect Mapping
- Fig. 12 Industry Value Chain Analysis
- Fig. 13 Market Driver Analysis
- Fig. 14 Global E-commerce Revenue, by Region, 2020 (%)
- Fig. 15 Market Restraint Analysis
- Fig. 16 Material Handling Equipment Market: Product Movement Analysis, 2021 & 2030
- Fig. 17 Material Handling Equipment Market: Application Movement Analysis, 2021 & 2030
- Fig. 18 Material Handling Equipment Market: Regional Movement Analysis, 2021 & 2030
- Fig. 19 Key Company/Competition Categorization
- Fig. 20 Competitive Dashboard Analysis
- Fig. 21 Company Market Position Analysis
Material Handling Equipment Market Growth & Trends:
The global material handling equipment market size is expected to reach USD 350.21 billion by 2030, according to a new report by Grand View Research, Inc., expanding at a CAGR of 5.7% from 2022 to 2030. Growing demand for warehouse operational flexibility and supply chain transparency is anticipated to have a positive impact on industry growth. The market for material handling equipment was temporarily shut down due to the outbreak of COVID-19, resulting in the shutdown of manufacturing facilities and a slowdown in the logistics industry. The ongoing suspension of business operations has a negative effect on the growth of the industry, particularly in the industrial sector.
Small hand trucks, pallet jacks, automatic guided vehicles (AGVs), and shelves or racks are required in warehouses to locate the stock, move goods quickly, manage orders, and localize the stock. The rising demand for warehouse operational flexibility, combined with increased supply chain transparency, is anticipated to drive the global demand for these products. Ongoing automation and technological improvements in the market such as the introduction of robotic systems and conveyors and the increasing demand for automated products, such as automated guided vehicles automated conveyors, and robotic systems, are expected to boost the industry growth.
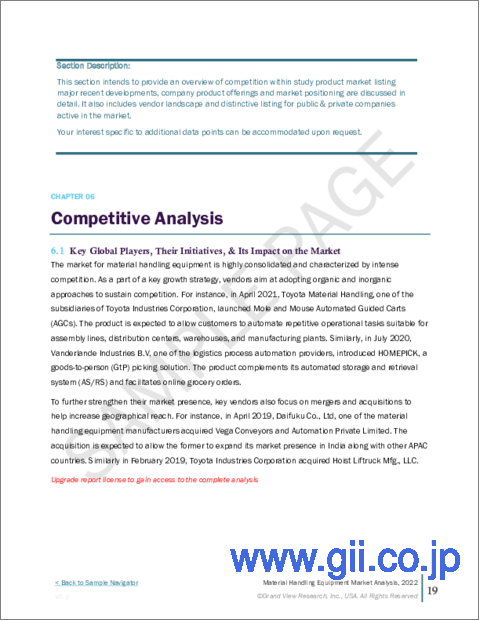
The material handling equipment enhances industrial operations, ensures timely material supply, and reduces labor requirements. In addition, increasing requirements of manufacturers for optimum resource utilization and surging concerns over warehouse downtime are expected to fuel the growth of the market. Manufacturers of the product adopt several strategies, including mergers and acquisitions and joint ventures, to enhance their market penetration. For instance, in June 2022, BEUMER Group acquired FAM Group, a supplier of conveyor systems. With this initiative, BEUMER Group strengthened its market position in the minerals and mining sectors.
Material Handling Equipment Market Report Highlights:
- By product, cranes and lifting equipment accounted for over 35.0% share of the global revenue in 2021 owing to its increased penetration across various end-use industries such as construction, manufacturing, and semiconductor and electronics
- The e-commerce application segment accounted for the largest revenue share of over 20.0% in 2021 owing to factors such as increased penetration of online shopping platforms, the existence of large online merchants, and rising logistics infrastructure
- The Asia Pacific region accounted for the largest revenue share of over 35.0% in 2021 owing to the growing food retail sector in Asia Pacific which increases the efficiency and speed of the picking and sorting processes
- Latin America is estimated to register a CAGR of 6.0% over the forecast period owing to the increasing investments in various end-use industries such as automotive, e-commerce, and food and beverages
- Manufacturers of material handling equipment adopt several strategies, including acquisitions, mergers, joint ventures, new product developments, and geographical expansions, to enhance their market penetration
Table of Contents
Chapter 1. Methodology and Scope
- 1.1. Research Methodology
- 1.2. Research Scope and Assumptions
- 1.3. Information Procurement
- 1.3.1. Purchased Database
- 1.3.2. GVR's Internal Database
- 1.3.3. Secondary Sources
- 1.3.4. Third-Party Perspectives
- 1.3.5. Primary Research
- 1.4. Information Analysis
- 1.4.1. Data Analysis Models
- 1.5. Market Formulation & Data Visualization
- 1.6. List to Data Sources
Chapter 2. Executive Summary
- 2.1. Market Outlook
- 2.2. Segmental Outlook
- 2.3. Competitive Insights
Chapter 3. Market Variables, Trends, and Scope
- 3.1. Market Segmentation & Scope
- 3.2. Penetration & Growth Prospect Mapping
- 3.3. Value Chain Analysis
- 3.4. Market Dynamics
- 3.4.1. Market Driver Analysis
- 3.4.2. Market Restraint Analysis
- 3.4.3. Market Opportunity Analysis
- 3.5. COVID-19 Impact Analysis
- 3.6. Business Environmental Tools Analysis
- 3.6.1. Porter's Five Forces Analysis
- 3.6.1.1. Bargaining Power of Suppliers
- 3.6.1.2. Bargaining Power of Buyers
- 3.6.1.3. Threat of Substitution
- 3.6.1.4. Threat of New Entrants
- 3.6.1.5. Competitive Rivalry
- 3.6.2. PESTLE Analysis
- 3.6.2.1. Political Landscape
- 3.6.2.2. Economic Landscape
- 3.6.2.3. Social Landscape
- 3.6.2.4. Technology Landscape
- 3.6.2.5. Environmental Landscape
- 3.6.2.6. Legal Landscape
- 3.6.1. Porter's Five Forces Analysis
Chapter 4. Material Handling Equipment Market: Product Estimates & Trend Analysis
- 4.1. Material Handling Equipment Market: Product Movement Analysis, 2021 & 2030
- 4.2. Cranes & Lifting Equipment
- 4.2.1. Market estimates and forecasts, 2017 - 2030 (USD Billion)
- 4.3. Industrial Trucks
- 4.3.1. Market estimates and forecasts, 2017 - 2030 (USD Billion)
- 4.4. Continuous Handling Equipment
- 4.4.1. Market estimates and forecasts, 2017 - 2030 (USD Billion)
- 4.5. Racking & Storage Equipment
- 4.5.1. Market estimates and forecasts, 2017 - 2030 (USD Billion)
Chapter 5. Material Handling Equipment Market: Application Estimates & Trend Analysis
- 5.1. Material Handling Equipment Market: Application Movement Analysis, 2021 & 2030
- 5.2. Automotive
- 5.2.1. Market estimates and forecasts, 2017 - 2030 (USD Billion)
- 5.3. Food & Beverages
- 5.3.1. Market estimates and forecasts, 2017 - 2030 (USD Billion)
- 5.4. Chemical
- 5.4.1. Market estimates and forecasts, 2017 - 2030 (USD Billion)
- 5.5. Semiconductor & Electronics
- 5.5.1. Market estimates and forecasts, 2017 - 2030 (USD Billion)
- 5.6. E-commerce
- 5.6.1. Market estimates and forecasts, 2017 - 2030 (USD Billion)
- 5.7. Aviation
- 5.7.1. Market estimates and forecasts, 2017 - 2030 (USD Billion)
- 5.8. Pharmaceuticals
- 5.8.1. Market estimates and forecasts, 2017 - 2030 (USD Billion)
- 5.9. Others
- 5.9.1. Market estimates and forecasts, 2017 - 2030 (USD Billion)
Chapter 6. Material Handling Equipment Market: Regional Estimates & Trend Analysis
- 6.1. Material Handling Equipment Equipment Regional Movement Analysis, 2021 & 2030
- 6.2. North America
- 6.2.1. Market estimates and forecasts, 2017 - 2030 (USD Billion)
- 6.2.2. Market estimates and forecasts, by product, 2017 - 2030 (USD Billion)
- 6.2.3. Market estimates and forecasts, by application, 2017 - 2030 (USD Billion)
- 6.2.4. U.S.
- 6.2.4.1. Market estimates and forecasts, 2017 - 2030 (USD Billion)
- 6.2.4.2. Market estimates and forecasts, by product, 2017 - 2030 (USD Billion)
- 6.2.4.3. Market estimates and forecasts, by application, 2017 - 2030 (USD Billion)
- 6.2.5. Canada
- 6.2.5.1. Market estimates and forecasts, 2017 - 2030 (USD Billion)
- 6.2.5.2. Market estimates and forecasts, by product, 2017 - 2030 (USD Billion)
- 6.2.5.3. Market estimates and forecasts, by application, 2017 - 2030 (USD Billion)
- 6.3. Europe
- 6.3.1. Market estimates and forecasts, 2017 - 2030 (USD Billion)
- 6.3.2. Market estimates and forecasts, by product, 2017 - 2030 (USD Billion)
- 6.3.3. Market estimates and forecasts, by application, 2017 - 2030 (USD Billion)
- 6.3.4. Germany
- 6.3.4.1. Market estimates and forecasts, 2017 - 2030 (USD Billion)
- 6.3.4.2. Market estimates and forecasts, by product, 2017 - 2030 (USD Billion)
- 6.3.4.3. Market estimates and forecasts, by application, 2017 - 2030 (USD Billion)
- 6.3.5. France
- 6.3.5.1. Market estimates and forecasts, 2017 - 2030 (USD Billion)
- 6.3.5.2. Market estimates and forecasts, by product, 2017 - 2030 (USD Billion)
- 6.3.5.3. Market estimates and forecasts, by application, 2017 - 2030 (USD Billion)
- 6.3.6. U.K.
- 6.3.6.1. Market estimates and forecasts, 2017 - 2030 (USD Billion)
- 6.3.6.2. Market estimates and forecasts, by product, 2017 - 2030 (USD Billion)
- 6.3.6.3. Market estimates and forecasts, by application, 2017 - 2030 (USD Billion)
- 6.3.7. Italy
- 6.3.7.1. Market estimates and forecasts, 2017 - 2030 (USD Billion)
- 6.3.7.2. Market estimates and forecasts, by product, 2017 - 2030 (USD Billion)
- 6.3.7.3. Market estimates and forecasts, by application, 2017 - 2030 (USD Billion)
- 6.3.8. Spain
- 6.3.8.1. Market estimates and forecasts, 2017 - 2030 (USD Billion)
- 6.3.8.2. Market estimates and forecasts, by product, 2017 - 2030 (USD Billion)
- 6.3.8.3. Market estimates and forecasts, by application, 2017 - 2030 (USD Billion)
- 6.4. Asia Pacific
- 6.4.1. Market estimates and forecasts, 2017 - 2030 (USD Billion)
- 6.4.2. Market estimates and forecasts, by product, 2017 - 2030 (USD Billion)
- 6.4.3. Market estimates and forecasts, by application, 2017 - 2030 (USD Billion)
- 6.4.4. China
- 6.4.4.1. Market estimates and forecasts, 2017 - 2030 (USD Billion)
- 6.4.4.2. Market estimates and forecasts, by product, 2017 - 2030 (USD Billion)
- 6.4.4.3. Market estimates and forecasts, by application, 2017 - 2030 (USD Billion)
- 6.4.5. India
- 6.4.5.1. Market estimates and forecasts, 2017 - 2030 (USD Billion)
- 6.4.5.2. Market estimates and forecasts, by product, 2017 - 2030 (USD Billion)
- 6.4.5.3. Market estimates and forecasts, by application, 2017 - 2030 (USD Billion)
- 6.4.6. Japan
- 6.4.6.1. Market estimates and forecasts, 2017 - 2030 (USD Billion)
- 6.4.6.2. Market estimates and forecasts, by product, 2017 - 2030 (USD Billion)
- 6.4.6.3. Market estimates and forecasts, by application, 2017 - 2030 (USD Billion)
- 6.4.7. South Korea
- 6.4.7.1. Market estimates and forecasts, 2017 - 2030 (USD Billion)
- 6.4.7.2. Market estimates and forecasts, by product, 2017 - 2030 (USD Billion)
- 6.4.7.3. Market estimates and forecasts, by application, 2017 - 2030 (USD Billion)
- 6.4.8. Australia
- 6.4.8.1. Market estimates and forecasts, 2017 - 2030 (USD Billion)
- 6.4.8.2. Market estimates and forecasts, by product, 2017 - 2030 (USD Billion)
- 6.4.8.3. Market estimates and forecasts, by application, 2017 - 2030 (USD Billion)
- 6.5. Latin America
- 6.5.1. Market estimates and forecasts, 2017 - 2030 (USD Billion)
- 6.5.2. Market estimates and forecasts, by product, 2017 - 2030 (USD Billion)
- 6.5.3. Market estimates and forecasts, by application, 2017 - 2030 (USD Billion)
- 6.5.4. Brazil
- 6.5.4.1. Market estimates and forecasts, 2017 - 2030 (USD Billion)
- 6.5.4.2. Market estimates and forecasts, by product, 2017 - 2030 (USD Billion)
- 6.5.4.3. Market estimates and forecasts, by application, 2017 - 2030 (USD Billion)
- 6.5.5. Mexico
- 6.5.5.1. Market estimates and forecasts, 2017 - 2030 (USD Billion)
- 6.5.5.2. Market estimates and forecasts, by product, 2017 - 2030 (USD Billion)
- 6.5.5.3. Market estimates and forecasts, by application, 2017 - 2030 (USD Billion)
- 6.5.6. Argentina
- 6.5.6.1. Market estimates and forecasts, 2017 - 2030 (USD Billion)
- 6.5.6.2. Market estimates and forecasts, by product, 2017 - 2030 (USD Billion)
- 6.5.6.3. Market estimates and forecasts, by application, 2017 - 2030 (USD Billion)
- 6.6. Middle East & Africa
- 6.6.1. Market estimates and forecasts, 2017 - 2030 (USD Billion)
- 6.6.2. Market estimates and forecasts, by product, 2017 - 2030 (USD Billion)
- 6.6.3. Market estimates and forecasts, by application, 2017 - 2030 (USD Billion)
- 6.6.4. South Africa
- 6.6.4.1. Market estimates and forecasts, 2017 - 2030 (USD Billion)
- 6.6.4.2. Market estimates and forecasts, by product, 2017 - 2030 (USD Billion)
- 6.6.4.3. Market estimates and forecasts, by application, 2017 - 2030 (USD Billion)
- 6.6.5. Saudi Arabia
- 6.6.5.1. Market estimates and forecasts, 2017 - 2030 (USD Billion)
- 6.6.5.2. Market estimates and forecasts, by product, 2017 - 2030 (USD Billion)
- 6.6.5.3. Market estimates and forecasts, by application, 2017 - 2030 (USD Billion)
Chapter 7. Competitive Landscape
- 7.1. Key Players, Recent Developments & Their Impact on the Industry
- 7.2. Key Company/Competition Categorization
- 7.3. Vendor Landscape
- 7.4. Competitive Dashboard Analysis
- 7.5. Public Companies
- 7.5.1. Company Market Position Analysis
- 7.6. Private Companies
- 7.6.1. List of Key Emerging Companies And Their Geographical Presence
Chapter 8. Company Profiles
- 8.1. BEUMER GROUP
- 8.1.1. Company overview
- 8.1.2. Financial performance
- 8.1.3. Product benchmarking
- 8.1.4. Strategic initiatives
- 8.2. Daifuku Co., Ltd.
- 8.2.1. Company overview
- 8.2.2. Financial performance
- 8.2.3. Product benchmarking
- 8.2.4. Strategic initiatives
- 8.3. Honeywell International, Inc.
- 8.3.1. Company overview
- 8.3.2. Financial performance
- 8.3.3. Product benchmarking
- 8.3.4. Strategic initiatives
- 8.4. KION GROUP AG
- 8.4.1. Company overview
- 8.4.2. Financial performance
- 8.4.3. Product benchmarking
- 8.4.4. Strategic initiatives
- 8.5. Mecalux, S.A.
- 8.5.1. Company overview
- 8.5.2. Financial performance
- 8.5.3. Product benchmarking
- 8.5.4. Strategic initiatives
- 8.6. Murata Manufacturing Co., Ltd.
- 8.6.1. Company overview
- 8.6.2. Financial performance
- 8.6.3. Product benchmarking
- 8.6.4. Strategic initiatives
- 8.7. SSI SCHAEFER
- 8.7.1. Company overview
- 8.7.2. Financial performance
- 8.7.3. Product benchmarking
- 8.7.4. Strategic initiatives
- 8.8. Swisslog Holding AG
- 8.8.1. Company overview
- 8.8.2. Financial performance
- 8.8.3. Product benchmarking
- 8.8.4. Strategic initiatives
- 8.9. TOYOTA INDUSTRIES CORPORATION
- 8.9.1. Company overview
- 8.9.2. Financial performance
- 8.9.3. Product benchmarking
- 8.9.4. Strategic initiatives
- 8.10. Vanderlande Industries B.V.
- 8.10.1. Company overview
- 8.10.2. Financial performance
- 8.10.3. Product benchmarking
- 8.10.4. Strategic initiatives