|
|
市場調査レポート
商品コード
1268762
ポリフェノール市場規模、シェア、動向分析レポート:製品別(ブドウ種子、緑茶、リンゴ、ココア)、用途別(飲食品、飼料)、地域別、セグメント予測、2023年~2030年Polyphenols Market Size, Share & Trends Analysis Report By Product (Grape Seed, Green Tea, Apple, Cocoa), By Application (Beverages, Food, Feed), By Region, And Segment Forecasts, 2023 - 2030 |
||||||
|
|
|||||||
|
● お客様のご希望に応じて、既存データの加工や未掲載情報(例:国別セグメント)の追加などの対応が可能です。 詳細はお問い合わせください。 |
|||||||


| ポリフェノール市場規模、シェア、動向分析レポート:製品別(ブドウ種子、緑茶、リンゴ、ココア)、用途別(飲食品、飼料)、地域別、セグメント予測、2023年~2030年 |
|
出版日: 2023年04月05日
発行: Grand View Research
ページ情報: 英文 125 Pages
納期: 2~10営業日
|
- 全表示
- 概要
- 図表
- 目次
ポリフェノール市場の成長と動向:
Grand View Research, Inc.の新しいレポートによると、世界のポリフェノール市場規模は、2023年から2030年にかけて7.4%のCAGRで拡大し、2030年には29億8,000万米ドルに達すると予想されています。
ポリフェノールは、抗酸化作用を持つ微量栄養素および植物化学物質です。これらの製品は、がん、糖尿病、神経変性疾患、老化、皮膚関連の問題を含む多くの疾患を治癒する可能性があるため、健康に有益です。
ブドウの種から抽出された製品は抗酸化作用があり、美容製品や栄養価の高い皮膚サプリメントで重要な役割を担っています。合成薬の代わりにハーブ製品を使用する意識の高まりと、アンチエイジング製品への需要の高まりが、製品の需要を押し上げると予想されます。臨床試験や前臨床試験では、グレープシードががんの治療において化学療法よりも効果的であることが示されています。グレープシードエキスは、飲食品、化粧品、ヘルスケア産業での消費の急増により、高い需要が見込まれます。
ブドウ種子抽出物は、基本的な栄養価に加え、機能性栄養素を豊富に含んでいます。健康に対する意識の高まりから、人々は健康的な食品を摂取するようになり、それが間接的に製品の需要を促進しています。
ポリフェノール市場レポートハイライト
- アジア太平洋地域がCAGR7.8%と最も速い成長率を示しています。この市場は、人口増加別経済開拓などの要因によって成長しています。
- 緑茶の摂取は、高コレステロール、がん、動脈硬化などの健康関連問題に有益です。
- 機能性飲料アプリケーションは、消費者に総合的な栄養と健康を提供するため、予測期間中にCAGRが7.5%近くと顕著な成長率を記録すると予想されます。
- ポリフェノール業界の主要企業は、ADM、Naturex SA、味の素、およびその他です。これらの企業は、バリューチェーン全体を通じて幅広い存在感を示し、市場を独占しています。
目次
第1章 調査手法と範囲
- 市場セグメンテーションと範囲
- 市場の定義
- 情報調達
- 購入したデータベース
- GVRの内部データベース
- 情報分析
- 市場形成とデータの可視化
- データの検証と公開
- 調査範囲と前提条件
- データソースのリスト
第2章 エグゼクティブサマリー
- 市場スナップショット
- セグメントスナップショット
- 競合情勢のスナップショット
第3章 ポリフェノール:市場変数、動向、範囲
- 市場系統の見通し
- 業界のバリューチェーン分析
- 規制の枠組み
- 市場力学
- 市場促進要因の分析
- 市場抑制要因分析
- 業界の課題分析
- 業界の機会分析
- 業界分析- ポーターの分析
- マクロ経済分析-PESTLE
第4章 ポリフェノール市場:サプライヤーのポートフォリオ分析
- ポートフォリオ分析/Kraljicマトリックス
- エンゲージメントモデル
- 交渉戦略
- 調達のベストプラクティス
- 原材料の動向
- 主要な原材料サプライヤーのリスト
第5章 ポリフェノール市場:製品の推定と傾向分析
- 製品変動分析と市場シェア
- グレープシード
- 緑茶
- リンゴ
- 桃
- 柑橘類
- オリーブ
- ベリー類
- ココアとコーヒー豆
- ポテト
- 藻類
- ザクロ
- その他
第6章 ポリフェノール市場:用途の推定と動向分析
- 用途の変動分析と市場シェア
- 機能性飲料
- 機能性食品
- 栄養補助食品
- 化粧品とトイレタリー
- 動物の飼料
- 染料
- 6 1.7その他のアプリケーション
第7章 ポリフェノール市場:地域推定・動向分析
- ポリフェノール市場:地域別展望、2022年および2030年
- 北米
- 米国
- カナダ
- 欧州
- ドイツ
- 英国
- フランス
- アジア太平洋地域
- 中国
- インド
- 中南米
- ブラジル
- 中東とアフリカ
- 南アフリカ
- サウジアラビア
第8章 ベースオイル市場- 競争分析
- 主要市場参入企業別最近の動向と影響分析
- 会社の分類
- 企業の市場シェア分析、2022年
- 戦略マッピング
- 会社一覧
- Berkem
- 参加者概要
- 財務実績
- 製品のベンチマーク
- Polyphenols As
- 参加者概要
- 財務実績
- 製品のベンチマーク
- Nutra Food Ingredients
- 参加者概要
- 財務実績
- 製品のベンチマーク
- Fengchen Group Co.
- 参加者概要
- 財務実績
- 製品のベンチマーク
- ADM
- 参加者概要
- 財務実績
- 製品のベンチマーク
- Naturex SA
- 参加者概要
- 財務実績
- 製品のベンチマーク
- Ajinomoto Co. Inc.
- 参加者概要
- 財務実績
- 製品のベンチマーク
- Indena SPA
- 参加者概要
- 財務実績
- 製品のベンチマーク
- Diana Naturals
- 参加者概要
- 財務実績
- 製品のベンチマーク
- Chr. Hansen Holding A/S
- 参加者概要
- 財務実績
- 製品のベンチマーク
- Barry Callebaut
- 参加者概要
- 財務実績
- 製品のベンチマーク
- Herza Schokolade Gmbh &Co.
- 参加者概要
- 財務実績
- 製品のベンチマーク
- Sabinsa
- 参加者概要
- 財務実績
- 製品のベンチマーク
- Kemin Industries Inc.
- 参加者概要
- 財務実績
- 製品のベンチマーク
- Berkem
List of Tables
- Table 1 U.S. macro-economic outlay
- Table 2 Canada macro-economic outlay
- Table 3 Mexico macro-economic outlay
- Table 4 Germany macro-economic outlay
- Table 5 U.K. macro-economic outlay
- Table 6 France macro-economic outlay
- Table 7 Italy macro-economic outlay
- Table 8 China macro-economic outlay
- Table 9 India macro-economic outlay
- Table 10 Japan macro-economic outlay
- Table 11 Brazil macro-economic outlay
- Table 12 Argentina macro-economic outlay
- Table 13 South Africa macro-economic outlay
- Table 14 Saudi Arabia macro-economic outlay
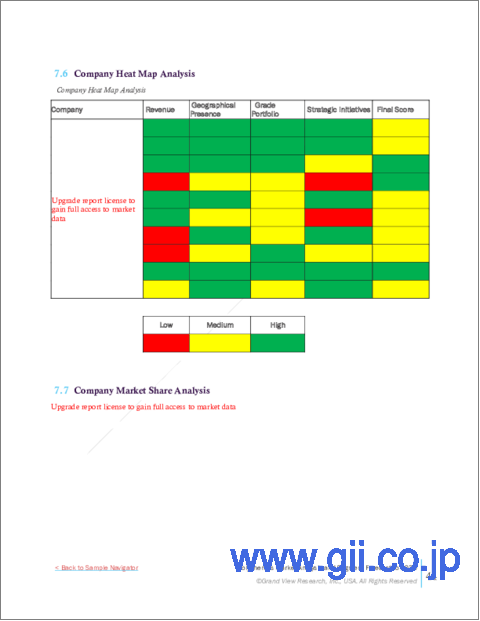
- Table 15 Company Heat Map Analysis
- Table 16 List of Potential End Users
- Table 17 Key Companies Undergoing Expansions
- Table 18 Key Companies Involved in Mergers & Acquisitions
- Table 19 Key Companies Launching New Products
List of Figures
- Fig. 1 Polyphenols Market Segmentation
- Fig. 2 Information procurement
- Fig. 3 Data analysis models
- Fig. 4 Market formulation and validation
- Fig. 5 Data validating & publishing
- Fig. 6 Polyphenols market outlook
- Fig. 7 Polyphenol Market Revenue, (USD Million), 2022
- Fig. 8 Polyphenol Market Revenue, (USD Thousand), 2022
- Fig. 9 Polyphenols Market Estimates & Forecasts, (2018-2030) (Kilotons) (USD Million)
- Fig. 10 Polyphenols Market: PORTER's Analysis
- Fig. 11 Polyphenols Market: PESTEL Analysis
- Fig. 12 Polyphenols Market Revenue Share, By Product, 2022 & 2030 (USD Million)
- Fig. 13 Polyphenols Market Revenue Share, By Application, 20222 & 2030 (USD Million)
- Fig. 14 Polyphenols Market Revenue Share, By Region, 2022 & 2030 (USD Million)
Polyphenols Market Growth & Trends:
The global polyphenols market size is expected to reach USD 2.98 billion by 2030, expanding at a CAGR of 7.4% from 2023 to 2030, according to a new report by Grand View Research, Inc. Polyphenols are micronutrients and phytochemicals with antioxidant properties. These products are beneficial for health as they have the potential to cure many diseases including cancer, diabetes, neurodegenerative condition, aging, and skin-related problems.
The product extracted from grape seed has antioxidant properties, which play a significant role in beauty products and nutritional skin supplements. Rising awareness of herbal products instead of synthetic drugs, coupled with increasing demand for anti-aging products, is expected to boost the demand for the product. Clinical and pre-clinical studies show that grape seed can be more effective than chemotherapy for the treatment of cancer. The grape seed extract is anticipated to experience high demand on account of surging consumption in the food and beverages, cosmetics, and healthcare industries.
They are enriched with functional nutrients to the basic nutritional values. With the increase in the awareness of good health, people are consuming healthy food which is indirectly driving demand for the product.
Polyphenols Market Report Highlights:
- The Asia Pacific region witnessed the fastest growth rate with a CAGR of nearly 7.8%. The market is growing due to factors such as strong economic development coupled with population expansion
- Consumption of green tea can be beneficial for health-related issues such as high cholesterol, cancer, and atherosclerosis
- The functional beverage application segment is expected to register a notable growth rate with a CAGR of nearly 7.5% during the forecast period, as they provide overall nutrition and well-being to consumers
- The key players in the polyphenols industry include ADM; Naturex SA; Ajinomoto; and Others. These companies dominate the market with their extensive presence throughout the value chain
Table of Contents
Chapter 1 Methodology and Scope
- 1.1 Market Segmentation & Scope
- 1.2 Market Definition
- 1.3 Information Procurement
- 1.3.1 Purchased Database
- 1.3.2 GVR's Internal Database
- 1.4 Information analysis
- 1.5 Market formulation & data visualization
- 1.6 Data validation & publishing
- 1.6.1 Research scope and assumptions
- 1.6.2 List of Data Sources
Chapter 2 Executive Summary
- 2.1 Market Snapshot
- 2.2 Segmental Snapshot
- 2.3 Competitive Landscape Snapshot
Chapter 3 Polyphenols: Market Variables, Trends & Scope
- 3.1 Market Lineage Outlook
- 3.2 Industry Value Chain Analysis
- 3.3 Price Trend Analysis, 2018 - 2030
- 3.4 Regulatory Framework
- 3.5 Market Dynamics
- 3.5.1 Market Driver Analysis
- 3.5.2 Market Restraint Analysis
- 3.5.3 Industry Challenges Analysis
- 3.5.4 Industry opportunities analysis
- 3.6 Industry Analysis - Porter's Analysis
- 3.7 Macroeconomic Analysis - PESTLE
Chapter 4 Polyphenols Market: Supplier Portfolio Analysis
- 4.1 Portfolio Analysis/Kraljic Matrix
- 4.2 Engagement Model
- 4.3 Negotiation Strategies
- 4.4 Best Sourcing Practices
- 4.5 Raw Material Trends
- 4.6 List of Key Raw Material Suppliers
Chapter 5 Polyphenols Market: Product Estimated &Trend Analysis
- 5.1 Product Movement Analysis & Market Share
- 5.1 1 Grape Seed
- 5.1.2 Green Tea
- 5.1.3 Apple
- 5.1.4 Peach
- 5.1.5 Citrus
- 5 1.6 Olive
- 5.1.7 Berries
- 5.1.8 Cocoa & Coffee Beans
- 5.1.9 Potatoes
- 5.1.10 Algae
- 5.1.11 Pomegranate
- 5.1.12 Others
Chapter 6 Polyphenols Market: Application Estimates &Trend Analysis
- 6.1 Application Movement Analysis & Market Share
- 6.1.1 Functional Beverages
- 6.1.2 Functional Foods
- 6.1.3 Dietary Supplements
- 6.1.4 Cosmetics & Toiletries
- 6.1.5 Animal Feed
- 6.1.6 Dyes
- 6 1.7 Other Applications
Chapter 7 Polyphenols Market: Regional Estimates & Trend Analysis
- 7.1 Polyphenols Market: Regional Outlook, 2022 & 2030
- 7.2. North America
- 7.2.1 U.S.
- 7.2.1.1 Key country dynamics
- 7.2.1.2 U.S. Polyphenols Market Estimates & Forecasts, 2018 - 2030 (Kilotons) (USD Million)
- 7.2.2 Canada
- 7.2.2.1 Key country dynamics
- 7.2.2.2 Canada Polyphenols Market Estimates & Forecasts, 2018 - 2030 (Kilotons) (USD Million)
- 7.2.1 U.S.
- 7.3 Europe
- 7.3.1 Europe Polyphenols Market Estimates & Forecasts, 2018 - 2030 (Kilotons) (USD Million)
- 7.3.2 Germany
- 7.3.2.1 Key country dynamics
- 7.3.2.2 Germany Polyphenols Market Estimates & Forecasts, 2018 - 2030 (Kilotons) (USD Million)
- 7.3.3 U.K.
- 7.3.3.1 Key country dynamics
- 7.3.3.2 U.K. Polyphenols Market Estimates & Forecasts, 2018 - 2030 (Kilotons) (USD Million)
- 7.3.4 France
- 7.3.4.1 Key country dynamics
- 7.3.4.2 France Polyphenols Market Estimates & Forecasts, 2018 - 2030 (Kilotons) (USD Million)
- 7.4 Asia Pacific
- 7.4.1 Asia Pacific Polyphenols Market Estimates & Forecasts, 2018 - 2030 (Kilotons) (USD Million)
- 7.4.2 China
- 7.4.2.1. Key country dynamics
- 7.4.2.2 China Polyphenols Market Estimates & Forecasts, 2018 - 2030 (Kilotons) (USD Million)
- 7.4.3 India
- 7.4.3.1 Key country dynamics
- 7.4.3.2 India Polyphenols Market Estimates & Forecasts, 2018 - 2030 (Kilotons) (USD Million)
- 7 4.4 Japan
- 7.4.4.1 Key country dynamics
- 7.4.4.2 Japan Polyphenols Market Estimates & Forecasts, 2018 - 2030 (Kilotons) (USD Million)
- 7.5 Central & South America
- 7.5.1 Central & South America Polyphenols Market Estimates & Forecasts, 2018 - 2030 (Kilotons) (USD Million)
- 7.5.2 Brazil
- 7.5.2.1 Key country dynamics
- 7.5.2.2 Brazil Polyphenols Market Estimates & Forecasts, 2018 - 2030 (Kilotons) (USD Million)
- 7.6 Middle East & Africa
- 7.6.1 Middle East & Africa Polyphenols Market Estimates & Forecasts, 2018 - 2030 (Kilotons) (USD Million)
- 7.6.2 South Africa
- 7.6.2.1 Key country dynamics
- 7.6.2.2 South Africa Polyphenols Market Estimates & Forecasts, 2018 - 2030 (Kilotons) (USD Million)
- 7.6.3 Saudi Arabia
- 7.6.3.1 Key country dynamics
- 7.6.3.2 Saudi Arabia Polyphenols Market Estimates & Forecasts, 2018 - 2030 (Kilotons) (USD Million)
Chapter 8 Base Oil Market - Competitive Analysis
- 8.1 Recent Developments & Impact Analysis, By Key Market Participants
- 8.2 Company Categorization
- 8.3 Company Market Share Analysis, 2022
- 8.4 Strategy Mapping
- 8.5 Company Listing
- 8.5.1 Berkem
- 8.5.1.1 Participants Overview
- 8.5.1.2 Financial Performance
- 8.5.1.3 Product Benchmarking
- 8.5.2 Polyphenols As
- 8.5.2.1 Participants Overview
- 8.5.2.2 Financial Performance
- 8.5.2.3 Product Benchmarking
- 8.5.3 Nutra Food Ingredients
- 8.5.3.1 Participants Overview
- 8.5.3.2 Financial Performance
- 8.5.3.3 Product Benchmarking
- 8.5.4 Fengchen Group Co.
- 8.5.4.1 Participants Overview
- 8.5.4.2 Financial Performance
- 8.5.4.3 Product Benchmarking
- 8.5.5 ADM
- 8.5.5.1 Participants Overview
- 8.5.5.2 Financial Performance
- 8.5.5.3 Product Benchmarking
- 8.5.6 Naturex SA
- 8.5.6.1 Participants Overview
- 8.5.6.2 Financial Performance
- 8.5.6.3 Product Benchmarking
- 8.5.7 Ajinomoto Co. Inc.
- 8.5.7.1 Participants Overview
- 8.5.7.2 Financial Performance
- 8.5.7.3 Product Benchmarking
- 8.5.8 Indena S.P.A
- 8.5.8.1 Participants Overview
- 8.5.8.2 Financial Performance
- 8.5.8.3 Product Benchmarking
- 8.5.9 Diana Naturals
- 8.5.9.1 Participants Overview
- 8.5.9.2 Financial Performance
- 8.5.9.3 Product Benchmarking
- 8.5.10 Chr. Hansen Holding A/S
- 8.5.10.1 Participants Overview
- 8.5.10.2 Financial Performance
- 8.5.10.3 Product Benchmarking
- 8.5.11 Barry Callebaut
- 8.5.11.1 Participants Overview
- 8.5.11.2 Financial Performance
- 8.5.11.3 Product Benchmarking
- 8.5.12 Herza Schokolade Gmbh & Co.
- 8.5.12.1 Participants Overview
- 8.5.12.2 Financial Performance
- 8.5.12.3 Product Benchmarking
- 8.5.13 Sabinsa
- 8.5.13.1 Participants Overview
- 8.5.13.2 Financial Performance
- 8.5.13.3 Product Benchmarking
- 8.5.14 Kemin Industries Inc.
- 8.5.14.1 Participants Overview
- 8.5.14.2 Financial Performance
- 8.5.14.3 Product Benchmarking
- 8.5.1 Berkem