|
|
市場調査レポート
商品コード
1147477
ベアリングの市場規模、シェア、動向分析レポート製品別、用途別(自動車、農業、電気、鉱山・建設、鉄道・航空宇宙、自動車アフターマーケット)、地域別、セグメント別予測2022年~2030年Bearing Market Size, Share & Trends Analysis Report By Product, By Application (Automotive, Agriculture, Electrical, Mining & Construction, Railway & Aerospace, Automotive Aftermarket), By Region, And Segment Forecasts 2022 - 2030 |
||||||
|
|
|||||||
|
● お客様のご希望に応じて、既存データの加工や未掲載情報(例:国別セグメント)の追加などの対応が可能です。 詳細はお問い合わせください。 |
|||||||


| ベアリングの市場規模、シェア、動向分析レポート製品別、用途別(自動車、農業、電気、鉱山・建設、鉄道・航空宇宙、自動車アフターマーケット)、地域別、セグメント別予測2022年~2030年 |
|
出版日: 2022年10月06日
発行: Grand View Research
ページ情報: 英文 80 Pages
納期: 2~10営業日
|
- 全表示
- 概要
- 図表
- 目次
ベアリング市場の成長と動向
ベアリングの世界市場は、2030年までに2,276億9,000万米ドルに達し、予測期間中に9.1%のCAGRと予測。ベアリングは、動作を伴うほぼすべての用途に不可欠であり、いくつかの産業用機械や装置のさまざまな機械コンポーネント間の摩擦を最小限に抑え、エネルギー消費を削減するのに役立ちます。したがって、この機械要素は、機械や関連するモーター駆動のリンクを使用して、自動車、家電製品、航空宇宙から産業機械に至るまで、あらゆる産業に応用されています。
市場は、エネルギー効率の達成を目的として、今後数年間で大幅な成長を遂げると推定されています。省エネとベアリングは密接な関係にあります。この要素の主な目的は、トランスミッションのシャフトや車両の車輪の回転時の摩擦を低減してエネルギーを節約することです。さらに、商用車の需要の高まりにより、世界中の自動車分野からの需要が一気に高まることが予想されます。
スマートベアリング、先端材料や潤滑油の開発、センサーユニットの統合などの技術的進歩は、市場に高い成長の可能性をもたらすと予想されます。性能の向上を目的に、ベンダーは製品にセンサーユニットを搭載しています。センサーユニットは、回転速度、軸方向の動き、負荷容量の加速度、減速度のデジタル監視に役立ちます。現在、これらのユニットは、コンベア、フォークリフト、ロードローラー、電気モーターなどに使用されています。さらに、IoT機能を統合することで、メーカーは常にオペレーションを監視することが容易になります。
市場は成熟しており、エンジニアリング産業や資本財の状況に密接に関連したダイナミックな需要があります。企業は、組み立てられた製品に入るベアリングの数を大幅に減らし、設備の総コストを削減する統合製品を提供しています。これは、製品の寿命と信頼性を高めることにもつながります。製品メーカーは、革新的な製品を提供することで激化する競争に対応するため、研究開発への投資を増やしています。
ベアリング市場のレポートハイライト
費用対効果の高い風力発電製品の開発により、エネルギー生産量の増加、潤滑油の消費量の削減、タービンの性能と信頼性の向上に役立つ風力タービンアプリケーションでの利用が増加しています。
ローラーベアリングは、予測期間中に9.5%という最も早いCAGRで成長すると予想されています。ローラーベアリングは、速度よりも高い負荷容量を必要とするアプリケーションに最適です。ローラーベアリングは、設備機械、航空宇宙、製造、発電など様々な産業において高負荷の設定で使用されています。インフラ整備への積極的な投資が重荷重機器・機械の需要を牽引しており、ころ軸受の需要拡大には良い兆しがあります。
鉄道・航空宇宙用途は、ショックアブソーバー、ギアボックス、ドア、傾斜機構などの用途で需要が伸びており、予測期間中に10.0%を超える最も早いCAGRを示すと予想されます。さらに、ベアリングの異なるタイプは、一般的に機関車、トラクションモータ、ワゴンホイール、貨物輸送車、サスペンションで使用されています。航空機、宇宙船、スペースシャトル、人工衛星の需要の増加に伴い、民間航空宇宙産業が発展していることが、予測期間中のベアリング市場の成長を促進すると期待されています。
アジア太平洋地域は、産業および建設部門の急速な拡大により、10.1%の最速CAGRを記録すると予想されています。さらに、自動車生産台数の増加、産業機器やオートバイの修理のための強力なアフターマーケット需要も、この地域の成長に好影響を与えています。
さまざまな大手企業が、革新的なソリューションを生み出すために高度な研究開発に投資しています。これらのソリューションは、最終製品の全体的な品質を高めるだけでなく、費用対効果に優れていることに重点を置いています。市場の主要なプレーヤーは、Brammer PLC、HKT Bearings Ltd., Harbin Bearing Manufacturing Co., Ltd., NBI Bearings Europe, NSK Global, JTEKT Corporation, NTN Corporation, Rexnord Corporation, RHP Bearings, Schaeffler Group, RBC Bearings Inc., SKF Corporation、およびThe Timken Companyが含まれています。
目次
第1章 調査手法と範囲
- 市場セグメンテーション
- 調査範囲と前提
- 調査手法
- ボトムアップアプローチ
- トップダウンアプローチ
- 調査の仮定
- データソースのリスト
第2章 エグゼクティブサマリー
- 市場概要
- ベアリング市場- 市場展望
- ベアリング市場- セグメント別展望
第3章 市場変数、動向、範囲
- 浸透と成長の見通しのマッピング
- 軸受市場のバリューチェーン
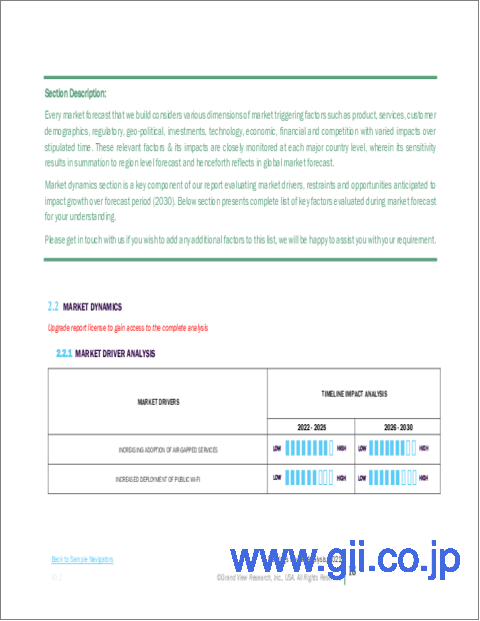
- 市場力学
- 市場促進要因分析
- 風力タービンでの高容量軸受の適用の増加
- エネルギー効率の高い自動車の軸受需要の増加
- 鉄道、航空宇宙、その他のアプリケーションでの需要の増加
- EVの販売台数が急増
- 市場課題・制約分析
- 模倣品
- 原材料価格の上昇
- 市場機会分析
- 医療用途向けのベアリングへの電気機械機能の統合
- 市場促進要因分析
- ベアリングマーケット-ポーターズファイブフォース
- ベアリング市場-PEST
- 電気自動車業界における軸受の技術動向
- ベアリングの設計とサイズの革新
- ベアリングへの高機能材料の使用
- ベアリング付きセンサーの採用
- 潤滑剤の選択
- スマートベアリングの採用
- COVID-19がベアリング市場に与える影響
第4章 ベアリング市場:製品の推定・動向分析
- ボールベアリング
- 深溝ベアリング
- その他
- ローラーベアリング
- スプリット
- テーパード
- その他
- すべり軸受
- ジャーナルすべり軸受
- リニアプレーンベアリング
- スラストプレーンベアリング
- その他
- その他
第5章 ベアリング市場:アプリケーションの推定・動向分析
- 自動車
- 農業
- 電気
- 鉱業と建設
- 鉄道と航空宇宙
- 自動車およびアフターマーケット
第6章 ベアリング市場:地域推定・動向分析
- 地域別ベアリング市場シェア、2021年および2030年
- 北米
- 米国
- カナダ
- 欧州
- 西欧
- 英国
- ドイツ
- フランス
- イタリア
- 東欧
- ロシア
- 西欧
- アジア太平洋地域
- 中国
- インド
- 日本
- ラテンアメリカ
- ブラジル
- メキシコ
- 中東およびアフリカ(MEA)
第7章 競合情勢
- Brammer PLC
- 会社概要
- 製品のベンチマーク
- HARBIN BEARING MANUFACTURING CO., LTD.
- 会社概要
- 製品のベンチマーク
- HKT BEARINGS LIMITED
- 会社概要
- 製品のベンチマーク
- NBI Bearings Europe, SA
- 会社概要
- 製品のベンチマーク
- JTEKT CORPORATION
- 会社概要
- 財務実績
- 製品のベンチマーク
- 戦略的イニシアチブ
- NSK Ltd.
- 会社概要
- 財務実績
- 製品のベンチマーク
- 戦略的イニシアチブ
- NTN Bearing Corporation
- 会社概要
- 財務実績
- 製品のベンチマーク
- 戦略的イニシアチブ
- RBC BEARINGS INC
- 会社概要
- 財務実績
- 製品のベンチマーク
- 戦略的イニシアチブ
- Zurn Water Solutions Corporation
- 会社概要
- 製品のベンチマーク
- 最近の開発
- 戦略的イニシアチブ
- Schaeffler AG
- 会社概要
- 財務実績
- 製品のベンチマーク
- 戦略的イニシアチブ
- SKF
- 会社概要
- 財務実績
- 製品のベンチマーク
- 戦略的イニシアチブ
- The Timken Company
- 会社概要
- 製品のベンチマーク
- 戦略的イニシアチブ
List of Tables
- Table 1 Global bearings market, 2017 - 2030 (USD Billion)
- Table 2 Global bearings market by region, 2017 - 2030 (USD Billion)
- Table 3 Global bearings market by product, 2017 - 2030 (USD Billion)
- Table 4 Global roller bearings market by product, 2017 - 2030 (USD Billion)
- Table 5 Global ball bearings market by product, 2017 - 2030 (USD Billion)
- Table 6 Global plain bearings market by product, 2017 - 2030 (USD Billion)
- Table 7 Global bearings market by applications, 2017 - 2030 (USD Billion)
- Table 8 Global ball bearings market by product, 2017 - 2030 (USD Billion)
- Table 9 Ball bearings market by region, 2017 - 2030 (USD Billion)
- Table 10 Global ball bearings market, 2017 - 2030 (USD Billion)
- Table 11 Deep groove bearings market by region, 2017 - 2030 (USD Billion)
- Table 12 Other ball bearings market by region, 2017 - 2030 (USD Billion)
- Table 13 Roller bearings market by region, 2017 - 2030 (USD Billion)
- Table 14 Global roller bearings market, 2017 - 2030 (USD Billion)
- Table 15 Split Roller bearings market by region, 2017 - 2030 (USD Billion)
- Table 16 Tapered Roller bearings market by region, 2017 - 2030 (USD Billion)
- Table 17 Other Roller bearings market by region, 2017 - 2030 (USD Billion)
- Table 18 Plain bearings market by region, 2017 - 2030 (USD Billion)
- Table 19 Global plain bearings market, 2017 - 2030 (USD Billion)
- Table 20 Journal Plain bearings market by region, 2017 - 2030 (USD Billion)
- Table 21 Linear Plain bearings market by region, 2017 - 2030 (USD Billion)
- Table 22 Thrust Plain bearings market by region, 2017 - 2030 (USD Billion)
- Table 23 Other Plain bearings market by region, 2017 - 2030 (USD Billion)
- Table 24 Global bearings market by application, 2017 - 2030 (USD Billion)
- Table 26 Automotive bearings market by region, 2017 - 2030 (USD Billion)
- Table 28 Agriculture bearings market by region, 2017 - 2030 (USD Billion)
- Table 30 Electrical bearings market by region, 2017 - 2030 (USD Billion)
- Table 32 Mining & Construction bearings market by region, 2017 - 2030 (USD Billion)
- Table 34 Railway & Aerospace bearings market by region, 2017 - 2030 (USD Billion)
- Table 35 Automotive aftermarket bearings market by region, 2017 - 2030 (USD Billion)
- Table 36 North America bearings market by country, 2017 - 2030 (USD Billion)
- Table 37 North America bearings market by product, 2017 - 2030 (USD Billion)
- Table 38 North America roller bearings market by product, 2017 - 2030 (USD Billion)
- Table 39 North America ball bearings market by product, 2017 - 2030 (USD Billion)
- Table 40 North America plain bearings market by product, 2017 - 2030 (USD Billion)
- Table 41 North America bearings market by application, 2017 - 2030 (USD Billion)
- Table 47 U.S bearings market by product, 2017 - 2030 (USD Billion)
- Table 48 U.S. roller bearings market by product, 2017 - 2030 (USD Billion)
- Table 49 U.S. ball bearings market by product, 2017 - 2030 (USD Billion)
- Table 50 U.S. plain bearings market by product, 2017 - 2030 (USD Billion)
- Table 51 U.S bearings market by application, 2017 - 2030 (USD Billion)
- Table 52 Canada bearings market by product, 2017 - 2030 (USD Billion)
- Table 53 Canada roller bearings market by product, 2017 - 2030 (USD Billion)
- Table 54 Canada ball bearings market by product, 2017 - 2030 (USD Billion)
- Table 55 Canada plain bearings market by product, 2017 - 2030 (USD Billion)
- Table 56 Canada bearings market by application, 2017 - 2030 (USD Billion)
- Table 57 Europe bearings market by region, 2017 - 2030 (USD Billion)
- Table 58 Europe bearings market by product, 2017 - 2030 (USD Billion)
- Table 59 Europe roller bearings market by product, 2017 - 2030 (USD Billion)
- Table 60 Europe ball bearings market by product, 2017 - 2030 (USD Billion)
- Table 61 Europe plain bearings market by product, 2017 - 2030 (USD Billion)
- Table 62 Europe bearings market by application, 2017 - 2030 (USD Billion)
- Table 68 Western Europe bearings market by country, 2017 - 2030 (USD Billion)
- Table 69 Western Europe bearings market by product, 2017 - 2030 (USD Billion)
- Table 70 Western Europe roller bearings market by product, 2017 - 2030 (USD Billion)
- Table 71 Western Europe ball bearings market by product, 2017 - 2030 (USD Billion)
- Table 72 Western Europe plain bearings market by product, 2017 - 2030 (USD Billion)
- Table 73 Western Europe bearings market by application, 2017 - 2030 (USD Billion)
- Table 74 U.K. bearings market by product, 2017 - 2030 (USD Billion)
- Table 75 U.K. roller bearings market by product, 2017 - 2030 (USD Billion)
- Table 76 U.K. ball bearings market by product, 2017 - 2030 (USD Billion)
- Table 77 U.K. plain bearings market by product, 2017 - 2030 (USD Billion)
- Table 78 U.K. bearings market by application, 2017 - 2030 (USD Billion)
- Table 79 Germany bearings market by product, 2017 - 2030 (USD Billion)
- Table 80 Germany roller bearings market by product, 2017 - 2030 (USD Billion)
- Table 81 Germany ball bearings market by product, 2017 - 2030 (USD Billion)
- Table 82 Germany plain bearings market by product, 2017 - 2030 (USD Billion)
- Table 83 Germany bearings market by application, 2017 - 2030 (USD Billion)
- Table 84 France roller bearings market by product, 2017 - 2030 (USD Billion)
- Table 85 France ball bearings market by product, 2017 - 2030 (USD Billion)
- Table 86 France plain bearings market by product, 2017 - 2030 (USD Billion)
- Table 87 France bearings market by application, 2017 - 2030 (USD Billion)
- Table 88 Italy roller bearings market by product, 2017 - 2030 (USD Billion)
- Table 89 Italy ball bearings market by product, 2017 - 2030 (USD Billion)
- Table 90 Italy plain bearings market by product, 2017 - 2030 (USD Billion)
- Table 91 Italy bearings market by application, 2017 - 2030 (USD Billion)
- Table 92 Eastern Europe bearings market by country, 2017 - 2030 (USD Billion)
- Table 93 Eastern Europe bearings market by product, 2017 - 2030 (USD Billion)
- Table 94 Eastern Europe roller bearings market by product, 2017 - 2030 (USD Billion)
- Table 95 Eastern Europe ball bearings market by product, 2017 - 2030 (USD Billion)
- Table 96 Eastern Europe plain bearings market by product, 2017 - 2030 (USD Billion)
- Table 97 Eastern Europe bearings market by application, 2017 - 2030 (USD Billion)
- Table 98 Russia roller bearings market by product, 2017 - 2030 (USD Billion)
- Table 99 Russia ball bearings market by product, 2017 - 2030 (USD Billion)
- Table 100 Russia plain bearings market by product, 2017 - 2030 (USD Billion)
- Table 101 Russia bearings market by application, 2017 - 2030 (USD Billion)
- Table 102 Asia Pacific bearings market by country, 2017 - 2030 (USD Billion)
- Table 103 Asia Pacific bearings market by product, 2017 - 2030 (USD Billion)
- Table 104 Asia Pacific roller bearings market by product, 2017 - 2030 (USD Billion)
- Table 105 Asia Pacific ball bearings market by product, 2017 - 2030 (USD Billion)
- Table 106 Asia Pacific plain bearings market by product, 2017 - 2030 (USD Billion)
- Table 107 Asia Pacific bearings market by application, 2017 - 2030 (USD Billion)
- Table 108 China bearings market by product, 2017 - 2030 (USD Billion)
- Table 109 China roller bearings market by product, 2017 - 2030 (USD Billion)
- Table 110 China ball bearings market by product, 2017 - 2030 (USD Billion)
- Table 111 China plain bearings market by product, 2017 - 2030 (USD Billion)
- Table 112 China bearings market by application, 2017 - 2030 (USD Billion)
- Table 113 Japan bearings market by product, 2017 - 2030 (USD Billion)
- Table 114 Japan roller bearings market by product, 2017 - 2030 (USD Billion)
- Table 115 Japan ball bearings market by product, 2017 - 2030 (USD Billion)
- Table 116 Japan plain bearings market by product, 2017 - 2030 (USD Billion)
- Table 117 Japan bearings market by application, 2017 - 2030 (USD Billion)
- Table 118 India bearings market by product, 2017 - 2030 (USD Billion)
- Table 119 India roller bearings market by product, 2017 - 2030 (USD Billion)
- Table 120 India ball bearings market by product, 2017 - 2030 (USD Billion)
- Table 121 India plain bearings market by product, 2017 - 2030 (USD Billion)
- Table 122 India bearings market by application, 2017 - 2030 (USD Billion)
- Table 123 Latin America bearings market by country, 2017 - 2030 (USD Billion)
- Table 124 Latin America bearings market by product, 2017 - 2030 (USD Billion)
- Table 125 Latin America roller bearings market by product, 2017 - 2030 (USD Billion)
- Table 126 Latin America ball bearings market by product, 2017 - 2030 (USD Billion)
- Table 127 Latin America plain bearings market by product, 2017 - 2030 (USD Billion)
- Table 128 Latin America bearings market by application, 2017 - 2030 (USD Billion)
- Table 129 Brazil bearings market by product, 2017 - 2030 (USD Billion)
- Table 130 Brazil roller bearings market by product, 2017 - 2030 (USD Billion)
- Table 131 Brazil ball bearings market by product, 2017 - 2030 (USD Billion)
- Table 132 Brazil plain bearings market by product, 2017 - 2030 (USD Billion)
- Table 133 Brazil bearings market by application, 2017 - 2030 (USD Billion)
- Table 134 Mexico bearings market by product, 2017 - 2030 (USD Billion)
- Table 135 Mexico roller bearings market by product, 2017 - 2030 (USD Billion)
- Table 136 Mexico ball bearings market by product, 2017 - 2030 (USD Billion)
- Table 137 Mexico plain bearings market by product, 2017 - 2030 (USD Billion)
- Table 138 Mexico bearings market by application, 2017 - 2030 (USD Billion)
- Table 139 Middle East & Africa bearings market by product, 2017 - 2030 (USD Billion)
- Table 140 Middle East & Africa roller bearings market by product, 2017 - 2030 (USD Billion)
- Table 141 Middle East & Africa ball bearings market by product, 2017 - 2030 (USD Billion)
- Table 142 Middle East & Africa ball bearings market by product, 2017 - 2030 (USD Billion)
- Table 143 Middle East & Africa bearings market by application, 2017 - 2030 (USD Billion)
- Table 144 Company categorization
List of Figures
- Fig. 1 Bearings Market Segmentation
- Fig. 2 Bearings Market Regional Scope
- Fig. 3 Bearings - Industry snapshot & key buying criteria, 2017 - 2030
- Fig. 4 Bearings Market Outlook 2017 - 2030 (Revenue in USD Billion)
- Fig. 5 Bearings Market - Segmental Outlook 2017 - 2030 (Revenue in USD Billion)
- Fig. 6 Bearings Market Size and Growth Prospects
- Fig. 7 Bearings Market - Value Chain Analysis
- Fig. 8 Bearings Market - Key Market Driver Impact
- Fig. 9 Global Electric Vehicle Sales, 2015 - 2021
- Fig. 10 Bearings Market - Key Market Challenge/Restraint Impact
- Fig. 11 Steel price forecast to 2019 (USD)
- Fig. 12 Bearings Market - Key Market Opportunity Impact
- Fig. 13 Bearings Market - Porter's Five Forces
- Fig. 14 Bearings Market - PEST
- Fig. 15 Bearings Market, By Product Analysis, 2021 & 2030 (USD Billion)
- Fig. 16 Bearings Market Share - By Product, 2021 & 2030
- Fig. 17 Bearings Market, By Application Analysis, 2021 & 2030 (USD Billion)
- Fig. 18 Bearings Market - Application Share Analysis, 2021 & 2030
- Fig. 19 Bearings Market - Regional Market Outlook
- Fig. 20 Bearings Market, By Regional Analysis, 2021 & 2030 (USD Billion)
- Fig. 21 Bearings Market - Regional Share Analysis, 2021 & 2030
- Fig. 22 North America Bearings Market - Key Takeaways
- Fig. 23 Europe Bearings Market - Key Takeaways
- Fig. 24 Asia Pacific Bearings Market - Key Takeaways
- Fig. 25 Latin America Bearings Market - Key Takeaways
- Fig. 26 Middle East & Africa Bearings Market - Key Takeaways
- Fig. 27 Key company market share analysis, 2021
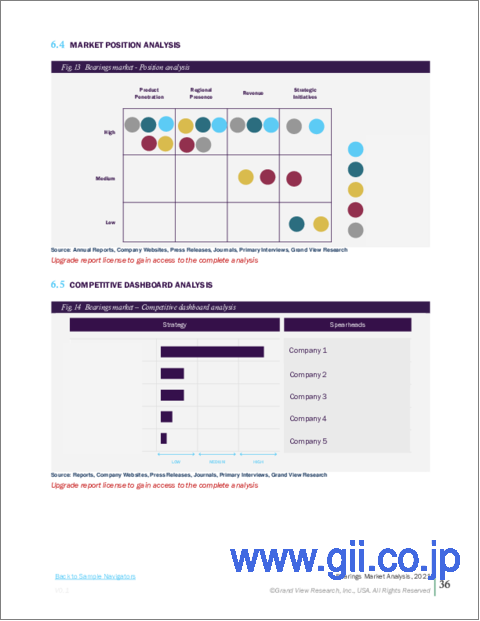
- Fig. 28 Bearings market - Position analysis
- Fig. 29 Bearings market - Competitive dashboard analysis
Bearings Market Growth & Trends:
The global bearings market is anticipated to reach USD 227.69 billion by 2030, registering a CAGR of 9.1% over the forecast period. Bearings are essential in almost every application that involves motion, and they help minimize friction between different mechanical components in several industrial machinery and equipment, resulting in reduced energy consumption. Hence, this machine element finds application in all industries, ranging from automobiles, household appliances, and aerospace to industrial machinery, using machinery or related motor-driven linkages.
The market is estimated to witness considerable growth in the forthcoming years, ascribed to the aim to achieve energy efficiency. Energy-saving and bearings go hand-in-hand. The main objective of this element is saving energy by reducing friction, be it during the rotation of shafts of a transmission or the wheel of a vehicle. Additionally, the rising demand for commercial vehicles is expected to catapult the demand from the automotive sector across the world.
Technological advancements including smart bearings, the development of advanced materials and lubricants, and integrating sensor units, are anticipated to provide high growth potential to the market. With the objective of enhancing performance, vendors are incorporating sensor units of the product. Sensor units help with digital monitoring of rotation speed, axial movement, load-carrying capacity acceleration, and deceleration. These units are presently being used in conveyors forklifts, road rollers, and electric motors. Furthermore, the integration of IoT capabilities facilitates manufacturers to monitor operations constantly.
The market is mature with a dynamic demand closely related to the state of engineering industries and capital goods. Companies are offering integrated products that significantly decrease the number of bearings that go into an assembled product and reduce the overall cost of equipment. This in turn is also increasing the shelf-life and reliability of the product. Product manufacturers are increasingly investing in R&D to address the intensifying competition by providing innovative products.
Bearings Market Report Highlights:
- The development of cost-effective wind energy-generating products has resulted in their increased espousal within wind turbine applications that aid in increasing energy production, reduce lubricant consumption, and enhancing turbine performance and reliability.
- The roller bearings segment is anticipated to grow at the fastest CAGR registering 9.5% during the forecast period. Roller bearings are ideal for applications requiring higher load-carrying capacity than speed. They are used in heavy-load settings across various industries, including equipment and machinery, aerospace, manufacturing, and power generation. The aggressive investments in infrastructure developments, which drive the demand for heavy-duty equipment and machinery, bode well for the growing demand for roller bearings.
- Railway and Aerospace application is estimated to witness the fastest CAGR of over 10.0% during the forecast period to their growing demand in applications such as shock absorbers, gearboxes, doors, and tilting mechanisms. Further, different types of bearings are commonly used in locomotives, traction motors, wagon wheels, freight carriers, and suspension. The development of the commercial aerospace industry, in line with the growing demand for aircraft, space vehicles, space shuttles, and satellites, is expected to drive the growth of the bearing market over the forecast period.
- The Asia Pacific is anticipated to witness the fastest CAGR of 10.1% owing to the rapid expansion of the industrial and construction sector. Further, growing motor vehicle production coupled with the region's strong aftermarket demand for industrial equipment and motorcycle repairs augurs well for the growth in the region.
- Various leading companies are investing in high-level R&D to come up with innovative solutions. These solutions are focused on being cost-effective as well as on enhancing the overall quality of the end-product. Key players in the market include Brammer PLC, HKT Bearings Ltd., Harbin Bearing Manufacturing Co., Ltd., NBI Bearings Europe, NSK Global, JTEKT Corporation, NTN Corporation, Rexnord Corporation, RHP Bearings, Schaeffler Group, RBC Bearings Inc., SKF Corporation, and The Timken Company.
Table of Contents
Chapter 1. Methodology and Scope
- 1.1. Market Segmentation
- 1.2. Report Scope and Assumptions
- 1.3. Research Methodology
- 1.3.1. Bottom-Up Approach
- 1.3.2. Top-Down Approach
- 1.4. Research Assumptions
- 1.5. List of Data Sources
Chapter 2. Executive Summary
- 2.1. Market Summary
- 2.2. Bearings- Industry Snapshot & Key Buying Criteria, 2017 - 2030
- 2.3. Bearings Market - Market Outlook
- 2.4. Bearings Market - Segmental Outlook
- 2.5. Global Bearings Market, 2017 - 2030
Chapter 3. Market Variables, Trends & Scope
- 3.1. Penetration and Growth Prospect Mapping
- 3.2. Bearings Market Value Chain
- 3.3. Market Dynamics
- 3.3.1. Market driver analysis
- 3.3.1.1. Increased application of high capacity bearings in wind turbines
- 3.3.1.2. Increasing demand for bearings in energy-efficient vehicles
- 3.3.1.3. Growing demand in railway, aerospace and other applications
- 3.3.1.4. Rapidly Increasing EV Sales
- 3.3.2. Market challenges/restraint analysis
- 3.3.2.1. Counterfeit products
- 3.3.2.2. Increasing raw material prices
- 3.3.3. Market opportunity analysis
- 3.3.3.1. Integration of electro-mechanical features into bearings for medical applications
- 3.3.1. Market driver analysis
- 3.4. Bearings Market- Porter's Five Forces
- 3.5. Bearings Market- PEST
- 3.6. Technology Trends of Bearings in Electric Vehicles Industry
- 3.6.1. Innovations In Bearing Design and Sizes
- 3.6.2. Usage Of High-Performance Materials In Bearings
- 3.6.3. Adoption Of Sensors with Bearings
- 3.6.4. Selection Of Lubricants
- 3.6.5. Adoption Of Smart Bearing
- 3.7. Impact of COVID-19 on the Bearings Market
Chapter 4. Bearings Market: Product Estimates & Trend Analysis
- 4.1. Bearings Market: Product Share Analysis, 2017 - 2030
- 4.1.1. Ball Bearings
- 4.1.1.1. Deep Groove Bearings
- 4.1.1.2. Others
- 4.1.2. Roller Bearings
- 4.1.2.1. Split
- 4.1.2.2. Tapered
- 4.1.2.3. Others
- 4.1.3. Plain Bearings
- 4.1.3.1. Journal Plain Bearings
- 4.1.3.2. Linear Plain Bearings
- 4.1.3.3. Thrust Plain Bearings
- 4.1.3.4. Others
- 4.1.4. Others
- 4.1.1. Ball Bearings
Chapter 5. Bearings Market: Application Estimates & Trend Analysis
- 5.1. Bearings Market: Application Share Analysis, 2017 - 2030
- 5.1.1. Automotive
- 5.1.2. Agriculture
- 5.1.3. Electrical
- 5.1.4. Mining and Construction
- 5.1.5. Railway & Aerospace
- 5.1.6. Automotive & Aftermarket
Chapter 6. Bearings Market: Regional Estimates & Trend Analysis
- 6.1. Bearings Market Share By Region, 2021 & 2030
- 6.2. North America
- 6.2.1. Bearings market by product, 2017 - 2030 (USD Billion)
- 6.2.2. Bearings market by application, 2017 - 2030 (USD Billion)
- 6.2.3. U.S.
- 6.2.3.1. Bearings market by product, 2017 - 2030 (USD Billion)
- 6.2.3.2. Bearings market by application 2017 - 2030 (USD Billion)
- 6.2.4. Canada
- 6.2.4.1. Bearings market by product, 2017 - 2030 (USD Billion)
- 6.2.4.2. Bearings market by application 2017 - 2030 (USD Billion)
- 6.3. Europe
- 6.3.1. Bearings market by product, 2017 - 2030 (USD Billion)
- 6.3.2. Bearings market by application, 2017 - 2030 (USD Billion)
- 6.3.3. Western Europe
- 6.3.3.1. Bearings market by product, 2017 - 2030 (USD Billion)
- 6.3.3.2. Bearings market by application 2017 - 2030 (USD Billion)
- 6.3.3.3. U.K.
- 6.3.3.3.1. Bearings market by product, 2017 - 2030 (USD Billion)
- 6.3.3.3.2. Bearings market by application 2017 - 2030 (USD Billion)
- 6.3.3.4. Germany
- 6.3.3.4.1. Bearings market by product, 2017 - 2030 (USD Billion)
- 6.3.3.4.2. Bearings market by application 2017 - 2030 (USD Billion)
- 6.3.3.5. France
- 6.3.3.5.1. Bearings market by product, 2017 - 2030 (USD Billion)
- 6.3.3.5.2. Bearings market by application 2017 - 2030 (USD Billion)
- 6.3.3.6. Italy
- 6.3.3.6.1. Bearings market by product, 2017 - 2030 (USD Billion)
- 6.3.3.6.2. Bearings market by application 2017 - 2030 (USD Billion)
- 6.3.4. Eastern Europe
- 6.3.4.1. Bearings market by product, 2017 - 2030 (USD Billion)
- 6.3.4.2. Bearings market by application 2017 - 2030 (USD Billion)
- 6.3.4.3. Russia
- 6.3.4.3.1. Bearings market by product, 2017 - 2030 (USD Billion)
- 6.3.4.3.2. Bearings market by application 2017 - 2030 (USD Billion)
- 6.4. Asia Pacific
- 6.4.1. Bearings market by product, 2017 - 2030 (USD Billion)
- 6.4.2. Bearings market by application, 2017 - 2030 (USD Billion)
- 6.4.3. China
- 6.4.3.1. Bearings market by product, 2017 - 2030 (USD Billion)
- 6.4.3.2. Bearings market by application 2017 - 2030 (USD Billion)
- 6.4.4. India
- 6.4.4.1. Bearings market by product, 2017 - 2030 (USD Billion)
- 6.4.4.2. Bearings market by application 2017 - 2030 (USD Billion)
- 6.4.5. Japan
- 6.4.5.1. Bearings market by product, 2017 - 2030 (USD Billion)
- 6.4.5.2. Bearings market by application 2017 - 2030 (USD Billion)
- 6.5. Latin America
- 6.5.1. Bearings market by product, 2017 - 2030 (USD Billion)
- 6.5.2. Bearings market by application, 2017 - 2030 (USD Billion)
- 6.5.3. Brazil
- 6.5.3.1. Bearings market by product, 2017 - 2030 (USD Billion)
- 6.5.3.2. Bearings market by application 2017 - 2030 (USD Billion)
- 6.5.4. Mexico
- 6.5.4.1. Bearings market by product, 2017 - 2030 (USD Billion)
- 6.5.4.2. Bearings market by application 2017 - 2030 (USD Billion)
- 6.6. Middle East and Africa (MEA)
- 6.6.1. Bearings market by product, 2017 - 2030 (USD Billion)
- 6.6.2. Bearings market by application, 2017 - 2030 (USD Billion)
Chapter 7. Competitive Landscape
- 7.1. Brammer PLC
- 7.1.1. Company Overview
- 7.1.2. Product Benchmarking
- 7.2. HARBIN BEARING MANUFACTURING CO., LTD.
- 7.2.1. Company Overview
- 7.2.2. Product Benchmarking
- 7.3. HKT BEARINGS LIMITED
- 7.3.1. Company Overview
- 7.3.2. Product Benchmarking
- 7.4. NBI Bearings Europe, S.A.
- 7.4.1. Company Overview
- 7.4.2. Product Benchmarking
- 7.5. JTEKT CORPORATION
- 7.5.1. Company Overview
- 7.5.2. Financial performance
- 7.5.3. Product Benchmarking
- 7.5.4. Strategic Initiatives
- 7.6. NSK Ltd.
- 7.6.1. Company Overview
- 7.6.2. Financial performance
- 7.6.3. Product Benchmarking
- 7.6.4. Strategic Initiatives
- 7.7. NTN Bearing Corporation
- 7.7.1. Company Overview
- 7.7.2. Financial performance
- 7.7.3. Product Benchmarking
- 7.7.4. Strategic Initiatives
- 7.8. RBC BEARINGS INC
- 7.8.1. Company Overview
- 7.8.2. Financial performance
- 7.8.3. Product Benchmarking
- 7.8.4. Strategic Initiatives
- 7.9. Zurn Water Solutions Corporation
- 7.9.1. Company Overview
- 7.9.2. Product Benchmarking
- 7.9.3. Recent developments
- 7.9.4. Strategic Initiatives
- 7.10. Schaeffler AG
- 7.10.1. Company Overview
- 7.10.2. Financial performance
- 7.10.3. Product Benchmarking
- 7.10.4. Strategic Initiatives
- 7.11. SKF
- 7.11.1. Company Overview
- 7.11.2. Financial performance
- 7.11.3. Product Benchmarking
- 7.11.4. Strategic Initiatives
- 7.12. The Timken Company
- 7.12.1. Company Overview
- 7.12.2. Product Benchmarking
- 7.12.3. Strategic Initiatives