|
|
市場調査レポート
商品コード
1224634
国内観光の世界市場規模、シェア、動向分析レポート:ツアータイプ別(アドベンチャー、スピリチュアル/カルチャー、スポーツ、週末旅行)、観光タイプ別、予約モード別、地域別、セグメント別予測、2023年~2030年Domestic Tourism Market Size, Share & Trends Analysis Report By Tour Type (Adventure, Spiritual/Cultural, Sports, Weekend Getaways), By Tourism Type, By Mode Of Booking, By Region, And Segment Forecasts, 2023 - 2030 |
||||||
|
|
|||||||
|
● お客様のご希望に応じて、既存データの加工や未掲載情報(例:国別セグメント)の追加などの対応が可能です。 詳細はお問い合わせください。 |
|||||||


| 国内観光の世界市場規模、シェア、動向分析レポート:ツアータイプ別(アドベンチャー、スピリチュアル/カルチャー、スポーツ、週末旅行)、観光タイプ別、予約モード別、地域別、セグメント別予測、2023年~2030年 |
|
出版日: 2023年01月20日
発行: Grand View Research
ページ情報: 英文 80 Pages
納期: 2~10営業日
|
- 全表示
- 概要
- 図表
- 目次
国内観光市場の成長と動向
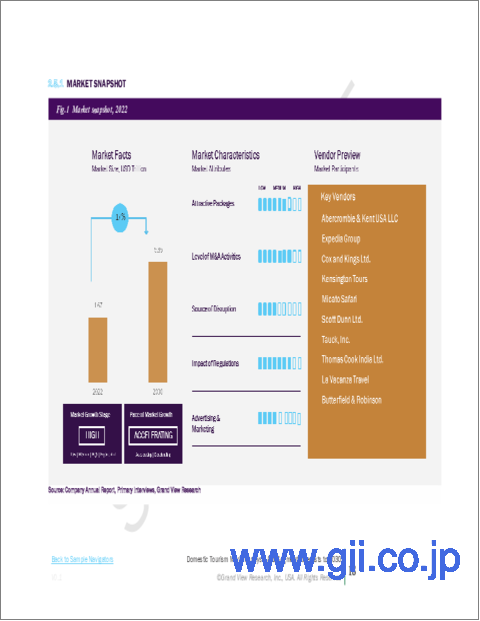
株式会社グランドビューリサーチの最新レポートによると、世界の国内観光市場規模は2030年に5兆8,582億7,000万米ドルに達すると予測されています。同市場は2023年から2030年にかけてCAGR17.0%で拡大すると予測されています。可処分所得の増加、あらゆる年齢層の旅行志向の高まり、新たな観光地や観光テーマの出現により、市場はさらに拡大すると予想されます。また、世界の傾向として、出張よりもレジャーにお金をかける国が多く、これが市場の成長を後押ししています。
国内外の旅行者は、自然、遺産・文化、宗教、冒険、健康、MICE、ウェディングなど、伝統的な観光テーマと新しい観光テーマの両方に惹かれています。今後の業界発展は、実質的な内需と経済成長、価格競争力のあるサービス、インフラ整備、新しい旅行先の紹介、特化したツアーパッケージなどが原動力となると思われます。
国内観光市場においては、冒険型観光分野が優位を占めており、予測期間中、最大の市場シェアを占めると予想されます。アドベンチャーツーリズムの取り組みは、新たな商業的可能性への扉を開くものです。多くの企業が、アドベンチャー・ツーリズムの新規事業者のマーケティング支援に注力しています。新しいアドベンチャーツーリズムの活動は、それとともに新鮮な市場の可能性をもたらします。
欧州は、人々の増加のアカウントに住宅部門の継続的な拡張のために、2022年に最大の市場シェアを占めました。インターネットを利用した経済、文化やコミュニケーションの世界化の動向、より多くの人々が旅行にアクセスしやすくなっていることに起因しています。また、欧州は海外旅行者の最大の「発地」となっています。
2020年のCOVID-19によって、観光ビジネスは大きな影響を受けました。ホリデーシーズンには、国内旅行の計画にはまだ影響がないもの、多くのオペレーターから往路旅行のキャンセルが急増したとの報告がありました。このように、観光は欧州のアイデンティティを育み、大陸の文化や自然の遺産、そして地域や潜在的な持続可能な開発への意識を高めているのです。
国内観光市場のレポートハイライト
国内観光は2022年に1兆6,703億2,000万米ドルとなり、予測期間中に17.0%のCAGRを記録すると予想されています。国内観光は、政府が地域の貧困に対処し、雇用と経済成長を創出し、インフラをアップグレードし、過剰人口による負担を軽減するために使用するツールです。このような戦略の例としては、裁量的な価格設定政策や賃金以外の観光給付の提供などがあります。
アドベンチャー分野は、2022年に5,518億米ドル、2030年には1兆8,462億米ドルに達すると予想されています。アドベンチャー・ツーリズムを含む旅行は、身体的運動、アウトドアへの露出、文化的没入の3要素のうち少なくとも2つで構成されます。冒険旅行には、リスクとある程度のスキルが伴うことが多いとされています。
州内旅行分野は、2022年から2030年までのCAGRが17.5%となり、予測期間中に大幅な成長が見込まれます。主要な大都市と第二級または第三級都市を結ぶ非レジャー路線は、親族や恋人と休暇を過ごした後の帰省や帰省で、引き続き多くの需要を示しています。州を跨ぐ旅客は、旅行者の少ない地域に誘致されると見られます。
オンライン部門は、2022年から2030年までのCAGRが18.1%となり、予測期間中に大幅な成長が見込まれます。オンラインによるオペレーションは、ツアー・旅行業界における最近の動向です。オンラインモードは、ツアーオペレーターが顧客へのリーチを拡大するのに役立ちます。オンライン操作は、ツアーオペレーターが顧客に割引を提供することができるため、コスト削減につながります。
欧州地域は、2022年に6,509億1,000万米ドルと評価され、2030年には2兆2,472億米ドルに達すると予想されています。欧州連合(EU)は、欧州を代表する観光地としての地位を維持し、観光産業が成長と雇用に最大限貢献できるよう、観光の振興を目指しています。
目次
第1章 調査手法と範囲
- 市場セグメンテーションと範囲
- 市場の定義
- 情報調達
- 購入したデータベース
- GVRの内部データベース
- 二次情報と第三者の視点
- 1次調査
- 情報分析
- データ分析モデル
- 市場形成とデータ可視化
- データの検証と公開
第2章 エグゼクティブサマリー
- 市場の見通し
- ツアータイプ展望
- 観光型展望
- 予約方法展望
- 地域の見通し
第3章 国内観光市場の変数、動向、範囲
- 市場イントロダクション
- 浸透と成長の見通しのマッピング
- COVID-19の国内観光市場への影響
- 業界バリューチェーン分析
- 販売・小売チャネル分析
- 市場力学
- 市場促進要因分析
- 市場抑制要因分析
- 業界の課題
- 業界の機会
- 事業環境分析
- 業界分析- ポーターズ
- サプライヤーの力
- 買い手の交渉力
- 代替の脅威
- 新規参入者からの脅威
- 競争企業間の敵対関係
- 業界分析- ポーターズ
- 国内観光市場のロードマップ
- 市場参入戦略
第4章 消費者行動分析
- 人口統計分析
- 消費者の動向と好み
- 購入決定に影響を与える要因
- コンシューマツアー型採用
- 所見と推奨事項
第5章 国内観光市場:ツアータイプの推定・動向分析
- ツアータイプの変動分析と市場シェア、2022年と2030年
- 冒険
- スピリチュアル/文化
- スポーツ
- 週末旅行
- その他(ビジネス、企画ツアー)
第6章 国内観光市場:観光タイプの推定・動向分析
- 観光タイプの変動分析と市場シェア、2022年と2030年
- 地方旅行
- 州間旅行
第7章 国内観光市場:予約予測モードと推定・動向分析
- 予約変動分析と市場シェアのモード、2022年と2030年
- オンライン
- オフライン
第8章 国内観光市場:地域推定・動向分析
- 地域変動分析と市場シェア、2022年と2030年
- 北米
- 米国
- カナダ
- 欧州
- 英国
- ドイツ
- フランス
- アジア太平洋地域
- 中国
- インド
- 日本
- 中南米
- ブラジル
- 中東およびアフリカ
- 南アフリカ
第9章 競合分析
- 主要な世界プレーヤー、最近の動向、業界への影響
- 主要企業/競合の分類(主要なイノベーター、市場リーダー、新興企業)
- ベンダー情勢
- 主要企業の市場シェア分析、2022年
第10章 企業プロファイル
- Abercrombie &Kent USA LLC
- 会社概要
- 財務実績
- ツアータイプのベンチマーク
- 戦略的イニシアチブ
- Expedia Group
- 会社概要
- 財務実績
- ツアータイプのベンチマーク
- 戦略的イニシアチブ
- Cox and Kings Ltd
- 会社概要
- 財務実績
- ツアータイプのベンチマーク
- 戦略的イニシアチブ
- Kensington Tours
- 会社概要
- 財務実績
- ツアータイプのベンチマーク
- 戦略的イニシアチブ
- Micato Safari
- 会社概要
- 財務実績
- ツアータイプのベンチマーク
- 戦略的イニシアチブ
- Scott Dunn Ltd.
- 会社概要
- 財務実績
- ツアータイプのベンチマーク
- 戦略的イニシアチブ
- Tauck, Inc
- 会社概要
- 財務実績
- ツアータイプのベンチマーク
- 戦略的イニシアチブ
- Thomas Cook India Ltd
- 会社概要
- 財務実績
- ツアータイプのベンチマーク
- 戦略的イニシアチブ
- La Vacanza Travel
- 会社概要
- 財務実績
- ツアータイプのベンチマーク
- 戦略的イニシアチブ
- Butterfield &Robinson
- 会社概要
- 財務実績
- ツアータイプのベンチマーク
- 戦略的イニシアチブ
List of Tables
- 1. Domestic Tourism market - Driving factor market analysis
- 2. Domestic Tourism market - Restraint factor market analysis
- 3. Domestic Tourism market estimates and forecast for adventure, 2017 - 2030 (USD Billion)
- 4. Domestic Tourism market estimates and forecast for spiritual/cultural, 2017 - 2030 (USD Billion)
- 5. Domestic Tourism market estimates and forecast for sports, 2017 - 2030 (USD Billion)
- 6. Domestic Tourism market estimates and forecast for weekend getaways, 2017 - 2030 (USD Billion)
- 7. Domestic Tourism market estimates and forecast for others, 2017 - 2030 (USD Billion)
- 8. Domestic Tourism market estimates and forecast, by local travel, 2017 - 2030 (USD Billion)
- 9. Domestic Tourism market estimates and forecast, by interstate travel, 2017 - 2030 (USD Billion)
- 10. Domestic Tourism market estimates and forecast, through online, 2017 - 2030 (USD Billion)
- 11. Domestic Tourism market estimates and forecast, through offline, 2017 - 2030 (USD Billion)
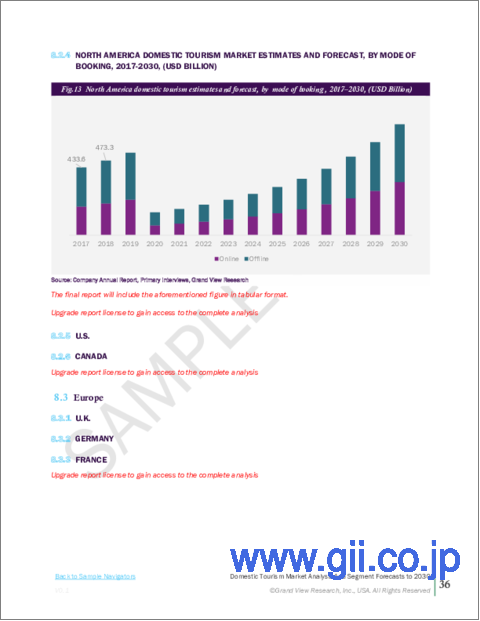
- 12. North America domestic tourism market estimates and forecast, 2017 - 2030 (USD Billion)
- 13. North America domestic tourism market estimates and forecast, by tour type, 2017 - 2030 (USD Billion)
- 14. North America domestic tourism market estimates and forecast, by tourism type, 2017 - 2030 (USD Billion)
- 15. North America domestic tourism market estimates and forecast, by mode of booking, 2017 - 2030 (USD Billion)
- 16. U.S. domestic tourism market estimates and forecast, 2017 - 2030 (USD Billion)
- 17. U.S. domestic tourism market estimates and forecast, by tour type, 2017 - 2030 (USD Billion)
- 18. U.S. domestic tourism market estimates and forecast, by tourism type, 2017 - 2030 (USD Billion)
- 19. U.S. domestic tourism market estimates and forecast, by Mode of Booking, 2017 - 2030 (USD Billion)
- 20. Canada domestic tourism market estimates and forecast, 2017 - 2030 (USD Billion)
- 21. Canada domestic tourism market estimates and forecast, by tour type, 2017 - 2030 (USD Billion)
- 22. Canada domestic tourism market estimates and forecast, by tourism type, 2017 - 2030 (USD Billion)
- 23. Canada domestic tourism market estimates and forecast, by mode of booking, 2017 - 2030 (USD Billion)
- 24. Europe Domestic tourism market estimates and forecast, 2017-2030 (USD Billion)
- 25. Europe domestic tourism market estimates and forecast, by tour type, 2017-2030 (USD Billion)
- 26. Europe domestic tourism market estimates and forecast, by tourism type, 2017-2030 (USD Billion)
- 27. Europe domestic tourism market estimates and forecast, by mode of booking, 2017-2030 (USD Billion)
- 28. U.K. domestic tourism market estimates and forecast, 2017-2030 (USD Billion)
- 29. U.K. domestic tourism market estimates and forecast, by tour type, 2017-2030 (USD Billion)
- 30. U.K. domestic tourism market estimates and forecast, by tourism type, 2017-2030 (USD Billion)
- 31. U.K. domestic tourism market estimates and forecast, by mode of booking, 2017-2030 (USD Billion)
- 32. Germany domestic tourism market estimates and forecast, 2017-2030 (USD Billion)
- 33. Germany domestic tourism market estimates and forecast, by tour type, 2017 - 2030 (USD Billion)
- 34. Germany domestic tourism market estimates and forecast, by tourism type, 2017 - 2030 (USD Billion)
- 35. Germany domestic tourism market estimates and forecast, by mode of booking, 2017 - 2030 (USD Billion)
- 36. France domestic tourism market estimates and forecast, 2017-2030 (USD Billion)
- 37. France domestic tourism market estimates and forecast, by tour type, 2017 - 2030 (USD Billion)
- 38. France domestic tourism market estimates and forecast, by tourism type, 2017 - 2030 (USD Billion)
- 39. France domestic tourism market estimates and forecast, by mode of booking, 2017 - 2030 (USD Billion)
- 40. Asia Pacific domestic tourism market estimates and forecast, 2017 - 2030 (USD Billion)
- 41. Asia Pacific domestic tourism market estimates and forecast, by tour type, 2017 - 2030 (USD Billion)
- 42. Asia Pacific domestic tourism market estimates and forecast, by tourism type, 2017 - 2030 (USD Billion)
- 43. Asia Pacific domestic tourism market estimates and forecast, by mode of booking, 2017 - 2030 (USD Billion)
- 44. China domestic tourism market estimates and forecast, 2017 - 2030 (USD Billion)
- 45. China domestic tourism market estimates and forecast, by tour type, 2017 - 2030 (USD Billion)
- 46. China domestic tourism market estimates and forecast, by tourism type, 2017 - 2030 (USD Billion)
- 47. China domestic tourism market estimates and forecast, by mode of booking, 2017 - 2030 (USD Billion)
- 48. India domestic tourism market estimates and forecast, 2017 - 2030 (USD Billion)
- 49. India domestic tourism market estimates and forecast, by tour type, 2017 - 2030 (USD Billion)
- 50. India domestic tourism market estimates and forecast, by tourism type, 2017 - 2030 (USD Billion)
- 51. India domestic tourism market estimates and forecast, by Mode of Booking, 2017 - 2030 (USD Billion)
- 52. Japan domestic tourism market estimates and forecast, 2017 - 2030 (USD Billion)
- 53. Japan domestic tourism market estimates and forecast, by tour type, 2017 - 2030 (USD Billion)
- 54. Japan domestic tourism market estimates and forecast, by tourism type, 2017 - 2030 (USD Billion)
- 55. Japan domestic tourism market estimates and forecast, by mode of booking, 2017 - 2030 (USD Billion)
- 56. South America domestic tourism market estimates and forecast, 2017 - 2030 (USD Billion)
- 57. South America domestic tourism market estimates and forecast, by tour type, 2017 - 2030 (USD Billion)
- 58. South America domestic tourism market estimates and forecast, by tourism type, 2017 - 2030 (USD Billion)
- 59. South America domestic tourism market estimates and forecast, by mode of booking, 2017 - 2030 (USD Billion)
- 60. Brazil domestic tourism market estimates and forecast, 2017 - 2030 (USD Billion)
- 61. Brazil domestic tourism market estimates and forecast, by tour type, 2017 - 2030 (USD Billion)
- 62. Brazil domestic tourism market estimates and forecast, by tourism type, 2017 - 2030 (USD Billion)
- 63. Brazil domestic tourism market estimates and forecast, by mode of booking, 2017 - 2030 (USD Billion)
- 64. Middle East & Africa domestic tourism market estimates and forecast, 2017 - 2030 (USD Billion)
- 65. Middle East & Africa domestic tourism market estimates and forecast, by tour type, 2017 - 2030 (USD Billion)
- 66. Middle East & Africa domestic tourism market estimates and forecast, by tourism type, 2017 - 2030 (USD Billion)
- 67. Middle East & Africa domestic tourism market estimates and forecast, by mode of booking, 2017 - 2030 (USD Billion)
- 68. South Africa domestic tourism market estimates and forecast, 2017 - 2030 (USD Billion)
- 69. South Africa domestic tourism market estimates and forecast, by tour type, 2017 - 2030 (USD Billion)
- 70. South Africa domestic tourism market estimates and forecast, by tourism type, 2017 - 2030 (USD Billion)
- 71. South Africa domestic tourism market estimates and forecast, by mode of booking, 2017 - 2030 (USD Billion)
- 72. Company categorization
List of Figures
- 1. Domestic Tourism market segmentation
- 2. Information procurement
- 3. Primary research pattern
- 4. Primary research approaches
- 5. Primary research process
- 6. Domestic Tourism market - Tour Type growth
- 7. Domestic Tourism market- Value chain analysis
- 8. Domestic Tourism market - Retail chain analysis
- 9. Domestic Tourism market - Profit margin analysis
- 10. COVID-19 shifted spending to the home
- 11. Domestic Tourism market: Porter's Five Forces Analysis
- 12. Roadmap of domestic tourism market
- 13. Factors affecting consumer buying decision in the domestic tourism market
- 14. Domestic Tourism market: Tour Type share (%) analysis, 2022 & 2030
- 15. Domestic Tourism market: Tourism Type share (%) analysis, 2022 & 2030
- 16. Domestic Tourism market: Mode of Booking share (%) analysis, 2022 & 2030
- 17. Domestic Tourism market: Regional share (%) analysis, 2022 & 2030
- 18. Domestic Tourism market: Estimated company market share analysis, 2022
Domestic Tourism Market Growth & Trends:
The global domestic tourism market size is expected to reach USD 5,858.27 billion by 2030, according to a new report by Grand View Research, Inc. The market is expected to expand at a CAGR of 17.0% from 2023 to 2030. The market is anticipated to expand further as disposable income rises, travel preferences among all age groups increase, and new tourist sites and touristic themes emerge. Many nations adopt the worldwide trend of spending more on leisure travel than on business travel, which is aiding the market thrive.
Domestic and international travelers have been drawn to both traditional and new tourism themes, such as nature, heritage and culture, religion, adventure, health and wellness, MICE, and weddings, among others. Future industry development will be fueled by substantial domestic demand and economic growth, price-competitive services, infrastructural development, the introduction of new travel destinations, and specialized tour packages.
The adventure-based tourism segment of the domestic tourism market is dominating, and it is anticipated that it would hold the largest market share during the forecasted period. Adventure tourism initiatives open doors to new commercial possibilities. Numerous businesses focus on assisting new adventure tourism entrepreneurs in marketing their goods. Every new adventure tourism activity brings with it a fresh market potential.
Europe held the largest market share in 2022, owing to the continuous expansion of the residential sector on account of the increasing number of people. Owing to the internet-based economies, trends toward globalization in culture and communication, and the growing accessibility of travel for ever-larger segments of the population. Additionally, Europe has emerged as the greatest "source region" for tourists that travel abroad.
The tourism business was severely impacted by COVID-19 in 2020. During the holiday season, many operators reported an upsurge in cancellations for outward travel, although domestic travel plans have not yet been impacted. In this way, tourism fosters a sense of European identity and raises awareness of the continent's cultural and natural legacy, as well as regional and potentially sustainable development.
Domestic Tourism Market Report Highlights:
- Domestic Tourism was valued at USD 1,670.32 billion in 2022 and is expected to register a CAGR of 17.0% over the forecast period. Domestic tourism is a tool that governments use to address local poverty, create jobs and economic growth, upgrade infrastructure, and relieve the strain of overpopulation. Instances of such strategies include discretionary pricing policies and the provision of non-wage tourism benefits
- Adventure segment was valued a USD 551.8 billion in 2022 and is expected to reach USD 1,846.2 Billion by 2030. A trip that involves adventure tourism comprises at least two of the three elements of physical exercise, exposure to the outdoors, and cultural immersion. Risk and some skill from the visitor are frequently involved
- Interstate travel segment is expected to witness substantial growth over the forecast period with a CAGR of 17.5% from 2022 to 2030. The non-leisure routes connecting major metro cities to II or III-tier locations continue to show more demand as people return to or after celebrating holidays with their relatives or loved ones. Interstate passengers are seen to be lured to less travelled areas
- Online segment is expected to witness substantial growth over the forecast period with a CAGR of 18.1% from 2022 to 2030. Online mode of operations is the recent trend in tour and travel industry. Online mode helps tour operators to increase their reach to the customers; online operation leads to cost reduction because of which tour operators can provide the discount to their customers
- Europe region was valued a USD 650.91 billion in 2022 and is expected to reach USD 2,247.2 billion by 2030. The European Union (EU) aims to promote tourism in order to maintain the region's position as a leading destination, and maximize the industry's contribution to growth and employment
Table of Contents
Chapter 1. Methodology and Scope
- 1.1. Market Segmentation & Scope
- 1.2. Market Definition
- 1.3. Information Procurement
- 1.3.1. Purchased Database
- 1.3.2. GVR's Internal Database
- 1.3.3. Secondary Sources & Third-Party Perspectives
- 1.3.4. Primary Research
- 1.4. Information Analysis
- 1.4.1. Data Analysis Models
- 1.5. Market Formulation & Data Visualization
- 1.6. Data Validation & Publishing
Chapter 2. Executive Summary
- 2.1. Market Outlook
- 2.2. Tour type Outlook
- 2.3. Tourism type Outlook
- 2.4. Mode of booking Outlook
- 2.5. Regional Outlook
Chapter 3. Domestic Tourism Market Variables, Trends & Scope
- 3.1. Market Introduction
- 3.2. Penetration & Growth Prospect Mapping
- 3.3. Impact of COVID-19 on Domestic Tourism Market
- 3.4. Industry Value Chain Analysis
- 3.4.1. Sales/Retail Channel Analysis
- 3.5. Market Dynamics
- 3.5.1. Market Driver Analysis
- 3.5.2. Market Restraint Analysis
- 3.5.3. Industry Challenges
- 3.5.4. Industry Opportunities
- 3.6. Business Environment Analysis
- 3.6.1. Industry Analysis - Porter's
- 3.6.1.1. Supplier Power
- 3.6.1.2. Buyer Power
- 3.6.1.3. Substitution Threat
- 3.6.1.4. Threat from New Entrant
- 3.6.1.5. Competitive Rivalry
- 3.6.1. Industry Analysis - Porter's
- 3.7. Roadmap of Domestic Tourism Market
- 3.8. Market Entry Strategies
Chapter 4. Consumer Behavior Analysis
- 4.1. Demographic Analysis
- 4.2. Consumer Trends and Preferences
- 4.3. Factors Affecting Buying Decision
- 4.4. Consumer Tour Type Adoption
- 4.5. Observations & Recommendations
Chapter 5. Domestic Tourism Market: Tour Type Estimates & Trend Analysis
- 5.1. Tour Type Movement Analysis & Market Share, 2022 & 2030
- 5.2. Adventure
- 5.2.1. Market estimates and forecast, 2017 - 2030 (USD Billion)
- 5.3. Spiritual/Cultural
- 5.3.1. Market estimates and forecast, 2017 - 2030 (USD Billion)
- 5.4. Sports
- 5.4.1. Market estimates and forecast, 2017 - 2030 (USD Billion)
- 5.5. Weekend Getaways
- 5.5.1. Market estimates and forecast, 2017 - 2030 (USD Billion)
- 5.6. Others (Business, Organized Tours)
- 5.6.1. Market estimates and forecast, 2017 - 2030 (USD Billion)
Chapter 6. Domestic Tourism Market: Tourism Type Estimates & Trend Analysis
- 6.1. Tourism Type Movement Analysis & Market Share, 2022 & 2030
- 6.2. Local Travel
- 6.2.1. Market estimates and forecast, 2017 - 2030 (USD Billion)
- 6.3. Interstate Travel
- 6.3.1. Market estimates and forecast, 2017 - 2030 (USD Billion)
Chapter 7. Domestic Tourism Market: Mode of Booking Estimates & Trend Analysis
- 7.1. Mode of Booking Movement Analysis & Market Share, 2022 & 2030
- 7.2. Online
- 7.2.1. Market estimates and forecast, 2017 - 2030 (USD Billion)
- 7.3. Offline
- 7.3.1. Market estimates and forecast, 2017 - 2030 (USD Billion)
Chapter 8. Domestic Tourism Market: Regional Estimates & Trend Analysis
- 8.1. Regional Movement Analysis & Market Share, 2022 & 2030
- 8.2. North America
- 8.2.1. Market estimates and forecast, 2017 - 2030 (USD Billion)
- 8.2.2. Market estimates and forecast, by Tour Type, 2017 - 2030 (USD Billion)
- 8.2.3. Market estimates and forecast, by Tourism Type, 2017 - 2030 (USD Billion)
- 8.2.4. Market estimates and forecast, by Mode of Booking, 2017 - 2030 (USD Billion)
- 8.2.5. U.S.
- 8.2.5.1. Market estimates and forecast, 2017 - 2030 (USD Billion)
- 8.2.5.2. Market estimates and forecast, by Tour Type, 2017 - 2030 (USD Billion)
- 8.2.5.3. Market estimates and forecast, by Tourism Type, 2017 - 2030 (USD Billion)
- 8.2.5.4. Market estimates and forecast, by Mode of Booking, 2017 - 2030 (USD Billion)
- 8.2.6. Canada
- 8.2.6.1. Market estimates and forecast, 2017 - 2030 (USD Billion)
- 8.2.6.2. Market estimates and forecast, by Tour Type, 2017 - 2030 (USD Billion)
- 8.2.6.3. Market estimates and forecast, by Tourism Type, 2017 - 2030 (USD Billion)
- 8.2.6.4. Market estimates and forecast, by Mode of Booking, 2017 - 2030 (USD Billion)
- 8.3. Europe
- 8.3.1. Market estimates and forecast, 2017 - 2030 (USD Billion)
- 8.3.2. Market estimates and forecast, by Tour Type, 2017 - 2030 (USD Billion)
- 8.3.3. Market estimates and forecast, by Tourism Type, 2017 - 2030 (USD Billion)
- 8.3.4. Market estimates and forecast, by Mode of Booking, 2017 - 2030 (USD Billion)
- 8.3.5. The U.K.
- 8.3.5.1. Market estimates and forecast, 2017 - 2030 (USD Billion)
- 8.3.5.2. Market estimates and forecast, by Tour Type, 2017 - 2030 (USD Billion)
- 8.3.5.3. Market estimates and forecast, by Mode of Booking, 2017 - 2030 (USD Billion)
- 8.3.6. Germany
- 8.3.6.1. Market estimates and forecast, 2017 - 2030 (USD Billion)
- 8.3.6.2. Market estimates and forecast, by Tour Type, 2017 - 2030 (USD Billion)
- 8.3.6.3. Market estimates and forecast, by Tourism Type, 2017 - 2030 (USD Billion)
- 8.3.6.4. Market estimates and forecast, by Mode of Booking, 2017 - 2030 (USD Billion)
- 8.3.7. France
- 8.3.7.1. Market estimates and forecast, 2017 - 2030 (USD Billion)
- 8.3.7.2. Market estimates and forecast, by Tour Type, 2017 - 2030 (USD Billion)
- 8.3.7.3. Market estimates and forecast, by Tourism Type, 2017 - 2030 (USD Billion)
- 8.3.7.4. Market estimates and forecast, by Mode of Booking, 2017 - 2030 (USD Billion)
- 8.4. Asia Pacific
- 8.4.1. Market estimates and forecast, 2017 - 2030 (USD Billion)
- 8.4.2. Market estimates and forecast, by Tour Type, 2017 - 2030 (USD Billion)
- 8.4.3. Market estimates and forecast, by Tourism Type, 2017 - 2030 (USD Billion)
- 8.4.4. Market estimates and forecast, by Mode of Booking, 2017 - 2030 (USD Billion)
- 8.4.5. China
- 8.4.5.1. Market estimates and forecast, 2017 - 2030 (USD Billion)
- 8.4.5.2. Market estimates and forecast, by Tour Type, 2017 - 2030 (USD Billion)
- 8.4.5.3. Market estimates and forecast, by Tourism Type, 2017 - 2030 (USD Billion)
- 8.4.5.4. Market estimates and forecast, by Mode of Booking, 2017 - 2030 (USD Billion)
- 8.4.6. India
- 8.4.6.1. Market estimates and forecast, 2017 - 2030 (USD Billion)
- 8.4.6.2. Market estimates and forecast, by Tour Type, 2017 - 2030 (USD Billion)
- 8.4.6.3. Market estimates and forecast, by Tourism Type, 2017 - 2030 (USD Billion)
- 8.4.6.4. Market estimates and forecast, by Mode of Booking, 2017 - 2030 (USD Billion)
- 8.4.7. Japan
- 8.4.7.1. Market estimates and forecast, 2017 - 2030 (USD Billion)
- 8.4.7.2. Market estimates and forecast, by Tour Type, 2017 - 2030 (USD Billion)
- 8.4.7.3. Market estimates and forecast, by Tourism Type, 2017 - 2030 (USD Billion)
- 8.4.7.4. Market estimates and forecast, by Mode of Booking, 2017 - 2030 (USD Billion)
- 8.5. Central & South America
- 8.5.1. Market estimates and forecast, 2017 - 2030 (USD Billion)
- 8.5.2. Market estimates and forecast, by Tour Type, 2017 - 2030 (USD Billion)
- 8.5.3. Market estimates and forecast, by Tourism Type, 2017 - 2030 (USD Billion)
- 8.5.4. Market estimates and forecast, by Mode of Booking, 2017 - 2030 (USD Billion)
- 8.5.5. Brazil
- 8.5.5.1. Market estimates and forecast, 2017 - 2030 (USD Billion)
- 8.5.5.2. Market estimates and forecast, by Tour Type, 2017 - 2030 (USD Billion)
- 8.5.5.3. Market estimates and forecast, by Tourism Type, 2017 - 2030 (USD Billion)
- 8.5.5.4. Market estimates and forecast, by Mode of Booking, 2017 - 2030 (USD Billion)
- 8.6. Middles East & Africa
- 8.6.1. Market estimates and forecast, 2017 - 2030 (USD Billion)
- 8.6.2. Market estimates and forecast, by Tour Type, 2017 - 2030 (USD Billion)
- 8.6.3. Market estimates and forecast, by Tourism Type, 2017 - 2030 (USD Billion)
- 8.6.4. Market estimates and forecast, by Mode of Booking, 2017 - 2030 (USD Billion)
- 8.6.5. South Africa
- 8.6.5.1. Market estimates and forecast, 2017 - 2030 (USD Billion)
- 8.6.5.2. Market estimates and forecast, by Tour Type, 2017 - 2030 (USD Billion)
- 8.6.5.3. Market estimates and forecast, by Tourism Type, 2017 - 2030 (USD Billion)
- 8.6.5.4. Market estimates and forecast, by Mode of Booking, 2017 - 2030 (USD Billion)
Chapter 9. Competitive Analysis
- 9.1. Key global players, recent developments & their impact on the industry
- 9.2. Key Company/Competition Categorization (Key innovators, Market leaders, Emerging players)
- 9.3. Vendor Landscape
- 9.3.1. Key company market share analysis, 2022
Chapter 10. Company Profiles
- 10.1. Abercrombie & Kent USA LLC
- 10.1.1. Company Overview
- 10.1.2. Financial Performance
- 10.1.3. Tour Type Benchmarking
- 10.1.4. Strategic Initiatives
- 10.2. Expedia Group
- 10.2.1. Company Overview
- 10.2.2. Financial Performance
- 10.2.3. Tour Type Benchmarking
- 10.2.4. Strategic Initiatives
- 10.3. Cox and Kings Ltd
- 10.3.1. Company Overview
- 10.3.2. Financial Performance
- 10.3.3. Tour Type Benchmarking
- 10.3.4. Strategic Initiatives
- 10.4. Kensington Tours
- 10.4.1. Company Overview
- 10.4.2. Financial Performance
- 10.4.3. Tour Type Benchmarking
- 10.4.4. Strategic Initiatives
- 10.5. Micato Safari
- 10.5.1. Company Overview
- 10.5.2. Financial Performance
- 10.5.3. Tour Type Benchmarking
- 10.5.4. Strategic Initiatives
- 10.6. Scott Dunn Ltd.
- 10.6.1. Company Overview
- 10.6.2. Financial Performance
- 10.6.3. Tour Type Benchmarking
- 10.6.4. Strategic Initiatives
- 10.7. Tauck, Inc
- 10.7.1. Company Overview
- 10.7.2. Financial Performance
- 10.7.3. Tour Type Benchmarking
- 10.7.4. Strategic Initiatives
- 10.8. Thomas Cook India Ltd
- 10.8.1. Company Overview
- 10.8.2. Financial Performance
- 10.8.3. Tour Type Benchmarking
- 10.8.4. Strategic Initiatives
- 10.9. La Vacanza Travel
- 10.9.1. Company Overview
- 10.9.2. Financial Performance
- 10.9.3. Tour Type Benchmarking
- 10.9.4. Strategic Initiatives
- 10.10. Butterfield & Robinson
- 10.10.1. Company Overview
- 10.10.2. Financial Performance
- 10.10.3. Tour Type Benchmarking
- 10.10.4. Strategic Initiatives