|
|
市場調査レポート
商品コード
1133327
細胞ヘルススクリーニングの市場規模、シェア&動向分析レポート:検査タイプ別(シングルテストパネル、マルチテストパネル)、サンプルタイプ別(血液、尿)、採取部位別、地域別、セグメント別予測、2022年~2030年Cellular Health Screening Market Size, Share & Trends Analysis Report By Test Type (Single Test Panels, Multi-test Panels), By Sample Type (Blood, Urine), By Collection Site, By Region, And Segment Forecasts, 2022 - 2030 |
||||||
|
|
|||||||
|
● お客様のご希望に応じて、既存データの加工や未掲載情報(例:国別セグメント)の追加などの対応が可能です。 詳細はお問い合わせください。 |
|||||||


| 細胞ヘルススクリーニングの市場規模、シェア&動向分析レポート:検査タイプ別(シングルテストパネル、マルチテストパネル)、サンプルタイプ別(血液、尿)、採取部位別、地域別、セグメント別予測、2022年~2030年 |
|
出版日: 2022年09月26日
発行: Grand View Research
ページ情報: 英文 150 Pages
納期: 2~10営業日
|
- 全表示
- 概要
- 図表
- 目次
細胞ヘルススクリーニングの市場成長・動向
Grand View Research, Inc.の最新レポートによると、世界の細胞ヘルススクリーニング市場規模は2030年までに56億2000万米ドルに達し、2022年から2030年までCAGR9.2%で拡大すると予測されています。老年人口の増加と、それに伴う細胞健康診断の必要性の増加が、市場を大きく牽引しています。また、消費者直結型アプローチの採用の増加、健康寿命(HALE)の重要性の高まり、健康的な生活を送るためのテロメアパフォーマンスプログラムの増加、予防医療に対する政府の関心の高まりなどが、市場を牽引すると予想されています。
また、細胞の老化のバイオマーカーを知るために、テロメア検査などの細胞ヘルススクリーニング検査を受ける個人の数が増加していることも、市場の成長を補完すると予想されます。テロメアの長さと活性に関する情報を提供する検査は、ライフスタイルやストレス要因に関する情報も提供できることが実証されています。数多くの研究により、急性ストレスと慢性ストレスの両方が細胞の老化を促進することが実証されています。したがって、これらの検査は健康状態を把握する上で重要な役割を担っています。
さらに、運動、睡眠、精神衛生上の問題、飲酒、喫煙の習慣が、様々な形で細胞の老化をどのように変えるかを調査することで、細胞の質に関する洞察を得ることができます。テロメア検査は、代謝疾患や遺伝性疾患に対する洞察をもたらし、臨床医が早期に診断を下し、患者の治療方針を迅速かつ個別に調整することを可能にします。その結果、細胞スクリーニングへの関心の高まりと研究の拡大により、キットと検査の需要が増加し、近年の市場成長を促進しています。
細胞スクリーニング研究は、予防医学への応用や、テロメアの長さと老化の関係を理解するために必要性が高まっています。バイオ細胞ベースのスクリーニングは、患者が結果を比較し、どのような修正が必要かを理解できるように、時間をかけて頻繁にアドバイスされます。スクリーニングの間に細胞の健康状態の変化をモニターすることで、健康プロトコルを迅速に調整し、病気の管理を全般的に改善することができます。
さらに、加齢に伴う疾患は、古くなった機能不全の細胞の蓄積に関連しています。いくつかの動物実験が示すように、最近、さまざまな細胞健康法を採用することで、これらを回復させることができることが研究で確立されています。したがって、タンパク質発現、プロテオミクス、ゲノミクスの分野で進行中の研究開発活動は、近い将来、細胞ヘルススクリーニング製品の需要をさらに押し上げると予想されます。
細胞健康診断市場レポートハイライト
検査タイプ別では、2021年に単一検査パネルが最大のシェアを占めました。これは、高い特異性、容易なカスタマイズ、市場における製品入手性の向上などに起因します
シングルテストパネルセグメントでは、酸化ストレス検査が2021年に最大のシェアを獲得しました。これらの検査は、がん、呼吸器疾患、糖尿病、心血管疾患、およびその他の疾患を支援します。
サンプルタイプに基づき、血液サンプルセグメントは2021年に最大のシェアを占めました。感染症の発生率の増加、新しい病原体の出現、献血の需要の増加、献血数の増加が、細胞ヘルススクリーニングのための血液サンプルの需要上昇に寄与している
採取部位別では、2021年に病院が最大の売上シェアを獲得しました。一般人口の大部分は、病気の診断、治療、管理にこれらの長期施設を利用しているため、このセグメントを牽引している
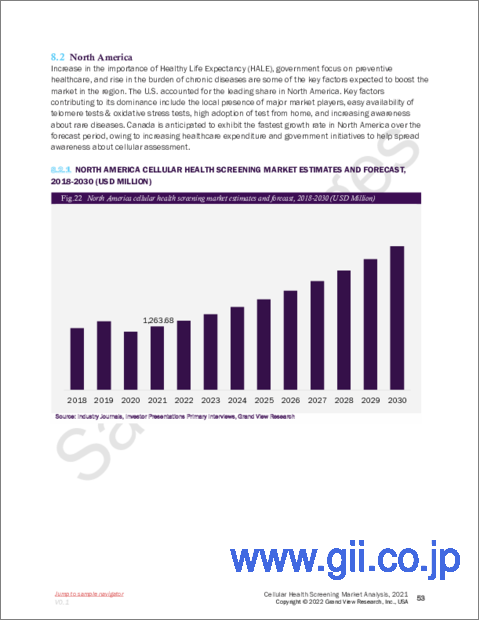
2021年、北米が最大の市場シェアを獲得。健康寿命(HALE)の重要性の高まりと、予防医療に焦点を当てた政府のイニシアティブの増加は、同地域の市場成長を後押しすると予想される主要因の一部です。
アジア太平洋地域は、予測期間を通じて最も速い成長を遂げると予想されています。テロメア機能プログラムの普及と認知度の向上、健康寿命に対する意識の高まりが、同地域の成長に寄与しています。
目次
第1章 調査手法と範囲
- 市場セグメンテーションと範囲
- 市場の定義
- 情報調達
- 購入したデータベース
- GVRの内部データベース
- 二次情報と第三者の視点
- 1次調査
- 情報分析
- データ分析モデル
- 市場形成とデータ可視化
- データの検証と公開
第2章 エグゼクティブサマリー
- 市場の見通し
- セグメントの見通し
- 競合考察
第3章 細胞ヘルススクリーニング市場の変数、動向、範囲
- 市場系列の見通し
- 親市場の見通し
- アンシラリー市場の見通し
- 浸透と成長の見通しのマッピング
- 市場力学
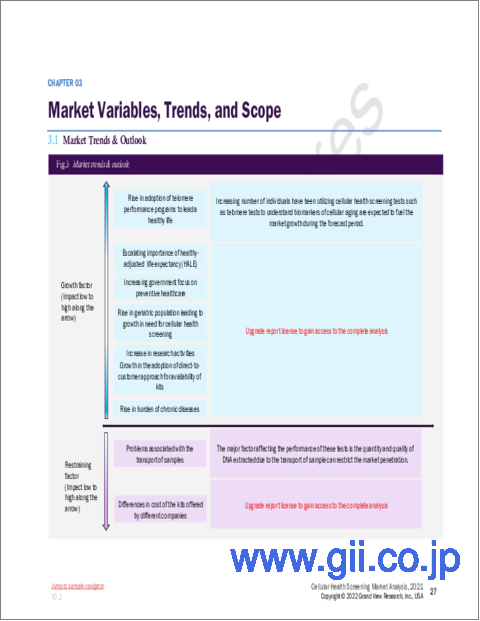
- 市場促進要因分析
- 健康的な生活を送るためのテロメアパフォーマンスプログラムの採用の増加
- 健康調整平均余命(HALE)の重要性の高まり
- 予防ヘルスケアに対する政府の関心の高まり
- 細胞ヘルススクリーニングの必要性の増加につながる高齢者人口の増加
- 調査活動の増加
- キットの入手可能性に対する消費者への直接アプローチの採用の増加
- 慢性疾患の負担増
- 市場制約分析
- サンプルの輸送に伴う問題
- 各社が提供する検査キットの価格の違い
- 業界の課題
- COVID-19影響分析
- 市場促進要因分析
- 細胞ヘルススクリーニング市場分析ツール
- 業界分析- ポーターズ
- サプライヤーの力
- 買い手の交渉力
- 代替の脅威
- 新規参入者からの脅威
- 競争企業間の敵対関係
- PESTEL分析
- 政治情勢
- 環境情勢
- 社会情勢
- テクノロジー情勢
- 法的情勢
- 業界分析- ポーターズ
第4章 細胞ヘルススクリーニング市場-競合分析
- 主要な市場参加者別最近の動向と影響分析
- ベンダー情勢
- 地域/国別の主要なサプライヤー/ディストリビューター/メーカーのリスト
- 公開会社
- 企業の市況分析
- 競合ダッシュボード分析
- プライベートカンパニー
- 主要新興企業一覧
- 地域ネットワークマップ
- 企業の市況分析
第5章 細胞ヘルススクリーニング市場:テストタイプの推定・動向分析
- 定義と範囲
- テストタイプの市場シェア分析、2021年および2030年
- セグメントダッシュボード
- 2018年から2030年までのテストタイプ別の世界の細胞ヘルススクリーニング市場
- 市場規模と予測、トレンド分析、2018年から2030年
- シングルテストパネル
- テロメア検査
- 酸化ストレス試験
- 炎症テスト
- 重金属試験
- マルチテストパネル
- シングルテストパネル
第6章 細胞ヘルススクリーニング市場:サンプルタイプの推定・動向分析
- 定義と範囲
- サンプルタイプの市場シェア分析、2021年および2030年
- セグメントダッシュボード
- 2018年から2030年までのサンプルタイプ別の世界の細胞ヘルススクリーニング市場
- 市場規模と予測、トレンド分析、2018年から2030年
- 血
- 唾液
- 血清
- 尿
第7章 細胞ヘルススクリーニング市場:収集サイトの推定・動向分析
- 定義と範囲
- コレクションサイトの市場シェア分析、2021年および2030年
- セグメントダッシュボード
- 2018年から2030年までのコレクションサイト別の世界の細胞ヘルススクリーニング市場
- 市場規模と予測、トレンド分析、2018年から2030年
- 家
- オフィス
- 病院
- 診断ラボ
第8章 細胞ヘルススクリーニング市場:地域推定・動向分析
- 地域市場のスナップショット
- 地域市場シェア、2021年
- 北米
- 欧州
- アジア太平洋地域
- ラテンアメリカ
- 中東とアフリカ
- 国別の市場シェア分析、2021年
- 北米
- 米国
- カナダ
- 欧州
- 英国
- ドイツ
- スペイン
- フランス
- イタリア
- ロシア
- アジア太平洋地域
- 日本
- 中国
- インド
- 韓国
- シンガポール
- オーストラリア
- ラテンアメリカ
- ブラジル
- メキシコ
- アルゼンチン
- 中東とアフリカ
- 南アフリカ
- サウジアラビア
- アラブ首長国連邦
- 北米
- 要因別SWOT分析(政治と法律、経済と技術)
- 北米
- 欧州
- アジア太平洋地域
- ラテンアメリカ
- 中東とアフリカ
- 市場規模と予測、トレンド分析、2021年と2030年
- 北米
- 米国
- カナダ
- 欧州
- 英国
- ドイツ
- スペイン
- フランス
- イタリア
- ロシア
- アジア太平洋地域
- 日本
- 中国
- インド
- 韓国
- シンガポール
- オーストラリア
- ラテンアメリカ
- ブラジル
- メキシコ
- アルゼンチン
- 中東とアフリカ
- 南アフリカ
- サウジアラビア
- アラブ首長国連邦
- 北米
第9章 企業プロファイル
- 企業プロファイル
- Telomere Diagnostics
- 会社概要
- 財務実績
- 製品のベンチマーク
- 戦略的イニシアチブ
- SpectraCell Laboratories
- 会社概要
- 財務実績
- 製品のベンチマーク
- 戦略的イニシアチブ
- Life Length
- 会社概要
- 財務実績
- 製品のベンチマーク
- 戦略的イニシアチブ
- Repeat Diagnostics, Inc.
- 会社概要
- 財務実績
- 製品のベンチマーク
- 戦略的イニシアチブ
- Cell Science Systems Corp.
- 会社概要
- 財務実績
- 製品のベンチマーク
- 戦略的イニシアチブ
- Quest Diagnostics
- 会社概要
- 財務実績
- 製品のベンチマーク
- 戦略的イニシアチブ
- LabCorp Holdings
- 会社概要
- 財務実績
- 製品のベンチマーク
- 戦略的イニシアチブ
- OPKO
- 会社概要
- 財務実績
- 製品のベンチマーク
- 戦略的イニシアチブ
- Genova Diagnostics
- 会社概要
- 財務実績
- 製品のベンチマーク
- 戦略的イニシアチブ
- Immunodiagnostik AG
- 会社概要
- 財務実績
- 製品のベンチマーク
- 戦略的イニシアチブ
- DNA Labs
- 会社概要
- 財務実績
- 製品のベンチマーク
- 戦略的イニシアチブ
- Telomere Diagnostics
List of Tables
- Table 1 List of key distributors and channel partners
- Table 2 List of key emerging companies'/technology disruptors/innovators
- Table 3 North America cellular health screening market, by country, 2018 to 2030 (USD Million)
- Table 4 North America cellular health screening market, by test type, 2018 to 2030 (USD Million)
- Table 5 North America cellular health screening market, by single test panels, 2018 to 2030 (USD Million)
- Table 6 North America cellular health screening market, by sample type, 2018 to 2030 (USD Million)
- Table 7 North America cellular health screening market, by collection site, 2018 to 2030 (USD Million)
- Table 8 U.S. cellular health screening market, by test type, 2018 to 2030 (USD Million)
- Table 9 U.S. cellular health screening market, by single test panels, 2018 to 2030 (USD Million)
- Table 10 U.S. cellular health screening market, by sample type, 2018 to 2030 (USD Million)
- Table 11 U.S. cellular health screening market, by collection site, 2018 to 2030 (USD Million)
- Table 12 Canada cellular health screening market, by test type, 2018 to 2030 (USD Million)
- Table 13 Canada cellular health screening market, by single test panels, 2018 to 2030 (USD Million)
- Table 14 Canada cellular health screening market, by sample type, 2018 to 2030 (USD Million)
- Table 15 Canada cellular health screening market, by collection site, 2018 to 2030 (USD Million)
- Table 16 Europe cellular health screening market, by country, 2018 to 2030 (USD Million)
- Table 17 Europe cellular health screening market, by test type, 2018 to 2030 (USD Million)
- Table 18 Europe cellular health screening market, by single test panels, 2018 to 2030 (USD Million)
- Table 19 Europe cellular health screening market, by sample type, 2018 to 2030 (USD Million)
- Table 20 Europe cellular health screening market, by collection site, 2018 to 2030 (USD Million)
- Table 21 Germany cellular health screening market, by test type, 2018 to 2030 (USD Million)
- Table 22 Germany cellular health screening market, by single test panels, 2018 to 2030 (USD Million)
- Table 23 Germany cellular health screening market, by sample type, 2018 to 2030 (USD Million)
- Table 24 Germany cellular health screening market, by collection site, 2018 to 2030 (USD Million)
- Table 25 U.K. cellular health screening market, by test type, 2018 to 2030 (USD Million)
- Table 26 U.K. cellular health screening market, by single test panels, 2018 to 2030 (USD Million)
- Table 27 U.K. cellular health screening market, by sample type, 2018 to 2030 (USD Million)
- Table 28 U.K. cellular health screening market, by collection site, 2018 to 2030 (USD Million)
- Table 29 France cellular health screening market, by test type, 2018 to 2030 (USD Million)
- Table 30 France cellular health screening market, by single test panels, 2018 to 2030 (USD Million)
- Table 31 France cellular health screening market, by sample type, 2018 to 2030 (USD Million)
- Table 32 France cellular health screening market, by collection site, 2018 to 2030 (USD Million)
- Table 33 Spain cellular health screening market, by test type, 2018 to 2030 (USD Million)
- Table 34 Spain cellular health screening market, by single test panels, 2018 to 2030 (USD Million)
- Table 35 Spain cellular health screening market, by sample type, 2018 to 2030 (USD Million)
- Table 36 Spain cellular health screening market, by collection site, 2018 to 2030 (USD Million)
- Table 37 Italy cellular health screening market, by test type, 2018 to 2030 (USD Million)
- Table 38 Italy cellular health screening market, by single test panels, 2018 to 2030 (USD Million)
- Table 39 Italy cellular health screening market, by sample type, 2018 to 2030 (USD Million)
- Table 40 Italy cellular health screening market, by collection site, 2018 to 2030 (USD Million)
- Table 41 Russia cellular health screening market, by test type, 2018 to 2030 (USD Million)
- Table 42 Russia cellular health screening market, by single test panels, 2018 to 2030 (USD Million)
- Table 43 Russia cellular health screening market, by sample type, 2018 to 2030 (USD Million)
- Table 44 Russia cellular health screening market, by collection site, 2018 to 2030 (USD Million)
- Table 45 Asia Pacific cellular health screening market, by country, 2018 to 2030 (USD Million)
- Table 46 Asia Pacific cellular health screening market, by test type, 2018 to 2030 (USD Million)
- Table 47 Asia Pacific cellular health screening market, by single test panels, 2018 to 2030 (USD Million)
- Table 48 Asia Pacific cellular health screening market, by sample type, 2018 to 2030 (USD Million)
- Table 49 Asia Pacific cellular health screening market, by collection site, 2018 to 2030 (USD Million)
- Table 50 Japan cellular health screening market, by test type, 2018 to 2030 (USD Million)
- Table 51 Japan cellular health screening market, by single test panels, 2018 to 2030 (USD Million)
- Table 52 Japan cellular health screening market, by sample type, 2018 to 2030 (USD Million)
- Table 53 Japan cellular health screening market, by collection site, 2018 to 2030 (USD Million)
- Table 54 China cellular health screening market, by test type, 2018 to 2030 (USD Million)
- Table 55 China cellular health screening market, by single test panels, 2018 to 2030 (USD Million)
- Table 56 China cellular health screening market, by sample type, 2018 to 2030 (USD Million)
- Table 57 China cellular health screening market, by collection site, 2018 to 2030 (USD Million)
- Table 58 India cellular health screening market, by test type, 2018 to 2030 (USD Million)
- Table 59 India cellular health screening market, by single test panels, 2018 to 2030 (USD Million)
- Table 60 India cellular health screening market, by sample type, 2018 to 2030 (USD Million)
- Table 61 India cellular health screening market, by collection site, 2018 to 2030 (USD Million)
- Table 62 South Korea cellular health screening market, by test type, 2018 to 2030 (USD Million)
- Table 63 South Korea cellular health screening market, by single test panels, 2018 to 2030 (USD Million)
- Table 64 South Korea cellular health screening market, by sample type, 2018 to 2030 (USD Million)
- Table 65 South Korea cellular health screening market, by collection site, 2018 to 2030 (USD Million)
- Table 66 Singapore cellular health screening market, by test type, 2018 to 2030 (USD Million)
- Table 67 Singapore cellular health screening market, by single test panels, 2018 to 2030 (USD Million)
- Table 68 Singapore cellular health screening market, by sample type, 2018 to 2030 (USD Million)
- Table 69 Singapore cellular health screening market, by collection site, 2018 to 2030 (USD Million)
- Table 70 Australia cellular health screening market, by test type, 2018 to 2030 (USD Million)
- Table 71 Australia cellular health screening market, by single test panels, 2018 to 2030 (USD Million)
- Table 72 Australia cellular health screening market, by sample type, 2018 to 2030 (USD Million)
- Table 73 Australia cellular health screening market, by collection site, 2018 to 2030 (USD Million)
- Table 74 Latin America cellular health screening market, by country, 2018 to 2030 (USD Million)
- Table 75 Latin America cellular health screening market, by test type, 2018 to 2030 (USD Million)
- Table 76 Latin America cellular health screening market, by single test panels, 2018 to 2030 (USD Million)
- Table 77 Latin America cellular health screening market, by sample type, 2018 to 2030 (USD Million)
- Table 78 Latin America cellular health screening market, by collection site, 2018 to 2030 (USD Million)
- Table 79 Brazil cellular health screening market, by test type, 2018 to 2030 (USD Million)
- Table 80 Brazil cellular health screening market, by single test panels, 2018 to 2030 (USD Million)
- Table 81 Brazil cellular health screening market, by sample type, 2018 to 2030 (USD Million)
- Table 82 Brazil cellular health screening market, by collection site, 2018 to 2030 (USD Million)
- Table 83 Mexico cellular health screening market, by test type, 2018 to 2030 (USD Million)
- Table 84 Mexico cellular health screening market, by single test panels, 2018 to 2030 (USD Million)
- Table 85 Mexico cellular health screening market, by sample type, 2018 to 2030 (USD Million)
- Table 86 Mexico cellular health screening market, by collection site, 2018 to 2030 (USD Million)
- Table 87 Argentina cellular health screening market, by test type, 2018 to 2030 (USD Million)
- Table 88 Argentina cellular health screening market, by single test panels, 2018 to 2030 (USD Million)
- Table 89 Argentina cellular health screening market, by sample type, 2018 to 2030 (USD Million)
- Table 90 Argentina cellular health screening market, by collection site, 2018 to 2030 (USD Million)
- Table 91 MEA cellular health screening market, by country, 2018 to 2030 (USD Million)
- Table 92 MEA cellular health screening market, by test type, 2018 to 2030 (USD Million)
- Table 93 MEA cellular health screening market, by single test panels, 2018 to 2030 (USD Million)
- Table 94 MEA cellular health screening market, by sample type, 2018 to 2030 (USD Million)
- Table 95 MEA cellular health screening market, by collection site, 2018 to 2030 (USD Million)
- Table 96 South Africa cellular health screening market, by test type, 2018 to 2030 (USD Million)
- Table 97 South Africa cellular health screening market, by single test panels, 2018 to 2030 (USD Million)
- Table 98 South Africa cellular health screening market, by sample type, 2018 to 2030 (USD Million)
- Table 99 South Africa cellular health screening market, by collection site, 2018 to 2030 (USD Million)
- Table 100 Saudi Arabia cellular health screening market, by test type, 2018 to 2030 (USD Million)
- Table 101 Saudi Arabia cellular health screening market, by single test panels, 2018 to 2030 (USD Million)
- Table 102 Saudi Arabia cellular health screening market, by sample type, 2018 to 2030 (USD Million)
- Table 103 Saudi Arabia cellular health screening market, by collection site, 2018 to 2030 (USD Million)
- Table 104 UAE cellular health screening market, by test type, 2018 to 2030 (USD Million)
- Table 105 UAE cellular health screening market, by single test panels, 2018 to 2030 (USD Million)
- Table 106 UAE cellular health screening market, by sample type, 2018 to 2030 (USD Million)
- Table 107 UAE cellular health screening market, by collection site, 2018 to 2030 (USD Million)
List of Figures
- Fig. 1 Cellular health screening market segmentation
- Fig. 2 Market research process
- Fig. 3 Information procurement
- Fig. 4 Primary research pattern
- Fig. 5 Market research approaches
- Fig. 6 Value chain based sizing & forecasting
- Fig. 7 QFD modelling for market share assessment
- Fig. 8 Cellular health screening market snapshot (2021)
- Fig. 9 Cellular health screening market: Segment snapshot (2021)
- Fig. 10 Competitive Insights (2021)
- Fig. 11 Parent market outlook
- Fig. 12 Related/ancillary market outlook
- Fig. 13 Penetration and growth prospect mapping
- Fig. 14 Cellular health screening market driver impact
- Fig. 15 Cellular health screening market restraint impact
- Fig. 16 Cellular health screening market industry challenges
- Fig. 17 Porter's Five Forces Analysis
- Fig. 18 SWOT Analysis, By Factor (Political & legal Economic and technological)
- Fig. 19 Strategic alliance analysis
- Fig. 20 Recent developments & impact analysis, by key market participants
- Fig. 21 Key company market share analysis, 2021
- Fig. 22 Company market position analysis
- Fig. 23 Definition and scope, by test type
- Fig. 24 Test type market share analysis, 2021 & 2030
- Fig. 25 Segment dashboard
- Fig. 26 Global cellular health screening market, by test type, 2018 - 2030 (USD Million)
- Fig. 27 Single test panels market size & forecasts and trend analysis, 2018 to 2030 (USD Million)
- Fig. 28 Telomere tests market size & forecasts and trend analysis, 2018 to 2030 (USD Million)
- Fig. 29 Oxidative stress tests market size & forecasts and trend analysis, 2018 to 2030 (USD Million)
- Fig. 30 Inflammation tests market size & forecasts and trend analysis, 2018 to 2030 (USD Million)
- Fig. 31 Heavy metals tests market size & forecasts and trend analysis, 2018 to 2030 (USD Million)
- Fig. 32 Multi-test panels market size & forecasts and trend analysis, 2018 to 2030 (USD Million)
- Fig. 33 Definition and scope, by sample type
- Fig. 34 Sample Type market share analysis, 2021 & 2030
- Fig. 35 Segment dashboard
- Fig. 36 Global cellular health screening market, by sample type, 2018 to 2030 (USD Million)
- Fig. 37 Blood market size & forecasts and trend analysis, 2018 to 2030 (USD Million)
- Fig. 38 Saliva market size & forecasts and trend analysis, 2018 to 2030 (USD Million)
- Fig. 39 Serum market size & forecasts and trend analysis, 2018 to 2030 (USD Million)
- Fig. 40 Urine market size & forecasts and trend analysis, 2018 to 2030 (USD Million)
- Fig. 41 Definition and scope, by collection site
- Fig. 42 Collection site market share analysis, 2021 & 2030
- Fig. 43 Segment dashboard
- Fig. 44 Global cellular health screening market, by collection site, 2018 to 2030 (USD Million)
- Fig. 45 Home market size & forecasts and trend analysis, 2018 to 2030 (USD Million)
- Fig. 46 Office market size & forecasts and trend analysis, 2018 to 2030 (USD Million)
- Fig. 47 Hospital market size & forecasts and trend analysis, 2018 to 2030 (USD Million)
- Fig. 48 Diagnostic labs market size & forecasts and trend analysis, 2018 to 2030 (USD Million)
- Fig. 49 Cellular health screening market: Snapshot, 2021
- Fig. 50 North America cellular health screening market share and leading players, 2021
- Fig. 51 Europe cellular health screening market share and leading players, 2021
- Fig. 52 Asia Pacific cellular health screening market share and leading players, 2021
- Fig. 53 Latin America cellular health screening market share and leading players, 2021
- Fig. 54 Middle East and Africa cellular health screening market share and leading players, 2021
- Fig. 55 North America market share analysis by country, 2021
- Fig. 56 Europe market share analysis by country, 2021
- Fig. 57 Asia Pacific market share analysis by country, 2021
- Fig. 58 Latin America market share analysis by country, 2021
- Fig. 59 Middle East and Africa market share analysis by country, 2021
- Fig. 60 North America SWOT analysis, by factor (political & legal, economic and technological)
- Fig. 61 Europe SWOT analysis, by factor (political & legal, economic and technological)
- Fig. 62 Asia Pacific SWOT analysis, by factor (political & legal, economic and technological)
- Fig. 63 Latin America SWOT analysis, by factor (political & legal, economic and technological)
- Fig. 64 Middle East and Africa SWOT analysis, by factor (political & legal, economic and technological)
- Fig. 65 North America market size, & forecasts and trend analysis, 2018 to 2030 (USD Million)
- Fig. 66 U.S. market size, & forecasts and trend analysis, 2018 to 2030 (USD Million)
- Fig. 67 Canada market size, & forecasts and trend analysis, 2018 to 2030 (USD Million)
- Fig. 68 Europe market size, & forecasts and trend analysis, 2018 to 2030 (USD Million)
- Fig. 69 U.K. market size, & forecasts and trend analysis, 2018 to 2030 (USD Million)
- Fig. 70 Germany market size, & forecasts and trend analysis, 2018 to 2030 (USD Million)
- Fig. 71 Spain market size, & forecasts and trend analysis, 2018 to 2030 (USD Million)
- Fig. 72 France market size, & forecasts and trend analysis, 2018 to 2030 (USD Million)
- Fig. 73 Italy market size, & forecasts and trend analysis, 2018 to 2030 (USD Million)
- Fig. 74 Russia market size, & forecasts and trend analysis, 2018 to 2030 (USD Million)
- Fig. 75 Asia Pacific market size, & forecasts and trend analysis, 2018 to 2030 (USD Million)
- Fig. 76 China market size, & forecasts and trend analysis, 2018 to 2030 (USD Million)
- Fig. 77 Japan market size, & forecasts and trend analysis, 2018 to 2030 (USD Million)
- Fig. 78 India market size, & forecasts and trend analysis, 2018 to 2030 (USD Million)
- Fig. 79 Australia market size, & forecasts and trend analysis, 2018 to 2030 (USD Million)
- Fig. 80 South Korea market size, & forecasts and trend analysis, 2018 to 2030 (USD Million)
- Fig. 81 Singapore market size, & forecasts and trend analysis, 2018 to 2030 (USD Million)
- Fig. 82 Latin America market size, & forecasts and trend analysis, 2018 to 2030 (USD Million)
- Fig. 83 Brazil market size, & forecasts and trend analysis, 2018 to 2030 (USD Million)
- Fig. 84 Mexico market size, & forecasts and trend analysis, 2018 to 2030 (USD Million)
- Fig. 85 Argentina market size, & forecasts and trend analysis, 2018 to 2030 (USD Million))
- Fig. 86 Middle East and Africa market size, & forecasts and trend analysis, 2018 to 2030 (USD Million)
- Fig. 87 South Africa market size, & forecasts and trend analysis, 2018 to 2030 (USD Million)
- Fig. 88 Saudi Arabia market size, & forecasts and trend analysis, 2018 to 2030 (USD Million)
- Fig. 89 UAE market size, & forecasts and trend analysis, 2018 to 2030 (USD Million)
Cellular Health Screening Market Growth & Trends:
The global cellular health screening market size is expected to reach USD 5.62 billion by 2030, according to a new report by Grand View Research, Inc., expanding at a CAGR of 9.2% from 2022 to 2030. The growing geriatric population and consequent growth in the requirement for cellular health screening are majorly driving the market. In addition, the rising adoption of the direct-to-consumer approach, the growing importance of healthy life expectancy (HALE), increasing telomere performance programs for leading a healthy life, and rising government focus on preventive healthcare are expected to drive the market.
An increasing number of individuals undergoing cellular health screening testing, such as telomere tests, to learn about the biomarkers of cell aging is also anticipated to supplement the market growth. It has been demonstrated that tests that provide information on telomere length and activity can also provide information on lifestyle and stress factors. Numerous studies have demonstrated that both acute stress and chronic stress accelerate cell aging. Thus, these tests play an important role in understanding one's health.
Additionally, researchers can gain insights into cellular qualities by studying how physical exercise, sleep, mental health issues, alcohol use, and smoking habits alter cellular aging in various ways. The utilization of telomere tests offers insights into metabolic and genetic illnesses, enabling clinicians to make an early diagnosis and quickly and individually tailor a patient's treatment regimen. Consequently, growing interest in cellular screening and expanding research have increased kit and test demand, facilitating market growth in recent years.
The necessity for cellular screening research has grown as a result of its many applications in preventive medicine and the capacity to comprehend relationships between telomere length and aging. Bio-cell-based screenings are frequently advised throughout time, allowing patients to compare results and comprehend what modifications need to be made. Monitoring these alterations in cellular health between screenings enables quick adjustments to be made in terms of health protocols and a general improvement in illness management.
Furthermore, disorders related to aging are linked to the buildup of old, dysfunctional cells. As shown in several animal trials, research has recently established that these can be reversed by employing a variety of cellular health procedures. Consequently, it is anticipated that ongoing research and development activities in the disciplines of protein expression, proteomics, and genomics are anticipated to further boost the demand for cellular health screening products in the near future.
Cellular Health Screening Market Report Highlights:
- By test type, single test panels held the largest share in 2021. This is attributed to high specificity, easy customization, and increasing product availability in the market
- In the single test panels segment, the oxidative stress tests captured the largest share in 2021. These tests aid in cancer, respiratory diseases, diabetes, cardiovascular diseases, and other diseases
- Based on sample type, the blood sample segment accounted for the largest share in 2021. The growing incidence of infectious diseases, emergence of newer pathogens, increasing demand for donated blood, and rising number of blood donations have contributed to the rising demand for blood samples for cellular health screening
- By collection site, hospitals captured the largest revenue share in 2021. A major part of the general population relies on these long-term facilities for diagnosis, treatment, and management of diseases, thus driving the segment
- North America accounted for the largest market share in 2021. An increase in the importance of Healthy Life Expectancy (HALE) and increasing number of government initiatives focused on preventive healthcare are some of the key factors expected to boost the market growth in the region
- Asia Pacific is expected to witness the fastest growth throughout the forecast period. Improving adoption and awareness of telomere performance programs and growing awareness of healthy life expectancy have contributed to regional growth
Table of Contents
Chapter 1 Methodology and Scope
- 1.1 Market segmentation & scope
- 1.2 Market definition
- 1.3 Information procurement
- 1.3.1 Purchased database
- 1.3.2 GVR's internal database
- 1.3.3 Secondary sources & third party perspectives
- 1.3.4 Primary research
- 1.4 Information analysis
- 1.4.1 Data analysis models
- 1.5 Market formulation & data visualization
- 1.6 Data validation & publishing
Chapter 2 Executive Summary
- 2.1 Market Outlook
- 2.2 Segment Outlook
- 2.3 Competitive Insights
Chapter 3 Cellular Health Screening Market Variables, Trends & Scope
- 3.1 Market Lineage Outlook
- 3.1.1 Parent Market Outlook
- 3.1.2 Ancillary Market Outlook
- 3.2 Penetration and Growth Prospect Mapping
- 3.3 Market Dynamics
- 3.3.1 Market driver analysis
- 3.3.1.1 Rise in the adoption of telomere performance programs to lead a healthy life
- 3.3.1.2 Increase in importance of health-adjusted life expectancy (HALE)
- 3.3.1.3 Increasing government focus on preventive healthcare
- 3.3.1.4 Rise in geriatric population leading to growth in the need for cellular health screening
- 3.3.1.5 Increase in research activities
- 3.3.1.6 Growth in the adoption of direct-to-consumer approach for the availability of kits
- 3.3.1.7 Rise in burden of chronic diseases
- 3.3.2 Market Restraint Analysis
- 3.3.2.1 Problems associated with the transport of samples
- 3.3.2.2 Differences in the cost of test kits offered by different companies
- 3.3.3 Industry challenges
- 3.3.4 COVID-19 Impact Analysis
- 3.3.1 Market driver analysis
- 3.4 Cellular Health Screening Market Analysis Tools
- 3.4.1 Industry analysis - Porter's
- 3.4.1.1 Supplier Power
- 3.4.1.2 Buyer Power
- 3.4.1.3 Substitution Threat
- 3.4.1.4 Threat from new entrants
- 3.4.1.5 Competitive Rivalry
- 3.4.2 PESTEL Analysis
- 3.4.2.1 Political Landscape
- 3.4.2.2 Environmental Landscape
- 3.4.2.3 Social landscape
- 3.4.2.4 Technology landscape
- 3.4.2.5 Legal Landscape
- 3.4.1 Industry analysis - Porter's
Chapter 4 Cellular Health Screening Market - Competitive Analysis
- 4.1 Recent Developments & Impact Analysis, by Key Market Participants
- 4.2 Vendor Landscape
- 4.2.1 List of Major Suppliers/Distributors/Manufacturers, By Region/Country
- 4.3 Public Companies
- 4.3.1 Company market position analysis
- 4.3.2 Competitive dashboard analysis
- 4.4 Private Companies
- 4.4.1 List of key emerging companies
- 4.4.2 Regional network map
- 4.4.3 Company market position analysis
Chapter 5 Cellular Health Screening Market: Test Type Estimates And Trend Analysis
- 5.1 Definition & Scope
- 5.2 Test Type Market Share Analysis, 2021 & 2030
- 5.3 Segment Dashboard
- 5.4 Global Cellular Health Screening Market, by Test Type, 2018 to 2030
- 5.5 Market Size & Forecasts and Trend Analyses, 2018 to 2030
- 5.5.1 Single Test Panels
- 5.5.1.1 Single Test Panels Market Estimates and Forecasts, 2018 to 2030 (USD Million)
- 5.5.1.2 Telomere Tests
- 5.5.1.2.1 Telomere Tests Market Estimates and Forecasts, 2018 to 2030 (USD Million)
- 5.5.1.3 Oxidative Stress Tests
- 5.5.1.3.1 Oxidative Stress Tests Market Estimates and Forecasts, 2018 to 2030 (USD Million)
- 5.5.1.4 Inflammation Tests
- 5.5.1.4.1 Inflammation Tests Market Estimates and Forecasts, 2018 to 2030 (USD Million)
- 5.5.1.5 Heavy Metals Tests
- 5.5.1.5.1 Heavy Metals Tests Market Estimates and Forecasts, 2018 to 2030 (USD Million)
- 5.5.2 Multi-test Panels
- 5.5.2.1 Multi-test Panels Market Estimates and Forecasts, 2018 to 2030 (USD Million)
- 5.5.1 Single Test Panels
Chapter 6 Cellular Health Screening Market: Sample Type Estimates And Trend Analysis
- 6.1 Definition & Scope
- 6.2 Sample Type Market Share Analysis, 2021 & 2030
- 6.3 Segment Dashboard
- 6.4 Global Cellular Health Screening Market, by Sample Type, 2018 to 2030
- 6.5 Market Size & Forecasts and Trend Analyses, 2018 to 2030
- 6.5.1 Blood
- 6.5.1.1 Blood Market Estimates and Forecasts, 2018 to 2030 (USD Million)
- 6.5.2 Saliva
- 6.5.2.1 Saliva Market Estimates and Forecasts, 2018 to 2030 (USD Million)
- 6.5.3 Serum
- 6.5.3.1 Serum Market Estimates and Forecasts, 2018 to 2030 (USD Million)
- 6.5.4 Urine
- 6.5.4.1 Urine Market Estimates and Forecasts, 2018 to 2030 (USD Million)
- 6.5.1 Blood
Chapter 7 Cellular Health Screening Market: Collection Site Estimates And Trend Analysis
- 7.1 Definition & Scope
- 7.2 Collection Site Market Share Analysis, 2021 & 2030
- 7.3 Segment Dashboard
- 7.4 Global Cellular Health Screening Market, by Collection Site, 2018 to 2030
- 7.5 Market Size & Forecasts and Trend Analyses, 2018 to 2030
- 7.5.1 Home
- 7.5.1.1 Home Market Estimates and Forecasts, 2018 to 2030 (USD Million)
- 7.5.2 Office
- 7.5.2.1 Office Market Estimates and Forecasts, 2018 to 2030 (USD Million)
- 7.5.3 Hospital
- 7.5.3.1 Hospital Market Estimates and Forecasts, 2018 to 2030 (USD Million)
- 7.5.4 Diagnostic Labs
- 7.5.4.1 Diagnostic Labs Market Estimates and Forecasts, 2018 to 2030 (USD Million)
- 7.5.1 Home
Chapter 8 Cellular Health Screening Market: Regional Estimates & Trend Analysis
- 8.1 Regional Market Snapshot
- 8.2 Regional Market Share, 2021
- 8.2.1 North America
- 8.2.2 Europe
- 8.2.3 Asia Pacific
- 8.2.4 Latin America
- 8.2.5 Middle East & Africa
- 8.3 Market Share Analysis by Country, 2021
- 8.3.1 North America
- 8.3.1.1 U.S.
- 8.3.1.2 Canada
- 8.3.2 Europe
- 8.3.2.1 U.K.
- 8.3.2.2 Germany
- 8.3.2.3 Spain
- 8.3.2.4 France
- 8.3.2.5 Italy
- 8.3.2.6 Russia
- 8.3.3 Asia Pacific
- 8.3.3.1 Japan
- 8.3.3.2 China
- 8.3.3.3 India
- 8.3.3.4 South Korea
- 8.3.3.5 Singapore
- 8.3.3.6 Australia
- 8.3.4 Latin America
- 8.3.4.1 Brazil
- 8.3.4.2 Mexico
- 8.3.4.3 Argentina
- 8.3.5 Middle East & Africa
- 8.3.5.1 South Africa
- 8.3.5.2 Saudi Arabia
- 8.3.5.3 UAE
- 8.3.1 North America
- 8.4 SWOT Analysis, by Factor (Political & Legal, Economic and Technological)
- 8.4.1 North America
- 8.4.2 Europe
- 8.4.3 Asia Pacific
- 8.4.4 Latin America
- 8.4.5 Middle East & Africa
- 8.5 Market Size & Forecasts, and Trend Analysis, 2021 & 2030
- 8.5.1 North America
- 8.5.1.1 North America Market Size & Forecasts and Trend Analysis, 2018 to 2030 (USD Million)
- 8.5.1.2 U.S.
- 8.5.1.2.1 U.S. Market Size & Forecasts and Trend Analysis, By Test Type, 2018 to 2030 (USD Million)
- 8.5.1.2.2 U.S. Market Size & Forecasts and Trend Analysis, By Sample Type, 2018 to 2030 (USD Million)
- 8.5.1.2.3 U.S. Market Size & Forecasts and Trend Analysis, By Collection Site, 2018 to 2030 (USD Million)
- 8.5.1.3 Canada
- 8.5.1.3.1 Canada Market Size & Forecasts and Trend Analysis, By Test Type, 2018 to 2030 (USD Million)
- 8.5.1.3.2 Canada Market Size & Forecasts and Trend Analysis, By Sample Type, 2018 to 2030 (USD Million)
- 8.5.1.3.3 Canada Market Size & Forecasts and Trend Analysis, By Collection Site, 2018 to 2030 (USD Million)
- 8.5.2 Europe
- 8.5.2.1 Europe Market Size & Forecasts and Trend Analysis, 2018 to 2030 (USD Million)
- 8.5.2.2 U.K.
- 8.5.2.2.1 U.K. Market Size & Forecasts and Trend Analysis, By Test Type, 2018 to 2030 (USD Million)
- 8.5.2.2.2 U.K. Market Size & Forecasts and Trend Analysis, By Sample Type, 2018 to 2030 (USD Million)
- 8.5.2.2.3 U.K. Market Size & Forecasts and Trend Analysis, By Collection Site, 2018 to 2030 (USD Million)
- 8.5.2.3 Germany
- 8.5.2.3.1 Germany Market Size & Forecasts and Trend Analysis, By Test Type, 2018 to 2030 (USD Million)
- 8.5.2.3.2 Germany Market Size & Forecasts and Trend Analysis, By Sample Type, 2018 to 2030 (USD Million)
- 8.5.2.3.3 Germany Market Size & Forecasts and Trend Analysis, By Collection Site, 2018 to 2030 (USD Million)
- 8.5.2.4 Spain
- 8.5.2.4.1 Spain Market Size & Forecasts and Trend Analysis, By Test Type, 2018 to 2030 (USD Million)
- 8.5.2.4.2 Spain Market Size & Forecasts and Trend Analysis, By Sample Type, 2018 to 2030 (USD Million)
- 8.5.2.4.3 Spain Market Size & Forecasts and Trend Analysis, By Collection Site, 2018 to 2030 (USD Million)
- 8.5.2.5 France
- 8.5.2.5.1 France Market Size & Forecasts and Trend Analysis, By Test Type, 2018 to 2030 (USD Million)
- 8.5.2.5.2 France Market Size & Forecasts and Trend Analysis, By Sample Type, 2018 to 2030 (USD Million)
- 8.5.2.5.3 France Market Size & Forecasts and Trend Analysis, By Collection Site, 2018 to 2030 (USD Million)
- 8.5.2.6 Italy
- 8.5.2.6.1 Italy Market Size & Forecasts and Trend Analysis, By Test Type, 2018 to 2030 (USD Million)
- 8.5.2.6.2 Italy Market Size & Forecasts and Trend Analysis, By Sample Type, 2018 to 2030 (USD Million)
- 8.5.2.6.3 Italy Market Size & Forecasts and Trend Analysis, By Collection Site, 2018 to 2030 (USD Million)
- 8.5.2.7 Russia
- 8.5.2.7.1 Russia Market Size & Forecasts and Trend Analysis, By Test Type, 2018 to 2030 (USD Million)
- 8.5.2.7.2 Russia Market Size & Forecasts and Trend Analysis, By Sample Type, 2018 to 2030 (USD Million)
- 8.5.2.7.3 Russia Market Size & Forecasts and Trend Analysis, By Collection Site, 2018 to 2030 (USD Million)
- 8.5.3 Asia Pacific
- 8.5.3.1 Asia Pacific Market Size & Forecasts and Trend Analysis, 2018 to 2030 (USD Million)
- 8.5.3.2 Japan
- 8.5.3.2.1 Japan Market Size & Forecasts and Trend Analysis, By Test Type, 2018 to 2030 (USD Million)
- 8.5.3.2.2 Japan Market Size & Forecasts and Trend Analysis, By Sample Type, 2018 to 2030 (USD Million)
- 8.5.3.2.3 Japan Market Size & Forecasts and Trend Analysis, By Collection Site, 2018 to 2030 (USD Million)
- 8.5.3.3 China
- 8.5.3.3.1 China Market Size & Forecasts and Trend Analysis, By Test Type, 2018 to 2030 (USD Million)
- 8.5.3.3.2 China Market Size & Forecasts and Trend Analysis, By Sample Type, 2018 to 2030 (USD Million)
- 8.5.3.3.3 China Market Size & Forecasts and Trend Analysis, By Collection Site, 2018 to 2030 (USD Million)
- 8.5.3.4 India
- 8.5.3.4.1 India Market Size & Forecasts and Trend Analysis, By Test Type, 2018 to 2030 (USD Million)
- 8.5.3.4.2 India Market Size & Forecasts and Trend Analysis, By Sample Type, 2018 to 2030 (USD Million)
- 8.5.3.4.3 India Market Size & Forecasts and Trend Analysis, By Collection Site, 2018 to 2030 (USD Million)
- 8.5.3.5 South Korea
- 8.5.3.5.1 South Korea Market Size & Forecasts and Trend Analysis, By Test Type, 2018 to 2030 (USD Million)
- 8.5.3.5.2 South Korea Market Size & Forecasts and Trend Analysis, By Sample Type, 2018 to 2030 (USD Million)
- 8.5.3.5.3 South Korea Market Size & Forecasts and Trend Analysis, By Collection Site, 2018 to 2030 (USD Million)
- 8.5.3.6 Singapore
- 8.5.3.6.1 Singapore Market Size & Forecasts and Trend Analysis, By Test Type, 2018 to 2030 (USD Million)
- 8.5.3.6.2 Singapore Market Size & Forecasts and Trend Analysis, By Sample Type, 2018 to 2030 (USD Million)
- 8.5.3.6.3 Singapore Market Size & Forecasts and Trend Analysis, By Collection Site, 2018 to 2030 (USD Million)
- 8.5.3.7 Australia
- 8.5.3.7.1 Australia Market Size & Forecasts and Trend Analysis, By Test Type, 2018 to 2030 (USD Million)
- 8.5.3.7.2 Australia Market Size & Forecasts and Trend Analysis, By Sample Type, 2018 to 2030 (USD Million)
- 8.5.3.7.3 Australia Market Size & Forecasts and Trend Analysis, By Collection Site, 2018 to 2030 (USD Million)
- 8.5.4 Latin America
- 8.5.4.1 Latin America Market Size & Forecasts and Trend Analysis, 2018 to 2030 (USD Million)
- 8.5.4.2 Brazil
- 8.5.4.2.1 Brazil Market Size & Forecasts and Trend Analysis, By Test Type, 2018 to 2030 (USD Million)
- 8.5.4.2.2 Brazil Market Size & Forecasts and Trend Analysis, By Sample Type, 2018 to 2030 (USD Million)
- 8.5.4.2.3 Brazil Market Size & Forecasts and Trend Analysis, By Collection Site, 2018 to 2030 (USD Million)
- 8.5.4.3 Mexico
- 8.5.4.3.1 Mexico Market Size & Forecasts and Trend Analysis, By Test Type, 2018 to 2030 (USD Million)
- 8.5.4.3.2 Mexico Market Size & Forecasts and Trend Analysis, By Sample Type, 2018 to 2030 (USD Million)
- 8.5.4.3.3 Mexico Market Size & Forecasts and Trend Analysis, By Collection Site, 2018 to 2030 (USD Million)
- 8.5.4.4 Argentina
- 8.5.4.4.1 Argentina Market Size & Forecasts and Trend Analysis, By Test Type, 2018 to 2030 (USD Million)
- 8.5.4.4.2 Argentina Market Size & Forecasts and Trend Analysis, By Sample Type, 2018 to 2030 (USD Million)
- 8.5.4.4.3 Argentina Market Size & Forecasts and Trend Analysis, By Collection Site, 2018 to 2030 (USD Million)
- 8.5.5 Middle East & Africa
- 8.5.5.1 Middle East & Africa Market Size & Forecasts and Trend Analysis, 2018 to 2030 (USD Million)
- 8.5.5.2 South Africa
- 8.5.5.2.1 South Africa Market Size & Forecasts and Trend Analysis, By Test Type, 2018 to 2030 (USD Million)
- 8.5.5.2.2 South Africa Market Size & Forecasts and Trend Analysis, By Sample Type, 2018 to 2030 (USD Million)
- 8.5.5.2.3 South Africa Market Size & Forecasts and Trend Analysis, By Collection Site, 2018 to 2030 (USD Million)
- 8.5.5.3 Saudi Arabia
- 8.5.5.3.1 Saudi Arabia Market Size & Forecasts and Trend Analysis, By Test Type, 2018 to 2030 (USD Million)
- 8.5.5.3.2 Saudi Arabia Market Size & Forecasts and Trend Analysis, By Sample Type, 2018 to 2030 (USD Million)
- 8.5.5.3.3 Saudi Arabia Market Size & Forecasts and Trend Analysis, By Collection Site, 2018 to 2030 (USD Million)
- 8.5.5.4 UAE
- 8.5.5.4.1 UAE Market Size & Forecasts and Trend Analysis, By Test Type, 2018 to 2030 (USD Million)
- 8.5.5.4.2 UAE Market Size & Forecasts and Trend Analysis, By Sample Type, 2018 to 2030 (USD Million)
- 8.5.5.4.3 UAE Market Size & Forecasts and Trend Analysis, By Collection Site, 2018 to 2030 (USD Million)
- 8.5.1 North America
Chapter 9 Company Profile
- 9.1 Company Profiles
- 9.1.1 Telomere Diagnostics
- 9.1.1.1 Company overview
- 9.1.1.2 Financial Performance
- 9.1.1.3 Product benchmarking
- 9.1.1.4 Strategic initiatives
- 9.1.2 SpectraCell Laboratories
- 9.1.2.1 Company overview
- 9.1.2.2 Financial Performance
- 9.1.2.3 Product benchmarking
- 9.1.2.4 Strategic initiatives
- 9.1.3 Life Length
- 9.1.3.1 Company overview
- 9.1.3.2 Financial Performance
- 9.1.3.3 Product benchmarking
- 9.1.3.4 Strategic initiatives
- 9.1.4 Repeat Diagnostics, Inc.
- 9.1.4.1 Company overview
- 9.1.4.2 Financial Performance
- 9.1.4.3 Product benchmarking
- 9.1.4.4 Strategic initiatives
- 9.1.5 Cell Science Systems Corp.
- 9.1.5.1 Company overview
- 9.1.5.2 Financial Performance
- 9.1.5.3 Product benchmarking
- 9.1.5.4 Strategic initiatives
- 9.1.6 Quest Diagnostics
- 9.1.6.1 Company overview
- 9.1.6.2 Financial Performance
- 9.1.6.3 Product benchmarking
- 9.1.6.4 Strategic initiatives
- 9.1.7 LabCorp Holdings
- 9.1.7.1 Company overview
- 9.1.7.2 Financial Performance
- 9.1.7.3 Product benchmarking
- 9.1.7.4 Strategic initiatives
- 9.1.8 OPKO
- 9.1.8.1 Company overview
- 9.1.8.2 Financial Performance
- 9.1.8.3 Product benchmarking
- 9.1.8.4 Strategic initiatives
- 9.1.9 Genova Diagnostics
- 9.1.9.1 Company overview
- 9.1.9.2 Financial Performance
- 9.1.9.3 Product benchmarking
- 9.1.9.4 Strategic initiatives
- 9.1.10 Immunodiagnostik AG
- 9.1.10.1 Company overview
- 9.1.10.2 Financial Performance
- 9.1.10.3 Product benchmarking
- 9.1.10.4 Strategic initiatives
- 9.1.11 DNA Labs
- 9.1.11.1 Company overview
- 9.1.11.2 Financial Performance
- 9.1.11.3 Product benchmarking
- 9.1.11.4 Strategic initiatives
- 9.1.1 Telomere Diagnostics