|
|
市場調査レポート
商品コード
1092739
金属加工油剤の市場規模、シェア、動向分析:製品別(鉱物、合成)、最終用途別(機械、輸送機器)、産業最終用途別、用途別のセグメント予測(2022年~2030年)Metalworking Fluids Market Size, Share & Trends Analysis Report By Product (Mineral, Synthetic), By End-use (Machinery, Transportation Equipment), By Industrial End-use, By Application, And Segment Forecasts, 2022 - 2030 |
||||||
|
|
|||||||
|
● お客様のご希望に応じて、既存データの加工や未掲載情報(例:国別セグメント)の追加などの対応が可能です。 詳細はお問い合わせください。 |
|||||||


| 金属加工油剤の市場規模、シェア、動向分析:製品別(鉱物、合成)、最終用途別(機械、輸送機器)、産業最終用途別、用途別のセグメント予測(2022年~2030年) |
|
出版日: 2022年05月31日
発行: Grand View Research
ページ情報: 英文 108 Pages
納期: 2~10営業日
|
- 全表示
- 概要
- 図表
- 目次
世界の金属加工油剤の市場規模は、予測期間に3.8%のCAGRで推移し、2030年までに1,510万米ドルに達すると予測されています。
同市場の需要は、自動車や産業機械の需要拡大に起因しており、機械、金属加工、輸送機器などの最終用途分野も、市場成長の促進要因となっています。さらに、予測期間中における、機械や輸送用機器の最終用途産業の堅調な発展が市場を牽引すると見込まれています。
当レポートでは、世界の金属加工油剤市場について調査し、市場の動向、セグメント・地域別の市場分析、競合情勢、主要企業のプロファイルなどの情報を提供しています。
目次
第1章 調査手法と範囲
第2章 エグゼクティブサマリー
第3章 金属加工油剤:市場の変数、動向および範囲
- 市場セグメンテーション
- 浸透と成長の見通しマッピング
- バリューチェーン分析
- 原材料の見通し
- 規制の枠組み
- 技術概要
- 市場力学
- ポーターのファイブフォース分析
- PESTEL分析
第4章 金属加工油剤:製品別の推計と動向分析
- 市場変動分析(2021年、2030年)
- 鉱物
- 合成
- バイオベース
第5章 金属加工油剤:用途別の推計と動向分析
- 市場変動分析(2021年、2030年)
- 純切削油
- 水溶性切削油
- 可溶性切削油
- 半合成切削油
- 合成切削油
- 腐食防止油
- その他
第6章 金属加工油剤:最終用途別の推計と動向分析
- 市場変動分析(2021年、2030年)
- 金属加工
- 輸送機器
- 機械
- その他
第7章 金属加工油剤:産業最終用途別の推計と動向分析
- 市場変動分析(2021年、2030年)
- 建設
- 電気・電力
- 農業
- 自動車
- 航空宇宙
- 鉄道
- 海洋
- 通信
- ヘルスケア
第8章 金属加工油剤:地域別の推計と動向分析
- 地域別:世界市場の収益シェア(2021年、2030年)
- 北米
- 米国
- カナダ
- メキシコ
- 欧州
- ドイツ
- ロシア
- フランス
- スペイン
- イタリア
- 英国
- スイス
- デンマーク
- ノルウェー
- ベルギー
- ポーランド
- チェコ共和国
- トルコ
- スウェーデン
- フィンランド
- アジア太平洋
- 中国
- インド
- 日本
- 韓国
- シンガポール
- マレーシア
- タイ
- オーストラリア
- ニュージーランド
- 中南米
- ブラジル
- 中東・アフリカ
第9章 競合情勢
- ベンダー情勢
- 競合環境
- 企業の市場ポジショニング
- 戦略的枠組み
- 企業の市場ランキング
第10章 金属加工油剤:メーカーの企業プロファイル
- Houghton International, Inc.
- Blaser Swisslube AG
- BP p.l.c
- Exxon Mobil Corporation
- Total S.A.
- FUCHS
- CIMCOOL Fluid Technology, LLC
- Quaker Chemical Corporation
- Eni S.p.A.
- Chevron Corporation
- Henkel AG & Co., KGaA
- Croda International Plc
- Tide Water Oil Co. (India) Ltd.
- Motul
- China Petroleum & Chemical Corporation
- Kuwait Petroleum Corporation
- Oelheld GmbH
- Apar Industries Ltd.
- MORESCO Corporation
- Indian Oil Corporation Ltd
- Hindustan Petroleum Corporation Limited
- Petroliam Nasional Berhad (PETRONAS)
- Yushiro Chemical Industry Co., Ltd.
- QualiChem, Inc.
- Master Fluid Solutions.
- Hardcastle Petrofer
- Hangsterfer's Laboratories, Inc.
- Castrol Limited
- Illinois Tool Works, Inc.
- Pennine Lubricants
- JXTG Holdings, Inc.
第11章 金属加工油剤:エンドユーザーの企業プロファイル
- Triton Manufacturing Co., Inc.
- Special Products & Mfg., Inc.
- Merrill Technologies Group
- EVS Metal
- Sandvik AB
- Deere & Company
- Ashok Leyland
- Cummins, Inc.
- Carraro S.p.A.
- Caterpillar
- Weiss GmbH
- Vernet Behringer
- TRUMPF
- Shenyang Machine Tools Co., Ltd.
- Dalian Machine Tool Group Corporation
- Doosan Infracore
- Komatsu Ltd.
- Schuler AG
- AMADA HOLDINGS Co., Ltd.
List of Tables
- Table 1 List of Abbreviations
- Table 2 Approximate estimated percentage (%) share to formulate one gallon of concentrate - Soluble oil (USD)
- Table 3 Metalworking fluids - Key market driver analysis
- Table 4 Global metalworking fluids market estimates and forecasts, by mineral type, 2018 - 2030 (Kilotons) (USD Million)
- Table 5 Global metalworking fluids market volume, by mineral, by region, 2018 - 2030 (Kilotons)
- Table 6 Global metalworking fluids market revenue, by mineral type, by region 2018 - 2030 (USD Million)
- Table 7 Global metalworking fluids market estimates and forecasts, by mineral type, 2018 - 2030 (Kilotons) (USD Million)
- Table 8 Global metalworking fluids market volume, by synthetic, by region, 2018 - 2030 (Kilotons)
- Table 9 Global metalworking fluids market revenue, by synthetic type, by region 2018 - 2030 (USD Million)
- Table 10 Global metalworking fluids market estimates and forecasts, by bio-based type, 2018 - 2030 (Kilotons) (USD Million)
- Table 11 Global metalworking fluids market volume, by bio-based, by region, 2018 - 2030 (Kilotons)
- Table 12 Global metalworking fluids market revenue, by synthetic type, by region 2018 - 2030 (USD Million)
- Table 13 Global metalworking fluids market estimates and forecasts, by neat cutting oils, 2018 - 2030 (Kilotons) (USD Million)
- Table 14 Global metalworking fluids market volume, by neat cutting oils, by region, 2018 - 2030 (Kilotons)
- Table 15 Global metalworking fluids market revenue, by neat cutting oils, by region, 2018 - 2030 (USD Million)
- Table 16 Global metalworking fluids market estimates and forecasts, by water cutting oils, 2018 - 2030 (Kilotons) (USD Million)
- Table 17 Global metalworking fluids market volume, by water cutting oils, by region, 2018 - 2030 (Kilotons)
- Table 18 Global metalworking fluids market revenue, by water cutting oils, by region, 2018 - 2030 (USD Million)
- Table 19 Global metalworking fluids market estimates and forecasts, by soluble cutting oils, 2018 - 2030 (Kilotons) (USD Million)
- Table 20 Global metalworking fluids market volume, by soluble cutting oils, by region, 2018 - 2030 (Kilotons)
- Table 21 Global metalworking fluids market revenue, by soluble cutting oils, by region 2018 - 2030 (USD Million)
- Table 22 Global metalworking fluids market estimates and forecasts, by semi-synthetic cutting oils, 2018 - 2030 (Kilotons) (USD Million)
- Table 23 Global metalworking fluids market volume, by semi-synthetic cutting oils, by region, 2018 - 2030 (Kilotons)
- Table 24 Global metalworking fluids market revenue, by semi-synthetic cutting oils, by region, 2018 - 2030 (USD Million)
- Table 25 Global metalworking fluids market estimates and forecasts, by synthetic cutting oils, 2018 - 2030 (Kilotons) (USD Million)
- Table 26 Global metalworking fluids market volume, by synthetic cutting oils, by region, 2018 - 2030 (Kilotons)
- Table 27 Global metalworking fluids market revenue, by synthetic cutting oils, by region, 2018 - 2030 (USD Million)
- Table 28 Global metalworking fluids market estimates and forecasts, by corrosion preventive oils, 2018 - 2030 (Kilotons) (USD Million)
- Table 29 Global metalworking fluids market volume, by corrosion preventive oils, by region, 2018 - 2030 (Kilotons)
- Table 30 Global metalworking fluids market revenue, by corrosion preventive oils, by region, 2018 - 2030 (USD Million)
- Table 31 Global metalworking fluids market estimates and forecasts, by others, 2018 - 2030 (Kilotons) (USD Million)
- Table 32 Global metalworking fluids market volume, by others, by region, 2018 - 2030 (Kilotons)
- Table 33 Global metalworking fluids market revenue, by others, by region, 2018 - 2030 (USD Million)
- Table 34 Global metalworking fluids market estimates and forecasts, by metal fabrication, 2018 - 2030 (Kilotons) (USD Million)
- Table 35 Global metalworking fluids market volume, by metal fabrication, by region, 2018 - 2030 (Kilotons)
- Table 36 Global metalworking fluids market revenue, by metal fabrication, by region 2018 - 2030 (USD Million)
- Table 37 Global metalworking fluids market estimates and forecasts, by transportation equipment, 2018 - 2030 (Kilotons) (USD Million)
- Table 38 Global metalworking fluids market volume, by transportation equipment, by region, 2018 - 2030 (Kilotons)
- Table 39 Global metalworking fluids market revenue, by transportation equipment, by region 2018 - 2030 (USD Million)
- Table 40 Global metalworking fluids market estimates and forecasts, by machinery, 2018 - 2030 (Kilotons) (USD Million)
- Table 41 Global metalworking fluids market volume, by machinery, by region, 2018 - 2030 (Kilotons)
- Table 42 Global metalworking fluids market revenue, by machinery, by region 2018 - 2030 (USD Million)
- Table 43 Global metalworking fluids market estimates and forecasts, by others, 2018 - 2030 (Kilotons) (USD Million)
- Table 44 Global metalworking fluids market volume, by others, by region, 2018 - 2030 (Kilotons)
- Table 45 Global metalworking fluids market revenue, by others, by region 2018 - 2030 (USD Million)
- Table 46 Global metalworking fluids market estimates and forecasts, by construction, 2018 - 2030 (Kilotons) (USD Million)
- Table 47 Global metalworking fluids market volume, by construction, by region, 2018 - 2030 (Kilotons)
- Table 48 Global metalworking fluids market revenue, by construction, by region 2018 - 2030 (USD Million)
- Table 49 Global metalworking fluids market estimates and forecasts, by electrical & power, 2018 - 2030 (Kilotons) (USD Million)
- Table 50 Global metalworking fluids market volume, by electrical & power, by region, 2018 - 2030 (Kilotons)
- Table 51 Global metalworking fluids market revenue, by electrical & power, by region 2018 - 2030 (USD Million)
- Table 52 Global metalworking fluids market estimates and forecasts, by agriculture, 2018 - 2030 (Kilotons) (USD Million)
- Table 53 Global metalworking fluids market volume, by agriculture, by region, 2018 - 2030 (Kilotons)
- Table 54 Global metalworking fluids market revenue, by agriculture, by region 2018 - 2030 (USD Million)
- Table 55 Global metalworking fluids market estimates and forecasts, by automobile, 2018 - 2030 (Kilotons) (USD Million)
- Table 56 Global metalworking fluids market volume, by automobile, by region, 2018 - 2030 (Kilotons)
- Table 57 Global metalworking fluids market revenue, by automobile, by region 2018 - 2030 (USD Million)
- Table 58 Global metalworking fluids market estimates and forecasts, by aerospace, 2018 - 2030 (Kilotons) (USD Million)
- Table 59 Global metalworking fluids market volume, by aerospace, by region, 2018 - 2030 (Kilotons)
- Table 60 Global metalworking fluids market revenue, by aerospace, by region 2018 - 2030 (USD Million)
- Table 61 Global metalworking fluids market estimates and forecasts, by rail, 2018 - 2030 (Kilotons) (USD Million)
- Table 62 Global metalworking fluids market volume, by rail, by region, 2018 - 2030 (Kilotons)
- Table 63 Global metalworking fluids market revenue, by rail, by region 2018 - 2030 (USD Million)
- Table 64 Global metalworking fluids market estimates and forecasts, by marine, 2018 - 2030 (Kilotons) (USD Million)
- Table 65 Global metalworking fluids market volume, by marine, by region, 2018 - 2030 (Kilotons)
- Table 66 Global metalworking fluids market revenue, by marine, by region 2018 - 2030 (USD Million)
- Table 67 Global metalworking fluids market estimates and forecasts, by telecommunication, 2018 - 2030 (Kilotons) (USD Million)
- Table 68 Global metalworking fluids market volume, by telecommunication, by region, 2018 - 2030 (Kilotons)
- Table 69 Global metalworking fluids market revenue, by telecommunication, by region 2018 - 2030 (USD Million)
- Table 70 Global metalworking fluids market estimates and forecasts, by healthcare, 2018 - 2030 (Kilotons) (USD Million)
- Table 71 Global metalworking fluids market volume, by healthcare, by region, 2018 - 2030 (Kilotons)
- Table 72 Global metalworking fluids market revenue, by healthcare, by region 2018 - 2030 (USD Million)
- Table 73 North America metalworking fluids market estimates and forecasts, 2018 - 2030 (Kilotons) (USD Million)
- Table 74 North America metalworking fluids market volume, by product, 2018 - 2030 (Kilotons)
- Table 75 North America metalworking fluids market revenue, by product, 2018 - 2030 (USD Million)
- Table 76 North America metalworking fluids market volume, by application, 2018 - 2030 (Kilotons)
- Table 77 North America metalworking fluids market revenue, by application, 2018 - 2030 (USD Million)
- Table 78 North America metalworking fluids market volume, by water cutting oils type, 2018 - 2030 (Kilotons)
- Table 79 North America metalworking fluids market revenue, by product, 2018 - 2030 (USD Million)
- Table 80 North America metalworking fluids market volume, by end use, 2018 - 2030 (Kilotons)
- Table 81 North America metalworking fluids market revenue, by end use, 2018 - 2030 (USD Million)
- Table 82 North America metalworking fluids market volume, by industrial end use, 2018 - 2030 (Kilotons)
- Table 83 North America metalworking fluids market revenue, by industrial end use, 2018 - 2030 (USD Million)
- Table 84 U.S. metalworking fluids market estimates and forecasts, 2018 - 2030 (Kilotons) (USD Million)
- Table 85 U.S. metalworking fluids market volume, by product, 2018 - 2030 (Kilotons)
- Table 86 U.S. metalworking fluids market revenue, by product, 2018 - 2030 (USD Million)
- Table 87 U.S. metalworking fluids market volume, by application, 2018 - 2030 (Kilotons)
- Table 88 U.S. metalworking fluids market revenue, by application, 2018 - 2030 (USD Million)
- Table 89 U.S. metalworking fluids market volume, by water cutting oils type, 2018 - 2030 (Kilotons)
- Table 90 U.S. metalworking fluids market revenue, by product, 2018 - 2030 (USD Million)
- Table 91 U.S. metalworking fluids market volume, by end use, 2018 - 2030 (Kilotons)
- Table 92 U.S. metalworking fluids market revenue, by end use, 2018 - 2030 (USD Million)
- Table 93 U.S. metalworking fluids market volume, by industrial end use, 2018 - 2030 (Kilotons)
- Table 94 U.S. metalworking fluids market revenue, by industrial end use, 2018 - 2030 (USD Million)
- Table 95 Canada metalworking fluids market estimates and forecasts, 2018 - 2030 (Kilotons) (USD Million)
- Table 96 Canada metalworking fluids market volume, by product, 2018 - 2030 (Kilotons)
- Table 97 Canada metalworking fluids market revenue, by product, 2018 - 2030 (USD Million)
- Table 98 Canada metalworking fluids market volume, by application, 2018 - 2030 (Kilotons)
- Table 99 Canada metalworking fluids market revenue, by application, 2018 - 2030 (USD Million)
- Table 100 Canada metalworking fluids market volume, by water cutting oils type, 2018 - 2030 (Kilotons)
- Table 101 Canada metalworking fluids market revenue, by water cutting oils type, 2018 - 2030 (USD Million)
- Table 102 Canada metalworking fluids market volume, by end use, 2018 - 2030 (Kilotons)
- Table 103 Canada. metalworking fluids market revenue, by end use, 2018 - 2030 (USD Million)
- Table 104 Canada metalworking fluids market volume, by industrial end use, 2018 - 2030 (Kilotons)
- Table 105 Canada metalworking fluids market revenue, by industrial end use, 2018 - 2030 (USD Million)
- Table 106 Mexico metalworking fluids market estimates and forecasts, 2018 - 2030 (Kilotons) (USD Million)
- Table 107 Mexico metalworking fluids market volume, by product, 2018 - 2030 (Kilotons)
- Table 108 Mexico metalworking fluids market revenue, by product, 2018 - 2030 (USD Million)
- Table 109 Mexico metalworking fluids market volume, by application, 2018 - 2030 (Kilotons)
- Table 110 Mexico metalworking fluids market revenue, by application, 2018 - 2030 (USD Million)
- Table 111 Mexico metalworking fluids market volume, by water cutting oils type, 2018 - 2030 (Kilotons)
- Table 112 Mexico metalworking fluids market revenue, by water cutting oils type, 2018 - 2030 (USD Million)
- Table 113 Mexico metalworking fluids market volume, by end use, 2018 - 2030 (Kilotons)
- Table 114 Mexico metalworking fluids market revenue, by end use, 2018 - 2030 (USD Million)
- Table 115 Mexico metalworking fluids market volume, by industrial end use, 2018 - 2030 (Kilotons)
- Table 116 Mexico metalworking fluids market revenue, by industrial end use, 2018 - 2030 (USD Million)
- Table 117 Europe metalworking fluids market estimates and forecasts, 2018 - 2030 (Kilotons) (USD Million)
- Table 118 Europe metalworking fluids market volume, by product, 2018 - 2030 (Kilotons)
- Table 119 Europe metalworking fluids market revenue, by product, 2018 - 2030 (USD Million)
- Table 120 Europe metalworking fluids market volume, by application, 2018 - 2030 (Kilotons)
- Table 121 Europe metalworking fluids market revenue, by application, 2018 - 2030 (USD Million)
- Table 122 Europe metalworking fluids market volume, by water cutting oils type, 2018 - 2030 (Kilotons)
- Table 123 Europe metalworking fluids market revenue, by water cutting oils type, 2018 - 2030 (USD Million)
- Table 124 Europe metalworking fluids market volume, by end use, 2018 - 2030 (Kilotons)
- Table 125 Europe metalworking fluids market revenue, by end use, 2018 - 2030 (USD Million)
- Table 126 Europe metalworking fluids market volume, by industrial end use, 2018 - 2030 (Kilotons)
- Table 127 Europe metalworking fluids market revenue, by industrial end use, 2018 - 2030 (USD Million)
- Table 128 Germany metalworking fluids market estimates and forecasts, 2018 - 2030 (Kilotons) (USD Million)
- Table 129 Germany metalworking fluids market volume, by product, 2018 - 2030 (Kilotons)
- Table 130 Germany metalworking fluids market revenue, by product, 2018 - 2030 (USD Million)
- Table 131 Germany metalworking fluids market volume, by application, 2018 - 2030 (Kilotons)
- Table 132 Germany metalworking fluids market revenue, by application, 2018 - 2030 (USD Million)
- Table 133 Germany metalworking fluids market volume, by water cutting oils type, 2018 - 2030 (Kilotons)
- Table 134 Germany metalworking fluids market revenue, by water cutting oils type, 2018 - 2030 (USD Million)
- Table 135 Germany metalworking fluids market volume, by end use, 2018 - 2030 (Kilotons)
- Table 136 Germany. metalworking fluids market revenue, by end use, 2018 - 2030 (USD Million)
- Table 137 Germany metalworking fluids market volume, by industrial end use, 2018 - 2030 (Kilotons)
- Table 138 Germany metalworking fluids market revenue, by industrial end use, 2018 - 2030 (USD Million)
- Table 139 Russia metalworking fluids market estimates and forecasts, 2018 - 2030 (Kilotons) (USD Million)
- Table 140 Russia metalworking fluids market volume, by product, 2018 - 2030 (Kilotons)
- Table 141 Russia metalworking fluids market revenue, by product, 2018 - 2030 (USD Million)
- Table 142 Russia metalworking fluids market volume, by application, 2018 - 2030 (Kilotons)
- Table 143 Russia metalworking fluids market revenue, by application, 2018 - 2030 (USD Million)
- Table 144 Russia metalworking fluids market volume, by water cutting oils type, 2018 - 2030 (Kilotons)
- Table 145 Russia metalworking fluids market revenue, by water cutting oils type, 2018 - 2030 (USD Million)
- Table 146 Russia metalworking fluids market volume, by end use, 2018 - 2030 (Kilotons)
- Table 147 Russia metalworking fluids market revenue, by end use, 2018 - 2030 (USD Million)
- Table 148 Russia metalworking fluids market volume, by industrial end use, 2018 - 2030 (Kilotons)
- Table 149 Russia metalworking fluids market revenue, by industrial end use, 2018 - 2030 (USD Million)
- Table 150 France metalworking fluids market estimates and forecasts, 2018 - 2030 (Kilotons) (USD Million)
- Table 151 France metalworking fluids market volume, by product, 2018 - 2030 (Kilotons)
- Table 152 France metalworking fluids market revenue, by product, 2018 - 2030 (USD Million)
- Table 153 France metalworking fluids market volume, by application, 2018 - 2030 (Kilotons)
- Table 154 France metalworking fluids market revenue, by application, 2018 - 2030 (USD Million)
- Table 155 France metalworking fluids market volume, by water cutting oils type, 2018 - 2030 (Kilotons)
- Table 156 France metalworking fluids market revenue, by water cutting oils type, 2018 - 2030 (USD Million)
- Table 157 France metalworking fluids market volume, by end use, 2018 - 2030 (Kilotons)
- Table 158 France. metalworking fluids market revenue, by end use, 2018 - 2030 (USD Million)
- Table 159 France metalworking fluids market volume, by industrial end use, 2018 - 2030 (Kilotons)
- Table 160 France metalworking fluids market revenue, by industrial end use, 2018 - 2030 (USD Million)
- Table 161 Spain metalworking fluids market estimates and forecasts, 2018 - 2030 (Kilotons) (USD Million)
- Table 162 Spain metalworking fluids market volume, by product, 2018 - 2030 (Kilotons)
- Table 163 Spain metalworking fluids market revenue, by product, 2018 - 2030 (USD Million)
- Table 164 Spain metalworking fluids market volume, by application, 2018 - 2030 (Kilotons)
- Table 165 Spain metalworking fluids market revenue, by application, 2018 - 2030 (USD Million)
- Table 166 Spain metalworking fluids market volume, by water cutting oils type, 2018 - 2030 (Kilotons)
- Table 167 Spain metalworking fluids market revenue, by water cutting oils type, 2018 - 2030 (USD Million)
- Table 168 Spain metalworking fluids market volume, by end use, 2018 - 2030 (Kilotons)
- Table 169 Spain metalworking fluids market revenue, by end use, 2018 - 2030 (USD Million)
- Table 170 Spain metalworking fluids market volume, by industrial end use, 2018 - 2030 (Kilotons)
- Table 171 Spain metalworking fluids market revenue, by industrial end use, 2018 - 2030 (USD Million)
- Table 172 Italy metalworking fluids market estimates and forecasts, 2018 - 2030 (Kilotons) (USD Million)
- Table 173 Italy metalworking fluids market volume, by product, 2018 - 2030 (Kilotons)
- Table 174 Italy metalworking fluids market revenue, by product, 2018 - 2030 (USD Million)
- Table 175 Italy metalworking fluids market volume, by application, 2018 - 2030 (Kilotons)
- Table 176 Italy metalworking fluids market revenue, by application, 2018 - 2030 (USD Million)
- Table 177 Italy metalworking fluids market volume, by water cutting oils type, 2018 - 2030 (Kilotons)
- Table 178 Italy metalworking fluids market revenue, by water cutting oils type, 2018 - 2030 (USD Million)
- Table 179 Italy metalworking fluids market volume, by end use, 2018 - 2030 (Kilotons)
- Table 180 Italy. metalworking fluids market revenue, by end use, 2018 - 2030 (USD Million)
- Table 181 Italy metalworking fluids market volume, by industrial end use, 2018 - 2030 (Kilotons)
- Table 182 Italy metalworking fluids market revenue, by industrial end use, 2018 - 2030 (USD Million)
- Table 183 U.K. metalworking fluids market estimates and forecasts, 2018 - 2030 (Kilotons) (USD Million)
- Table 184 U.K. metalworking fluids market volume, by product, 2018 - 2030 (Kilotons)
- Table 185 U.K. metalworking fluids market revenue, by product, 2018 - 2030 (USD Million)
- Table 186 U.K. metalworking fluids market volume, by application, 2018 - 2030 (Kilotons)
- Table 187 U.K. metalworking fluids market revenue, by application, 2018 - 2030 (USD Million)
- Table 188 U.K. metalworking fluids market volume, by water cutting oils type, 2018 - 2030 (Kilotons)
- Table 189 U.K. metalworking fluids market revenue, by water cutting oils type, 2018 - 2030 (USD Million)
- Table 190 U.K. metalworking fluids market volume, by end use, 2018 - 2030 (Kilotons)
- Table 191 U.K.. metalworking fluids market revenue, by end use, 2018 - 2030 (USD Million)
- Table 192 U.K. metalworking fluids market volume, by industrial end use, 2018 - 2030 (Kilotons)
- Table 193 U.K. metalworking fluids market revenue, by industrial end use, 2018 - 2030 (USD Million)
- Table 194 Switzerland metalworking fluids market estimates and forecasts, 2018 - 2030 (Kilotons) (USD Million)
- Table 195 Switzerland metalworking fluids market volume, by product, 2018 - 2030 (Kilotons)
- Table 196 Switzerland metalworking fluids market revenue, by product, 2018 - 2030 (USD Million)
- Table 197 Switzerland metalworking fluids market volume, by application, 2018 - 2030 (Kilotons)
- Table 198 Switzerland metalworking fluids market revenue, by application, 2018 - 2030 (USD Million)
- Table 199 Switzerland metalworking fluids market volume, by water cutting oils type, 2018 - 2030 (Kilotons)
- Table 200 Switzerland metalworking fluids market revenue, by water cutting oils type, 2018 - 2030 (USD Million)
- Table 201 Switzerland metalworking fluids market volume, by end use, 2018 - 2030 (Kilotons)
- Table 202 Switzerland metalworking fluids market revenue, by end use, 2018 - 2030 (USD Million)
- Table 203 Switzerland metalworking fluids market volume, by industrial end use, 2018 - 2030 (Kilotons)
- Table 204 Switzerland metalworking fluids market revenue, by industrial end use, 2018 - 2030 (USD Million)
- Table 205 Denmark metalworking fluids market estimates and forecasts, 2018 - 2030 (Kilotons) (USD Million)
- Table 206 Denmark metalworking fluids market volume, by product, 2018 - 2030 (Kilotons)
- Table 207 Denmark metalworking fluids market revenue, by product, 2018 - 2030 (USD Million)
- Table 208 Denmark metalworking fluids market volume, by application, 2018 - 2030 (Kilotons)
- Table 209 Denmark metalworking fluids market revenue, by application, 2018 - 2030 (USD Million)
- Table 210 Denmark metalworking fluids market volume, by water cutting oils type, 2018 - 2030 (Kilotons)
- Table 211 Denmark metalworking fluids market revenue, by water cutting oils type, 2018 - 2030 (USD Million)
- Table 212 Denmark metalworking fluids market volume, by end use, 2018 - 2030 (Kilotons)
- Table 213 Denmark metalworking fluids market revenue, by end use, 2018 - 2030 (USD Million)
- Table 214 Denmark metalworking fluids market volume, by industrial end use, 2018 - 2030 (Kilotons)
- Table 215 Denmark metalworking fluids market revenue, by industrial end use, 2018 - 2030 (USD Million)
- Table 216 Norway metalworking fluids market estimates and forecasts, 2018 - 2030 (Kilotons) (USD Million)
- Table 217 Norway metalworking fluids market volume, by product, 2018 - 2030 (Kilotons)
- Table 218 Norway metalworking fluids market revenue, by product, 2018 - 2030 (USD Million)
- Table 219 Norway metalworking fluids market volume, by application, 2018 - 2030 (Kilotons)
- Table 220 Norway metalworking fluids market revenue, by application, 2018 - 2030 (USD Million)
- Table 221 Norway metalworking fluids market volume, by water cutting oils type, 2018 - 2030 (Kilotons)
- Table 222 Norway metalworking fluids market revenue, by water cutting oils type, 2018 - 2030 (USD Million)
- Table 223 Norway metalworking fluids market volume, by end use, 2018 - 2030 (Kilotons)
- Table 224 Norway metalworking fluids market revenue, by end use, 2018 - 2030 (USD Million)
- Table 225 Norway metalworking fluids market volume, by industrial end use, 2018 - 2030 (Kilotons)
- Table 226 Norway metalworking fluids market revenue, by industrial end use, 2018 - 2030 (USD Million)
- Table 227 Belgium metalworking fluids market estimates and forecasts, 2018 - 2030 (Kilotons) (USD Million)
- Table 228 Belgium metalworking fluids market volume, by product, 2018 - 2030 (Kilotons)
- Table 229 Belgium metalworking fluids market revenue, by product, 2018 - 2030 (USD Million)
- Table 230 Belgium metalworking fluids market volume, by application, 2018 - 2030 (Kilotons)
- Table 231 Belgium metalworking fluids market revenue, by application, 2018 - 2030 (USD Million)
- Table 232 Belgium metalworking fluids market volume, by water cutting oils type, 2018 - 2030 (Kilotons)
- Table 233 Belgium metalworking fluids market revenue, by water cutting oils type, 2018 - 2030 (USD Million)
- Table 234 Belgium metalworking fluids market volume, by end use, 2018 - 2030 (Kilotons)
- Table 235 Belgium metalworking fluids market revenue, by end use, 2018 - 2030 (USD Million)
- Table 236 Belgium metalworking fluids market volume, by industrial end use, 2018 - 2030 (Kilotons)
- Table 237 Belgium metalworking fluids market revenue, by industrial end use, 2018 - 2030 (USD Million)
- Table 238 Poland metalworking fluids market estimates and forecasts, 2018 - 2030 (Kilotons) (USD Million)
- Table 239 Poland metalworking fluids market volume, by product, 2018 - 2030 (Kilotons)
- Table 240 Poland metalworking fluids market revenue, by product, 2018 - 2030 (USD Million)
- Table 241 Poland metalworking fluids market volume, by application, 2018 - 2030 (Kilotons)
- Table 242 Poland metalworking fluids market revenue, by application, 2018 - 2030 (USD Million)
- Table 243 Poland metalworking fluids market volume, by water cutting oils type, 2018 - 2030 (Kilotons)
- Table 244 Poland metalworking fluids market revenue, by water cutting oils type, 2018 - 2030 (USD Million)
- Table 245 Poland metalworking fluids market volume, by end use, 2018 - 2030 (Kilotons)
- Table 246 Poland metalworking fluids market revenue, by end use, 2018 - 2030 (USD Million)
- Table 247 Poland metalworking fluids market volume, by industrial end use, 2018 - 2030 (Kilotons)
- Table 248 Poland metalworking fluids market revenue, by industrial end use, 2018 - 2030 (USD Million)
- Table 249 Czech Republic metalworking fluids market estimates and forecasts, 2018 - 2030 (Kilotons) (USD Million)
- Table 250 Czech Republic metalworking fluids market volume, by product, 2018 - 2030 (Kilotons)
List of Figures
- Fig. 1 Metalworking fluids market snapshot
- Fig. 2 Metalworking fluids - Market segmentation
- Fig. 3 Penetration & growth prospect mapping
- Fig. 4 Metalworking Fluids Value Chain Analysis
- Fig. 5 Metalworking fluids market dynamics
- Fig. 6 Market trends & outlook
- Fig. 7 Motor vehicle production in Europe
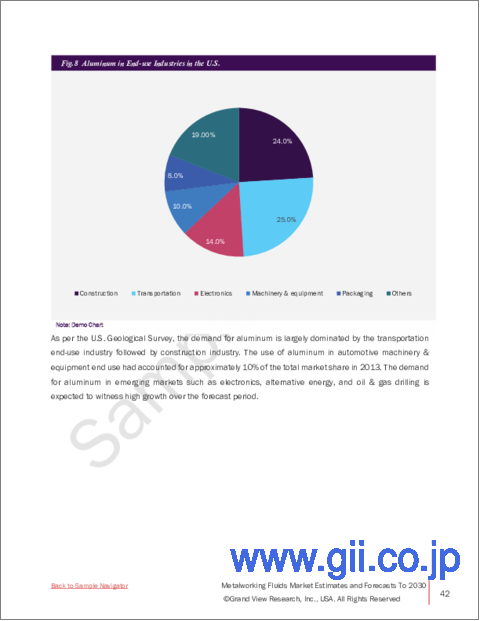
- Fig. 8 Aluminum in end-use industries in the U.S. (2013)
- Fig. 9 Asia Pacific exploration & production expenditure (USD Billion)
- Fig. 10 Global carbon composites market, by application (2015)
- Fig. 11 Metalworking fluids market Porter's analysis
- Fig. 12 PESTEL analysis
- Fig. 13 Metalworking fluids market: Product movement analysis, 2021 & 2030
- Fig. 14 Metalworking fluids market: Application movement analysis, 2021 & 2030
- Fig. 15 Metalworking fluids market: Industrial end-use movement analysis, 2021 & 2030
- Fig. 16 Metalworking fluids market: Industrial end-use movement analysis, 2021 & 2030
- Fig. 17 Regional market place: Key takeaways
- Fig. 18 Metalworking fluids market: Regional movement analysis, 2021 & 2030
- Fig. 19 Metalworking fluids market dynamics
Metalworking Fluids Market Growth & Trends:
The global metalworking fluids market size is expected to reach USD 15.1 million by 2030, as per the new report by Grand View Research, Inc., registering a CAGR of 3.8% over the forecast period. The demand is attributed to arise in demand for automotive and industrial machinery. Individual end-use sectors, such as machinery, metal fabrication, and transportation equipment, are driving the expansion of the market. The market is also expected to be driven by strong development in the machinery and transportation equipment end-use industries over the projected period. Manufacturing is one of the core industries in North America and Europe. Advances in the manufacturing methods for the production of sophisticated end-use products, coupled with the increase in the exports of construction machinery and power, agricultural, and automotive equipment, have fueled the market growth. The sector is expected to benefit from increased production of construction machines and related parts for industrial, residential, and commercial construction. The rise in public-private partnerships is expected to boost the demand for a variety of construction components that use MWFs during their production. Because of the expanding building activities in these nations, emerging economies are likely to be critical for product growth. The increasing demand for electricity and upgrading of the existing infrastructure for electricity generation, transmission, and distribution, is anticipated to fuel the market for electrical & power equipment and related components. These components are manufactured using ferrous and non-ferrous metal parts, which consume MWFs during manufacturing.
Metalworking Fluids Market Report Highlights:
- Mineral-based MWFs accounted for a revenue share of 48.1% in 2021 due to the increased consumption owing to their low cost
- Water cutting oils application is anticipated to grow at the fastest CAGR over the forecast period due to product sage in operations, such as drilling, milling grinding, and mainly in heat dissipation for the proper machining process
- The machinery segment dominated the market in 2021 due to the high demand for construction equipment and increased infrastructural development activities
- The automobile industry is anticipated to witness a significant CAGR over the forecast period due to the high demand for automobile machinery
- The growth of the construction and electrical & power equipment sectors in emerging economies is also expected to drive the product demand
- Synthetic and mineral-based products aid in better tool performance, which has led to their high demand
Table of Contents
Chapter 1 Methodology and Scope
- 1.1 Research Methodology
- 1.2 Research Scope and Assumptions
- 1.3 List to Data Sources
- 1.4 List of Abbreviations
Chapter 2 Executive Summary
- 2.1 Market Summary
Chapter 3 Metalworking Fluids: Market Variables, Trends & Scope
- 3.1 Metalworking fluids - Market segmentation
- 3.2 Penetration & growth prospect mapping
- 3.3 Metalworking fluids market value chain analysis
- 3.4 Raw material outlook
- 3.4.1 Crude oil
- 3.4.2 Base oil
- 3.5 Regulatory framework
- 3.5.1 U.S. (Occupational Safety and Health Act)
- 3.5.2 Required and recommended exposure limits
- 3.5.3 REACH
- 3.6 Technology overview
- 3.6.1 Recent developments
- 3.7 Metalworking fluids market dynamics
- 3.7.1 Market driver analysis
- 3.7.1.1 Growth of automobile industry
- 3.7.1.2 Growth of heavy machinery industry in emerging economies
- 3.7.2 Market restraints analysis
- 3.7.2.1 Threat of substitutes
- 3.7.1 Market driver analysis
- 3.8 Metalworking fluids market Porter's analysis
- 3.9 Metalworking fluids market PESTEL analysis
Chapter 4 Metalworking Fluids: Product Estimates & Trend Analysis
- 4.1 Metalworking fluids market: Product movement analysis, 2021 & 2030
- 4.2 Mineral
- 4.2.1 Global metalworking fluids market estimates and forecasts, By Mineral Type, 2018 - 2030 (Kilotons) (USD Million)
- 4.2.2 Global metalworking fluids market estimates and forecasts, by Mineral Type, By Region, 2018 - 2030 (Kilotons) (USD Million)
- 4.3 Synthetic
- 4.3.1 Global metalworking fluids market estimates and forecasts, By synthetic Type, 2018 - 2030 (Kilotons) (USD Million)
- 4.3.2 Global metalworking fluids market estimates and forecasts, by synthetic Type, By Region, 2018 - 2030 (Kilotons) (USD Million)
- 4.4 Bio-based
- 4.4.1 Global metalworking fluids market estimates and forecasts, By bio-based Type, 2018 - 2030 (Kilotons) (USD Million)
- 4.4.2 Global metalworking fluids market estimates and forecasts, by Bio-based Type, By Region, 2018 - 2030 (Kilotons) (USD Million)
Chapter 5 Metalworking Fluids: Application Estimates & Trend Analysis
- 5.1 Metalworking fluids market: Application movement analysis, 2021 & 2030
- 5.2 Neat Cutting Oils
- 5.2.1 Global metalworking fluids market estimates and forecasts, By Neat Cutting Oils, 2018 - 2030 (Kilotons) (USD Million)
- 5.2.2 Global metalworking fluids market estimates and forecasts, by Neat Cutting Oils, By Region, 2018 - 2030 (Kilotons) (USD Million)
- 5.3 Water Cutting Oils
- 5.3.1 Global metalworking fluids market estimates and forecasts, By Water Cutting Oils, 2018 - 2030 (Kilotons) (USD Million)
- 5.3.2 Global metalworking fluids market estimates and forecasts, by Water Cutting Oils, By Region, 2018 - 2030 (Kilotons) (USD Million)
- 5.3.3 Soluble Cutting Oils
- 5.3.3.1 Global metalworking fluids market estimates and forecasts, By Soluble cutting oils, 2018 - 2030 (Kilotons) (USD Million)
- 5.3.3.2 Global metalworking fluids market estimates and forecasts, by Soluble cutting oils, By Region, 2018 - 2030 (Kilotons) (USD Million)
- 5.3.4 Semi-synthetic Cutting Oils
- 5.3.4.1 Global metalworking fluids market estimates and forecasts, By Semi-synthetic cutting oils, 2018 - 2030 (Kilotons) (USD Million)
- 5.3.4.2 Global metalworking fluids market estimates and forecasts, by Semi-synthetic cutting oils, By Region, 2018 - 2030 (Kilotons) (USD Million)
- 5.3.5 Synthetic Cutting Oils
- 5.3.5.1 Global metalworking fluids market estimates and forecasts, By synthetic cutting oils, 2018 - 2030 (Kilotons) (USD Million)
- 5.3.5.2 Global metalworking fluids market estimates and forecasts, by synthetic cutting oils, By Region, 2018 - 2030 (Kilotons) (USD Million)
- 5.4 Corrosion Preventive Oils
- 5.4.1 Global metalworking fluids market estimates and forecasts, By Corrosion Preventive Oils, 2018 - 2030 (Kilotons) (USD Million)
- 5.4.2 Global metalworking fluids market estimates and forecasts, by Corrosion Preventive Oils, By Region, 2018 - 2030 (Kilotons) (USD Million)
- 5.5 Others
- 5.5.1 Global metalworking fluids market estimates and forecasts, By others, 2018 - 2030 (Kilotons) (USD Million)
- 5.5.2 Global metalworking fluids market estimates and forecasts, by others, By Region, 2018 - 2030 (Kilotons) (USD Million)
Chapter 6 Metalworking Fluids: End-use Estimates & Trend Analysis
- 6.1 Metalworking fluids market: End-use movement analysis, 2021 & 2030
- 6.2 Metal Fabrication
- 6.2.1 Global metalworking fluids market estimates and forecasts, By Metal fabrication, 2018 - 2030 (Kilotons) (USD Million)
- 6.2.2 Global metalworking fluids market estimates and forecasts, by Metal fabrication, By Region, 2018 - 2030 (Kilotons) (USD Million)
- 6.3 Transportation Equipment
- 6.3.1 Global metalworking fluids market estimates and forecasts, By Transportation equipment, 2018 - 2030 (Kilotons) (USD Million)
- 6.3.2 Global metalworking fluids market estimates and forecasts, by Transportation equipment, By Region, 2018 - 2030 (Kilotons) (USD Million)
- 6.4 Machinery
- 6.4.1 Global metalworking fluids market estimates and forecasts, By Machinery, 2018 - 2030 (Kilotons) (USD Million)
- 6.4.2 Global metalworking fluids market estimates and forecasts, by Machinery, By Region, 2018 - 2030 (Kilotons) (USD Million)
- 6.5 Others
- 6.5.1 Global metalworking fluids market estimates and forecasts, By others, 2018 - 2030 (Kilotons) (USD Million)
- 6.5.2 Global metalworking fluids market estimates and forecasts, by others, By Region, 2018 - 2030 (Kilotons) (USD Million)
Chapter 7 Metalworking Fluids: Industrial End-use Estimates & Trend Analysis
- 7.1 Metalworking fluids market: Industrial end-use movement analysis, 2021 & 2030
- 7.2 Construction
- 7.2.1 Global metalworking fluids market estimates and forecasts, By construction, 2018 - 2030 (Kilotons) (USD Million)
- 7.2.2 Global metalworking fluids market estimates and forecasts, by construction, By Region, 2018 - 2030 (Kilotons) (USD Million)
- 7.3 Electrical & Power
- 7.3.1 Global metalworking fluids market estimates and forecasts, By Electrical & Power Type, 2018 - 2030 (Kilotons) (USD Million)
- 7.3.2 Global metalworking fluids market estimates and forecasts, by Electrical & Power, By Region, 2018 - 2030 (Kilotons) (USD Million)
- 7.4 Agriculture
- 7.4.1 Global metalworking fluids market estimates and forecasts, By Agriculture, 2018 - 2030 (Kilotons) (USD Million)
- 7.4.2 Global metalworking fluids market estimates and forecasts, by Agriculture, By Region, 2018 - 2030 (Kilotons) (USD Million)
- 7.5 Automobile
- 7.5.1 Global metalworking fluids market estimates and forecasts, By Automobile, 2018 - 2030 (Kilotons) (USD Million)
- 7.5.2 Global metalworking fluids market estimates and forecasts, by Automobile, By Region, 2018 - 2030 (Kilotons) (USD Million)
- 7.6 Aerospace
- 7.6.1 Global metalworking fluids market estimates and forecasts, By Aerospace Type, 2018 - 2030 (Kilotons) (USD Million)
- 7.6.2 Global metalworking fluids market estimates and forecasts, by Aerospace, By Region, 2018 - 2030 (Kilotons) (USD Million)
- 7.7 Rail
- 7.7.1 Global metalworking fluids market estimates and forecasts, By Rail, 2018 - 2030 (Kilotons) (USD Million)
- 7.7.2 Global metalworking fluids market estimates and forecasts, by Rail, By Region, 2018 - 2030 (Kilotons) (USD Million)
- 7.8 Marine
- 7.8.1 Global metalworking fluids market estimates and forecasts, By Marine, 2018 - 2030 (Kilotons) (USD Million)
- 7.8.2 Global metalworking fluids market estimates and forecasts, by Marine, By Region, 2018 - 2030 (Kilotons) (USD Million)
- 7.9 Telecommunication
- 7.9.1 Global metalworking fluids market estimates and forecasts, By Telecommunication Type, 2018 - 2030 (Kilotons) (USD Million)
- 7.9.2 Global metalworking fluids market estimates and forecasts, by Telecommunication, By Region, 2018 - 2030 (Kilotons) (USD Million)
- 7.10 Healthcare
- 7.10.1 Global metalworking fluids market estimates and forecasts, By Healthcare, 2018 - 2030 (Kilotons) (USD Million)
- 7.10.2 Global metalworking fluids market estimates and forecasts, by Healthcare, By Region, 2018 - 2030 (Kilotons) (USD Million)
Chapter 8 Metalworking Fluids: Regional Estimates & Trend Analysis
- 8.1 Global metalworking fluids market revenue share, by region, 2021 & 2030
- 8.2 North America
- 8.2.1 North America metalworking fluids market estimates and forecasts, 2018 - 2030 (Kilotons) (USD Million)
- 8.2.2 North America metalworking fluids market estimates and forecasts, by product, 2018 - 2030 (Kilotons) (USD Million)
- 8.2.3 North America metalworking fluids market estimates and forecasts, by application, 2018 - 2030 (Kilotons) (USD Million)
- 8.2.3.1 North America metalworking fluids market estimates and forecasts, by water cutting oils type, 2018 - 2030 (Kilotons) (USD Million)
- 8.2.4 North America metalworking fluids market estimates and forecasts, by end use, 2018 - 2030 (Kilotons) (USD Million)
- 8.2.5 North America metalworking fluids market estimates and forecasts, by industrial end use, 2018 - 2030 (Kilotons) (USD Million)
- 8.2.6 U.S.
- 8.2.6.1 U.S. metalworking fluids market estimates and forecasts, 2018 - 2030 (Kilotons) (USD Million)
- 8.2.6.2 U.S. metalworking fluids market estimates and forecasts, by product, 2018 - 2030 (Kilotons) (USD Million)
- 8.2.6.3 U.S. metalworking fluids market estimates and forecasts, by application, 2018 - 2030 (Kilotons) (USD Million)
- 8.2.6.4 U.S. metalworking fluids market estimates and forecasts, by water cutting oils type, 2018 - 2030 (Kilotons) (USD Million)
- 8.2.6.5 U.S. metalworking fluids market estimates and forecasts, by end use, 2018 - 2030 (Kilotons) (USD Million)
- 8.2.6.6 U.S. metalworking fluids market estimates and forecast, by industrial end use, 2018 - 2030 (Kilotons) (USD Million)
- 8.2.7 Canada
- 8.2.7.1 canada metalworking fluids market estimates and forecasts, 2018 - 2030 (Kilotons) (USD Million)
- 8.2.7.2 canada metalworking fluids market estimates and forecasts, by product, 2018 - 2030 (Kilotons) (USD Million)
- 8.2.7.3 canada metalworking fluids market estimates and forecasts, by application, 2018 - 2030 (Kilotons) (USD Million)
- 8.2.7.4 canada metalworking fluids market estimates and forecasts, by water cutting oils type, 2018 - 2030 (Kilotons) (USD Million)
- 8.2.7.5 canada metalworking fluids market estimates and forecasts, by end use, 2018 - 2030 (Kilotons) (USD Million)
- 8.2.7.6 Canada metalworking fluids market estimates and forecasts, by industrial end use, 2018 - 2030 (Kilotons) (USD Million)
- 8.2.8 Mexico
- 8.2.8.1 Mexico metalworking fluids market estimates and forecasts, 2018 - 2030 (Kilotons) (USD Million)
- 8.2.8.2 Mexico metalworking fluids market estimates and forecasts, by product, 2018 - 2030 (Kilotons) (USD Million)
- 8.2.8.3 Mexico metalworking fluids market estimates and forecasts, by application, 2018 - 2030 (Kilotons) (USD Million)
- 8.2.8.4 Mexico metalworking fluids market estimates and forecasts, by water cutting oils type, 2018 - 2030 (Kilotons) (USD Million)
- 8.2.8.5 Mexico metalworking fluids market estimates and forecasts, by end use, 2018 - 2030 (Kilotons) (USD Million)
- 8.2.8.6 Mexico metalworking fluids market estimates and forecasts, by industrial end use, 2018 - 2030 (Kilotons) (USD Million)
- 8.2.9 Europe
- 8.2.9.1 Europe metalworking fluids market estimates and forecasts, 2018 - 2030 (Kilotons) (USD Million)
- 8.2.9.2 Europe metalworking fluids market estimates and forecasts, by product, 2018 - 2030 (Kilotons) (USD Million)
- 8.2.9.3 Europe metalworking fluids market estimates and forecasts, by application, 2018 - 2030 (Kilotons) (USD Million)
- 8.2.9.4 Europe metalworking fluids market estimates and forecasts, by water cutting oils type, 2018 - 2030 (Kilotons) (USD Million)
- 8.2.9.5 Europe metalworking fluids market estimates and forecasts, by end use, 2018 - 2030 (Kilotons) (USD Million)
- 8.2.9.6 Europe metalworking fluids market estimates and forecasts, by industrial end use, 2018 - 2030 (Kilotons) (USD Million)
- 8.2.10 Germany
- 8.2.10.1 Germany metalworking fluids market estimates and forecasts, 2018 - 2030 (Kilotons) (USD Million)
- 8.2.10.2 Germany metalworking fluids market estimates and forecasts, by product, 2018 - 2030 (Kilotons) (USD Million)
- 8.2.10.3 Germany metalworking fluids market estimates and forecasts, by application, 2018 - 2030 (Kilotons) (USD Million)
- 8.2.10.4 Germany metalworking fluids market estimates and forecasts, by water cutting oils type, 2018 - 2030 (Kilotons) (USD Million)
- 8.2.10.5 Germany metalworking fluids market estimates and forecasts, by end use, 2018 - 2030 (Kilotons) (USD Million)
- 8.2.10.6 Germany metalworking fluids market estimates and forecasts, by industrial end use, 2018 - 2030 (Kilotons) (USD Million)
- 8.2.11 Russia
- 8.2.11.1 Russia metalworking fluids market estimates and forecasts, 2018 - 2030 (Kilotons) (USD Million)
- 8.2.11.2 Russia metalworking fluids market estimates and forecasts, by product, 2018 - 2030 (Kilotons) (USD Million)
- 8.2.11.3 Russia metalworking fluids market estimates and forecasts, by application, 2018 - 2030 (Kilotons) (USD Million)
- 8.2.11.4 Russia metalworking fluids market estimates and forecasts, by water cutting oils type, 2018 - 2030 (Kilotons) (USD Million)
- 8.2.11.5 Russia metalworking fluids market estimates and forecasts, by end use, 2018 - 2030 (Kilotons) (USD Million)
- 8.2.11.6 Russia metalworking fluids market estimates and forecasts, by industrial end use, 2018 - 2030 (Kilotons) (USD Million)
- 8.2.12 France
- 8.2.12.1 France metalworking fluids market estimates and forecasts, 2018 - 2030 (Kilotons) (USD Million)
- 8.2.12.2 France metalworking fluids market estimates and forecasts, by product, 2018 - 2030 (Kilotons) (USD Million)
- 8.2.12.3 France metalworking fluids market estimates and forecasts, by application, 2018 - 2030 (Kilotons) (USD Million)
- 8.2.12.4 France metalworking fluids market estimates and forecasts, by water cutting oils type, 2018 - 2030 (Kilotons) (USD Million)
- 8.2.12.5 France metalworking fluids market estimates and forecasts, by end use, 2018 - 2030 (Kilotons) (USD Million)
- 8.2.12.6 France metalworking fluids market estimates and forecasts, by industrial end use, 2018 - 2030 (Kilotons) (USD Million)
- 8.2.13 Spain
- 8.2.13.1 Spain metalworking fluids market estimates and forecasts, 2018 - 2030 (Kilotons) (USD Million)
- 8.2.13.2 Spain metalworking fluids market estimates and forecasts, by product, 2018 - 2030 (Kilotons) (USD Million)
- 8.2.13.3 Spain metalworking fluids market estimates and forecasts, by application, 2018 - 2030 (Kilotons) (USD Million)
- 8.2.13.4 Spain metalworking fluids market estimates and forecasts, by water cutting oils type, 2018 - 2030 (Kilotons) (USD Million)
- 8.2.13.5 Spain metalworking fluids market estimates and forecasts, by end use, 2018 - 2030 (Kilotons) (USD Million)
- 8.2.13.6 Spain metalworking fluids market estimates and forecasts, by industrial end use, 2018 - 2030 (Kilotons) (USD Million)
- 8.2.14 Italy
- 8.2.14.1 Italy metalworking fluids market estimates and forecasts, 2018 - 2030 (Kilotons) (USD Million)
- 8.2.14.2 Italy metalworking fluids market estimates and forecasts, by product, 2018 - 2030 (Kilotons) (USD Million)
- 8.2.14.3 Italy metalworking fluids market estimates and forecasts, by application, 2018 - 2030 (Kilotons) (USD Million)
- 8.2.14.4 Italy metalworking fluids market estimates and forecasts, by water cutting oils type, 2018 - 2030 (Kilotons) (USD Million)
- 8.2.14.5 Italy metalworking fluids market estimates and forecasts, by end use, 2018 - 2030 (Kilotons) (USD Million)
- 8.2.14.6 Italy metalworking fluids market estimates and forecasts, by industrial end use, 2018 - 2030 (Kilotons) (USD Million)
- 8.2.15 U.K.
- 8.2.15.1 U.K. metalworking fluids market estimates and forecasts, 2018 - 2030 (Kilotons) (USD Million)
- 8.2.15.2 U.K. metalworking fluids market estimates and forecasts, by product, 2018 - 2030 (Kilotons) (USD Million)
- 8.2.15.3 U.K. metalworking fluids market estimates and forecasts, by application, 2018 - 2030 (Kilotons) (USD Million)
- 8.2.15.4 U.K. metalworking fluids market estimates and forecasts, by water cutting oils type, 2018 - 2030 (Kilotons) (USD Million)
- 8.2.15.5 U.K. metalworking fluids market estimates and forecasts, by end use, 2018 - 2030 (Kilotons) (USD Million)
- 8.2.15.6 U.K. metalworking fluids market estimates and forecasts, by industrial end use, 2018 - 2030 (Kilotons) (USD Million)
- 8.2.16 Switzerland
- 8.2.16.1 Switzerland metalworking fluids market estimates and forecasts, 2018 - 2030 (Kilotons) (USD Million)
- 8.2.16.2 Switzerland metalworking fluids market estimates and forecasts, by product, 2018 - 2030 (Kilotons) (USD Million)
- 8.2.16.3 Switzerland metalworking fluids market estimates and forecasts, by application, 2018 - 2030 (Kilotons) (USD Million)
- 8.2.16.4 Switzerland metalworking fluids market estimates and forecasts, by water cutting oils type, 2018 - 2030 (Kilotons) (USD Million)
- 8.2.16.5 Switzerland metalworking fluids market estimates and forecasts, by end use, 2018 - 2030 (Kilotons) (USD Million)
- 8.2.16.6 SwitzerlanD metalworking fluids market estimates and forecasts, by industrial end use, 2018 - 2030 (Kilotons) (USD Million)
- 8.2.17 Denmark
- 8.2.17.1 Denmark metalworking fluids market estimates and forecasts, 2018 - 2030 (Kilotons) (USD Million)
- 8.2.17.2 Denmark metalworking fluids market estimates and forecasts, by product, 2018 - 2030 (Kilotons) (USD Million)
- 8.2.17.3 Denmark metalworking fluids market estimates and forecasts, by application, 2018 - 2030 (Kilotons) (USD Million)
- 8.2.17.4 Denmark metalworking fluids market estimates and forecasts, by water cutting oils type, 2018 - 2030 (Kilotons) (USD Million)
- 8.2.17.5 Denmark metalworking fluids market estimates and forecasts, by end use, 2018 - 2030 (Kilotons) (USD Million)
- 8.2.17.6 Denmark metalworking fluids market estimates and forecasts, by industrial end use, 2018 - 2030 (Kilotons) (USD Million)
- 8.2.18 Norway
- 8.2.18.1 NORWAY metalworking fluids market estimates and forecasts, 2018 - 2030 (Kilotons) (USD Million)
- 8.2.18.2 Norway metalworking fluids market estimates and forecasts, by product, 2018 - 2030 (Kilotons) (USD Million)
- 8.2.18.3 Norway metalworking fluids market estimates and forecasts, by application, 2018 - 2030 (Kilotons) (USD Million)
- 8.2.18.4 Norway metalworking fluids market estimates and forecasts, by water cutting oils type, 2018 - 2030 (Kilotons) (USD Million)
- 8.2.18.5 Norway metalworking fluids market estimates and forecasts, by end use, 2018 - 2030 (Kilotons) (USD Million)
- 8.2.18.6 Norway metalworking fluids market estimates and forecasts, by industrial end use, 2018 - 2030 (Kilotons) (USD Million)
- 8.2.19 Belgium
- 8.2.19.1 Belgium metalworking fluids market estimates and forecasts, 2018 - 2030 (Kilotons) (USD Million)
- 8.2.19.2 Belgium metalworking fluids market estimates and forecasts, by product, 2018 - 2030 (Kilotons) (USD Million)
- 8.2.19.3 Belgium metalworking fluids market estimates and forecasts, by application, 2018 - 2030 (Kilotons) (USD Million)
- 8.2.19.4 Belgium metalworking fluids market estimates and forecasts, by water cutting oils type, 2018 - 2030 (Kilotons) (USD Million)
- 8.2.19.5 BelgiuM metalworking fluids market estimates and forecasts, by end use, 2018 - 2030 (Kilotons) (USD Million)
- 8.2.19.6 Belgium metalworking fluids market estimates and forecasts, by industrial end use, 2018 - 2030 (Kilotons) (USD Million)
- 8.2.20 Poland
- 8.2.20.1 Poland metalworking fluids market estimates and forecasts, 2018 - 2030 (Kilotons) (USD Million)
- 8.2.20.2 Poland metalworking fluids market estimates and forecasts, by product, 2018 - 2030 (Kilotons) (USD Million)
- 8.2.20.3 Poland metalworking fluids market estimates and forecasts, by application, 2018 - 2030 (Kilotons) (USD Million)
- 8.2.20.4 Poland metalworking fluids market estimates and forecasts, by water cutting oils type, 2018 - 2030 (Kilotons) (USD Million)
- 8.2.20.5 Poland metalworking fluids market estimates and forecasts, by end use, 2018 - 2030 (Kilotons) (USD Million)
- 8.2.20.6 Poland metalworking fluids market estimates and forecasts, by industrial end use, 2018 - 2030 (Kilotons) (USD Million)
- 8.2.21 Czech Republic
- 8.2.21.1 Czech Republic metalworking fluids market estimates and forecasts, 2018 - 2030 (Kilotons) (USD Million)
- 8.2.21.2 Czech Republic metalworking fluids market estimates and forecasts, by product, 2018 - 2030 (Kilotons) (USD Million)
- 8.2.21.3 Czech Republic metalworking fluids market estimates and forecasts, by application, 2018 - 2030 (Kilotons) (USD Million)
- 8.2.21.4 Czech Republic metalworking fluids market estimates and forecasts, by water cutting oils type, 2018 - 2030 (Kilotons) (USD Million)
- 8.2.21.5 Czech Republic metalworking fluids market estimates and forecasts, by end use, 2018 - 2030 (Kilotons) (USD Million)
- 8.2.21.6 Czech Republic metalworking fluids market estimates and forecasts, by industrial end use, 2018 - 2030 (Kilotons) (USD Million)
- 8.2.22 Turkey
- 8.2.22.1 Turkey metalworking fluids market estimates and forecasts, 2018 - 2030 (Kilotons) (USD Million)
- 8.2.22.2 Turkey metalworking fluids market estimates and forecasts, by product, 2018 - 2030 (Kilotons) (USD Million)
- 8.2.22.3 Turkey metalworking fluids market estimates and forecasts, by application, 2018 - 2030 (Kilotons) (USD Million)
- 8.2.22.4 Turkey metalworking fluids market estimates and forecasts, by water cutting oils type, 2018 - 2030 (Kilotons) (USD Million)
- 8.2.22.5 Turkey metalworking fluids market estimates and forecasts, by end use, 2018 - 2030 (Kilotons) (USD Million)
- 8.2.22.6 Turkey metalworking fluids market estimates and forecasts, by industrial end use, 2018 - 2030 (Kilotons) (USD Million)
- 8.2.23 Sweden
- 8.2.23.1 Sweden metalworking fluids market estimates and forecasts, 2018 - 2030 (Kilotons) (USD Million)
- 8.2.23.2 Sweden metalworking fluids market estimates and forecasts, by product, 2018 - 2030 (Kilotons) (USD Million)
- 8.2.23.3 Sweden metalworking fluids market estimates and forecasts, by application, 2018 - 2030 (Kilotons) (USD Million)
- 8.2.23.4 Sweden metalworking fluids market estimates and forecasts, by water cutting oils type, 2018 - 2030 (Kilotons) (USD Million)
- 8.2.23.5 Sweden metalworking fluids market estimates and forecasts, by end use, 2018 - 2030 (Kilotons) (USD Million)
- 8.2.23.6 Sweden metalworking fluids market estimates and forecasts, by industrial end use, 2018 - 2030 (Kilotons) (USD Million)
- 8.2.24 Finland
- 8.2.24.1 Finland metalworking fluids market estimates and forecasts, 2018 - 2030 (Kilotons) (USD Million)
- 8.2.24.2 Finland metalworking fluids market estimates and forecasts, by product, 2018 - 2030 (Kilotons) (USD Million)
- 8.2.24.3 Finland metalworking fluids market estimates and forecasts, by application, 2018 - 2030 (Kilotons) (USD Million)
- 8.2.24.4 Finland metalworking fluids market estimates and forecasts, by water cutting oils type, 2018 - 2030 (Kilotons) (USD Million)
- 8.2.24.5 Finland metalworking fluids market estimates and forecasts, by end use, 2018 - 2030 (Kilotons) (USD Million)
- 8.2.24.6 Finland metalworking fluids market estimates and forecasts, by industrial end use, 2018 - 2030 (Kilotons) (USD Million)
- 8.2.25 Asia Pacific
- 8.2.25.1 Asia Pacific metalworking fluids market estimates and forecasts, 2018 - 2030 (Kilotons) (USD Million)
- 8.2.25.2 Asia Pacific metalworking fluids market estimates and forecasts, by product, 2018 - 2030 (Kilotons) (USD Million)
- 8.2.25.3 Asia PacifiC metalworking fluids market estimates and forecasts, by application, 2018 - 2030 (Kilotons) (USD Million)
- 8.2.25.4 Asia Pacific metalworking fluids market estimates and forecasts, by water cutting oils type, 2018 - 2030 (Kilotons) (USD Million)
- 8.2.25.5 Asia Pacific metalworking fluids market estimates and forecasts, by end use, 2018 - 2030 (Kilotons) (USD Million)
- 8.2.25.6 Asia Pacific metalworking fluids market estimates and forecasts, by industrial end use, 2018 - 2030 (Kilotons) (USD Million)
- 8.2.26 China
- 8.2.26.1 China metalworking fluids market estimates and forecasts, 2018 - 2030 (Kilotons) (USD Million)
- 8.2.26.2 China metalworking fluids market estimates and forecasts, by product, 2018 - 2030 (Kilotons) (USD Million)
- 8.2.26.3 China metalworking fluids market estimates and forecasts, by application, 2018 - 2030 (Kilotons) (USD Million)
- 8.2.26.4 China metalworking fluids market estimates and forecasts, by water cutting oils type, 2018 - 2030 (Kilotons) (USD Million)
- 8.2.26.5 China metalworking fluids market estimates and forecasts, by end use, 2018 - 2030 (Kilotons) (USD Million)
- 8.2.26.6 China metalworking fluids market estimates and forecasts, by industrial end use, 2018 - 2030 (Kilotons) (USD Million)
- 8.2.27 India
- 8.2.27.1 India metalworking fluids market estimates and forecasts, 2018 - 2030 (Kilotons) (USD Million)
- 8.2.27.2 India metalworking fluids market estimates and forecasts, by product, 2018 - 2030 (Kilotons) (USD Million)
- 8.2.27.3 India metalworking fluids market estimates and forecasts, by application, 2018 - 2030 (Kilotons) (USD Million)
- 8.2.27.4 India metalworking fluids market estimates and forecasts, by water cutting oils type, 2018 - 2030 (Kilotons) (USD Million)
- 8.2.27.5 India metalworking fluids market estimates and forecasts, by end use, 2018 - 2030 (Kilotons) (USD Million)
- 8.2.27.6 India metalworking fluids market estimates and forecasts, by industrial end use, 2018 - 2030 (Kilotons) (USD Million)
- 8.2.28 Japan
- 8.2.28.1 Japan metalworking fluids market estimates and forecasts, 2018 - 2030 (Kilotons) (USD Million)
- 8.2.28.2 Japan metalworking fluids market estimates and forecasts, by product, 2018 - 2030 (Kilotons) (USD Million)
- 8.2.28.3 Japan metalworking fluids market estimates and forecasts, by application, 2018 - 2030 (Kilotons) (USD Million)
- 8.2.28.4 Japan metalworking fluids market estimates and forecasts, by water cutting oils type, 2018 - 2030 (Kilotons) (USD Million)
- 8.2.28.5 Japan metalworking fluids market estimates and forecasts, by end use, 2018 - 2030 (Kilotons) (USD Million)
- 8.2.28.6 Japan metalworking fluids market estimates and forecasts, by industrial end use, 2018 - 2030 (Kilotons) (USD Million)
- 8.2.29 South Korea
- 8.2.29.1 South Korea metalworking fluids market estimates and forecasts, 2018 - 2030 (Kilotons) (USD Million)
- 8.2.29.2 South Korea metalworking fluids market estimates and forecasts, by product, 2018 - 2030 (Kilotons) (USD Million)
- 8.2.29.3 South Korea metalworking fluids market estimates and forecasts, by application, 2018 - 2030 (Kilotons) (USD Million)
- 8.2.29.4 South Korea metalworking fluids market estimates and forecasts, by water cutting oils type, 2018 - 2030 (Kilotons) (USD Million)
- 8.2.29.5 South Korea metalworking fluids market estimates and forecasts, by end use, 2018 - 2030 (Kilotons) (USD Million)
- 8.2.29.6 South Korea metalworking fluids market estimates and forecasts, by industrial end use, 2018 - 2030 (Kilotons) (USD Million)
- 8.2.30 Singapore
- 8.2.30.1 Singapore metalworking fluids market estimates and forecasts, 2018 - 2030 (Kilotons) (USD Million)
- 8.2.30.2 Singapore metalworking fluids market estimates and forecasts, by product, 2018 - 2030 (Kilotons) (USD Million)
- 8.2.30.3 Singapore metalworking fluids market estimates and forecasts, by application, 2018 - 2030 (Kilotons) (USD Million)
- 8.2.30.4 Singapore metalworking fluids market estimates and forecasts, by water cutting oils type, 2018 - 2030 (Kilotons) (USD Million)
- 8.2.30.5 Singapore metalworking fluids market estimates and forecasts, by end use, 2018 - 2030 (Kilotons) (USD Million)
- 8.2.30.6 Singapore metalworking fluids market estimates and forecasts, by industrial end use, 2018 - 2030 (Kilotons) (USD Million)
- 8.2.31 Malaysia
- 8.2.31.1 MALAYSIA metalworking fluids market estimates and forecasts, 2018 - 2030 (Kilotons) (USD Million)
- 8.2.31.2 MALAYSIA metalworking fluids market estimates and forecasts, by product, 2018 - 2030 (Kilotons) (USD Million)
- 8.2.31.3 MALAYSIA metalworking fluids market estimates and forecasts, by application, 2018 - 2030 (Kilotons) (USD Million)
- 8.2.31.4 MALAYSIA metalworking fluids market estimates and forecasts, by water cutting oils type, 2018 - 2030 (Kilotons) (USD Million)
- 8.2.31.5 MALAYSIA metalworking fluids market estimates and forecasts, by end use, 2018 - 2030 (Kilotons) (USD Million)
- 8.2.31.6 MALAYSIA metalworking fluids market estimates and forecasts, by industrial end use, 2018 - 2030 (Kilotons) (USD Million)
- 8.2.32 Thailand
- 8.2.32.1 Thailand metalworking fluids market estimates and forecasts, 2018 - 2030 (Kilotons) (USD Million)
- 8.2.32.2 Thailand metalworking fluids market estimates and forecasts, by product, 2018 - 2030 (Kilotons) (USD Million)
- 8.2.32.3 Thailand metalworking fluids market estimates and forecasts, by application, 2018 - 2030 (Kilotons) (USD Million)
- 8.2.32.4 Thailand metalworking fluids market estimates and forecasts, by water cutting oils type, 2018 - 2030 (Kilotons) (USD Million)
- 8.2.32.5 Thailand metalworking fluids market estimates and forecasts, by end use, 2018 - 2030 (Kilotons) (USD Million)
- 8.2.32.6 Thailand metalworking fluids market estimates and forecasts, by industrial end use, 2018 - 2030 (Kilotons) (USD Million)
- 8.2.33 Australia
- 8.2.33.1 Australia metalworking fluids market estimates and forecasts, 2018 - 2030 (Kilotons) (USD Million)
- 8.2.33.2 Australia metalworking fluids market estimates and forecasts, by product, 2018 - 2030 (Kilotons) (USD Million)
- 8.2.33.3 Australia metalworking fluids market estimates and forecasts, by application, 2018 - 2030 (Kilotons) (USD Million)
- 8.2.33.4 Australia metalworking fluids market estimates and forecasts, by water cutting oils type, 2018 - 2030 (Kilotons) (USD Million)
- 8.2.33.5 Australia metalworking fluids market estimates and forecasts, by end use, 2018 - 2030 (Kilotons) (USD Million)
- 8.2.33.6 Australia metalworking fluids market estimates and forecasts, by industrial end use, 2018 - 2030 (Kilotons) (USD Million)
- 8.2.34 New Zealand
- 8.2.34.1 New Zealand metalworking fluids market estimates and forecasts, 2018 - 2030 (Kilotons) (USD Million)
- 8.2.34.2 New Zealand metalworking fluids market estimates and forecasts, by product, 2018 - 2030 (Kilotons) (USD Million)
- 8.2.34.3 New Zealand metalworking fluids market estimates and forecasts, by application, 2018 - 2030 (Kilotons) (USD Million)
- 8.2.34.4 New Zealand metalworking fluids market estimates and forecasts, by water cutting oils type, 2018 - 2030 (Kilotons) (USD Million)
- 8.2.34.5 New Zealand metalworking fluids market estimates and forecasts, by end use, 2018 - 2030 (Kilotons) (USD Million)
- 8.2.34.6 New Zealand metalworking fluids market estimates and forecasts, by industrial end use, 2018 - 2030 (Kilotons) (USD Million)
- 8.3 Central & South America
- 8.3.1 Central & South America metalworking fluids market estimates and forecasts, 2018 - 2030 (Kilotons) (USD Million)
- 8.3.2 Central & South America metalworking fluids market estimates and forecasts, by product, 2018 - 2030 (Kilotons) (USD Million)
- 8.3.3 Central & South America metalworking fluids market estimates and forecasts, by application, 2018 - 2030 (Kilotons) (USD Million)
- 8.3.3.1 Central & South America metalworking fluids market estimates and forecasts, by water cutting oils type, 2018 - 2030 (Kilotons) (USD Million)
- 8.3.4 Central & South America metalworking fluids market estimates and forecasts, by end use, 2018 - 2030 (Kilotons) (USD Million)
- 8.3.5 Central & South America metalworking fluids market estimates and forecasts, by industrial end use, 2018 - 2030 (Kilotons) (USD Million)
- 8.3.6 Brazil
- 8.3.6.1 Brazil metalworking fluids market estimates and forecasts, 2018 - 2030 (Kilotons) (USD Million)
- 8.3.6.2 Brazil metalworking fluids market estimates and forecasts, by product, 2018 - 2030 (Kilotons) (USD Million)
- 8.3.6.3 Brazil metalworking fluids market estimates and forecasts, by application, 2018 - 2030 (Kilotons) (USD Million)
- 8.3.6.4 Brazil metalworking fluids market estimates and forecasts, by water cutting oils type, 2018 - 2030 (Kilotons) (USD Million)
- 8.3.6.5 Brazil metalworking fluids market estimates and forecasts, by end use, 2018 - 2030 (Kilotons) (USD Million)
- 8.3.6.6 Brazil metalworking fluids market estimates and forecast, by industrial end use, 2018 - 2030 (Kilotons) (USD Million)
- 8.3.7 MIDDLE EAST & AFRICA
- 8.3.7.1 Middle East & Africa metalworking fluids market estimates and forecasts, 2018 - 2030 (Kilotons) (USD Million)
- 8.3.7.2 Middle East & Africa metalworking fluids market estimates and forecasts, by product, 2018 - 2030 (Kilotons) (USD Million)
- 8.3.7.3 Middle East & Africa metalworking fluids market estimates and forecasts, by application, 2018 - 2030 (Kilotons) (USD Million)
- 8.3.7.4 Middle East & Africa metalworking fluids market estimates and forecasts, by water cutting oils type, 2018 - 2030 (Kilotons) (USD Million)
- 8.3.7.5 Middle East & Africa metalworking fluids market estimates and forecasts, by end use, 2018 - 2030 (Kilotons) (USD Million)
- 8.3.7.6 Middle East & Africa metalworking fluids market estimates and forecasts, by industrial end use, 2018 - 2030 (Kilotons) (USD Million)
Chapter 9 Competitive Landscape
- 9.1 Vendor landscape
- 9.2 Competitive environment
- 9.3 Company market positioning
- 9.4 Strategy Framework
- 9.5 Company Market Rankings
- 9.5.1 North America company market ranking, 2018
- 9.5.2 Europe company market ranking, 2018
- 9.5.3 Asia Pacific company market ranking, 2018
- 9.5.4 Central & South America company market ranking, 2018
- 9.5.5 Middle East & Africa company market ranking, 2018
Chapter 10 Metalworking Fluids: Manufacturers Company Profiles
- 10.1 Houghton International, Inc.
- 10.1.1 Company overview
- 10.1.2 Financial performance
- 10.1.3 Product benchmarking
- 10.1.4 Strategic initiative
- 10.2 Blaser Swisslube AG
- 10.2.1 Company overview
- 10.2.2 Financial performance
- 10.2.3 Product benchmarking
- 10.3 BP p.l.c
- 10.3.1 Company overview
- 10.3.2 Financial performance
- 10.3.3 Product benchmarking
- 10.3.4 Strategic initiative
- 10.4 Exxon Mobil Corporation
- 10.4.1 Company overview
- 10.4.2 Financial performance
- 10.4.3 Product benchmarking
- 10.5 Total S.A.
- 10.5.1 Company overview
- 10.5.2 Financial performance
- 10.5.3 Product benchmarking
- 10.6 FUCHS
- 10.6.1 Company overview
- 10.6.2 Financial performance
- 10.6.3 Product benchmarking
- 10.6.4 Strategic initiatives
- 10.7 CIMCOOL Fluid Technology, LLC
- 10.7.1 Company overview
- 10.7.2 Financial performance
- 10.7.3 Product benchmarking
- 10.7.4 Strategic initiatives
- 10.8 Quaker Chemical Corporation
- 10.8.1 Company overview
- 10.8.2 Financial performance
- 10.8.3 Product benchmarking
- 10.8.4 Strategic initiative
- 10.9 Eni S.p.A.
- 10.9.1 Company overview
- 10.9.2 Financial performance
- 10.9.3 Product benchmarking
- 10.10 Chevron Corporation
- 10.10.1 Company overview
- 10.10.2 Financial performance
- 10.10.3 Product benchmarking
- 10.11 Henkel AG & Co., KGaA
- 10.11.1 Company overview
- 10.11.2 Financial performance
- 10.11.3 Product benchmarking
- 10.12 Croda International Plc
- 10.12.1 Company overview
- 10.12.2 Financial performance
- 10.12.3 Product benchmarking
- 10.13 Tide Water Oil Co. (India) Ltd.
- 10.13.1 Company overview
- 10.13.2 Financial performance
- 10.13.3 Product benchmarking
- 10.14 Motul
- 10.14.1 Company overview
- 10.14.2 Financial performance
- 10.14.3 Product benchmarking
- 10.15 China Petroleum & Chemical Corporation
- 10.15.1 Company overview
- 10.15.2 Financial performance
- 10.15.3 Product benchmarking
- 10.16 Kuwait Petroleum Corporation
- 10.16.1 Company overview
- 10.16.2 Financial performance
- 10.16.3 Product benchmarking
- 10.16.4 Strategic initiative
- 10.17 Oelheld GmbH
- 10.17.1 Company overview
- 10.17.2 Financial performance
- 10.17.3 Product benchmarking
- 10.17.4 Strategic initiative
- 10.18 Apar Industries Ltd.
- 10.18.1 Company overview
- 10.18.2 Financial performance
- 10.18.3 Product benchmarking
- 10.19 MORESCO Corporation
- 10.19.1 Company overview
- 10.19.2 Financial performance
- 10.19.3 Product benchmarking
- 10.20 Indian Oil Corporation Ltd
- 10.20.1 Company overview
- 10.20.2 Financial performance
- 10.20.3 Product benchmarking
- 10.21 Hindustan Petroleum Corporation Limited
- 10.21.1 Company overview
- 10.21.2 Financial performance
- 10.21.3 Product benchmarking
- 10.22 Petroliam Nasional Berhad (PETRONAS)
- 10.22.1 Company overview
- 10.22.2 Financial performance
- 10.22.3 Product benchmarking
- 10.23 Yushiro Chemical Industry Co., Ltd.
- 10.23.1 Company overview
- 10.23.2 Financial performance
- 10.23.3 Product benchmarking
- 10.24 QualiChem, Inc.
- 10.24.1 Company Overview
- 10.24.2 Financial Performance
- 10.24.3 Product Benchmarking
- 10.25 Master Fluid Solutions.
- 10.25.1 Company Overview
- 10.25.2 Financial Performance
- 10.25.3 Product Benchmarking
- 10.26 Hardcastle Petrofer
- 10.26.1 Company Overview
- 10.26.2 Financial Performance
- 10.26.3 Product Benchmarking
- 10.27 Hangsterfer's Laboratories, Inc.
- 10.27.1 Company Overview
- 10.27.2 Financial Performance
- 10.27.3 Product Benchmarking
- 10.28 Castrol Limited
- 10.28.1 Company Overview
- 10.28.2 Financial Performance
- 10.28.3 Product Benchmarking
- 10.29 Illinois Tool Works, Inc.
- 10.29.1 Company Overview
- 10.29.2 Financial Performance
- 10.29.3 Product Benchmarking
- 10.30 Pennine Lubricants
- 10.30.1 Company Overview
- 10.30.2 Financial Performance
- 10.30.3 Product Benchmarking
- 10.31 JXTG Holdings, Inc.
- 10.31.1 Company Overview
- 10.31.2 Financial Performance
- 10.31.3 Product Benchmarking
Chapter 11 Metalworking Fluids: End-users Company Profiles
- 11.1 Triton Manufacturing Co., Inc.
- 11.1.1 Company overview
- 11.1.2 Financial performance
- 11.1.3 Product benchmarking
- 11.2 Special Products & Mfg., Inc.
- 11.2.1 Company overview
- 11.2.2 Financial performance
- 11.2.3 Product benchmarking
- 11.3 Merrill Technologies Group
- 11.3.1 Company overview
- 11.3.2 Financial performance
- 11.3.3 Services benchmarking
- 11.4 EVS Metal
- 11.4.1 Company overview
- 11.4.2 Financial performance
- 11.4.3 services benchmarking
- 11.5 Sandvik AB
- 11.5.1 Company overview
- 11.5.2 Financial performance
- 11.5.3 Product benchmarking
- 11.6 Deere & Company
- 11.6.1 Company overview
- 11.6.2 Financial performance
- 11.6.3 Product benchmarking
- 11.7 Ashok Leyland
- 11.7.1 Company overview
- 11.7.2 Financial performance
- 11.7.3 Product benchmarking
- 11.8 Cummins, Inc.
- 11.8.1 Company overview
- 11.8.2 Financial performance
- 11.8.3 Product benchmarking
- 11.8.4 Strategic initiatives
- 11.9 Carraro S.p.A.
- 11.9.1 Company overview
- 11.9.2 Financial performance
- 11.9.3 Product benchmarking
- 11.10 Caterpillar
- 11.10.1 Company overview
- 11.10.2 Financial performance
- 11.10.3 Product benchmarking
- 11.11 Weiss GmbH
- 11.11.1 Company Overview
- 11.11.2 Financial Performance
- 11.11.3 Product Benchmarking
- 11.11.4 Strategic Initiative
- 11.12 Vernet Behringer
- 11.12.1 Company Overview
- 11.12.2 Financial Performance
- 11.12.3 Product Benchmarking
- 11.12.4 Strategic Initiative
- 11.13 TRUMPF
- 11.13.1 Company Overview
- 11.13.2 Financial Performance
- 11.13.3 Product Benchmarking
- 11.14 Shenyang Machine Tools Co., Ltd.
- 11.14.1 Company Overview
- 11.14.2 Financial Performance
- 11.14.3 Product Benchmarking
- 11.15 Dalian Machine Tool Group Corporation
- 11.15.1 Company Overview
- 11.15.2 Financial Performance
- 11.15.3 Product Benchmarking
- 11.16 Doosan Infracore
- 11.16.1 Company Overview
- 11.16.2 Financial Performance
- 11.16.3 Product Benchmarking
- 11.16.4 Strategic Initiative
- 11.17 Komatsu Ltd.
- 11.17.1 Company Overview
- 11.17.2 Financial Performance
- 11.17.3 Product Benchmarking
- 11.17.4 Strategic Initiative
- 11.18 Schuler AG
- 11.18.1 Company Overview
- 11.18.2 Financial Performance
- 11.18.3 Product Benchmarking
- 11.18.4 Strategic Initiative
- 11.19 AMADA HOLDINGS Co., Ltd.
- 11.19.1 Company Overview
- 11.19.2 Financial Performance
- 11.19.3 Product Benchmarking