|
|
市場調査レポート
商品コード
1092701
コンブチャの市場規模、シェア、動向分析:製品(従来、ハード)、流通チャネル(オントレード、オフトレード)、地域別(北米、アジア太平洋、欧州、中東・アフリカ、中南米)のセグメント別予測(2022年~2030年)Kombucha Market Size, Share & Trends Analysis Report By Product (Conventional, Hard), By Distribution Channel (On-trade, Off-trade), By Region, And Segment Forecasts, 2022 - 2030 |
||||||
|
|
|||||||
|
● お客様のご希望に応じて、既存データの加工や未掲載情報(例:国別セグメント)の追加などの対応が可能です。 詳細はお問い合わせください。 |
|||||||


| コンブチャの市場規模、シェア、動向分析:製品(従来、ハード)、流通チャネル(オントレード、オフトレード)、地域別(北米、アジア太平洋、欧州、中東・アフリカ、中南米)のセグメント別予測(2022年~2030年) |
|
出版日: 2022年07月05日
発行: Grand View Research
ページ情報: 英文 80 Pages
納期: 2~10営業日
|
- 全表示
- 概要
- 図表
- 目次
世界のコンブチャの市場規模は、予測期間中に12.2%のCAGRで推移し、2030年までに119億1,000万米ドルに達すると予測されています。
機能性飲料に対する消費者の意識の高まりが、コンブチャの需要を加速させました。
コンブチャは、さまざまな健康効果や治療効果により、炭酸飲料の消費に取って代わる可能性のある飲料と考えられており、米国、中国、ロシア、ドイツ、中東の国々で人気を博し、大規模に生産・消費されています。
当レポートでは、世界のコンブチャ市場について調査し、市場の動向、セグメント・地域別の市場分析、競合情勢、主要企業のプロファイルなどの情報を提供しています。
目次
第1章 調査手法と範囲
第2章 エグゼクティブサマリー
第3章 コンブチャ市場の変数、動向および範囲
- 市場イントロダクション
- 浸透と成長の見通しマッピング
- 業界のバリューチェーン分析
- 市場力学
- ビジネス環境分析
- 市場のロードマップ
- 市場参入戦略
- COVID-19が市場に与える影響
第4章 消費者行動分析
- 人口統計分析
- 消費者の動向と選好
- 購入決定に影響を与える要因
- 消費者製品の採用
- 所見と提言
第5章 コンブチャ市場の推計と動向分析:製品別
- 動向分析と市場シェア(2021年、2030年)
- 従来
- ハード
第6章 コンブチャ市場の推計と動向分析:流通チャネル別
- 動向分析と市場シェア(2021年、2030年)
- オントレード
- オフトレード
第7章 コンブチャ市場の推計と動向分析:地域別
- 動向分析と市場シェア(2021年、2030年)
- 北米
- 米国
- カナダ
- メキシコ
- 欧州
- ドイツ
- 英国
- フランス
- オランダ
- スイス
- アジア太平洋
- 中国
- インド
- 日本
- オーストラリア
- 中南米
- ブラジル
- アルゼンチン
- 中東・アフリカ
- アラブ首長国連邦
- 南アフリカ
第8章 競合分析
- 世界の主要企業、最近の動向と業界への影響
- 主要企業/競合の分類(主要イノベーター、マーケットリーダー、新興企業)
- ベンダー情勢
第9章 企業プロファイル
- GT's Living Food
- København Kombucha
- Remedy Drinks
- GO Kombucha
- Læsk
- Lo Bros.
- VIGO KOMBUCHA
- brothersandsisters
- BB Kombucha
- MOMO KOMBUCHA
- Real Kombucha
- Equinox Kombucha
List of Tables
- Table 1 Kombucha market - Key market driver analysis
- Table 2 Kombucha market - Key market restraint analysis
- Table 3 Kombucha market estimates and forecast, 2017 - 2030 (USD Million)
- Table 4 Kombucha market revenue estimates and forecast by product, 2017 - 2030 (USD Million)
- Table 5 Kombucha market revenue estimates and forecast by distribution channel, 2017 - 2030 (USD Million)
- Table 6 North America kombucha market estimates and forecast, 2017 - 2030, (USD Million
- Table 7 North America kombucha market estimates and forecast, by product, 2017 - 2030 (USD Million)
- Table 8 North America kombucha market estimates and forecast, by distribution channel, 2017 - 2030 (USD Million)
- Table 9 U.S. kombucha market estimates and forecast, 2017 - 2030 (USD Million)
- Table 10 U.S. kombucha market estimates and forecast, by product, 2017 - 2030 (USD Million)
- Table 11 U.S. kombucha market estimates and forecast, by distribution channel, 2017 - 2030 (USD Million)
- Table 12 Canada kombucha market estimates and forecast, 2017 - 2030 (USD Million)
- Table 13 Canada kombucha market estimates and forecast, by product, 2017 - 2030 (USD Million)
- Table 14 Canada kombucha market estimates and forecast, by distribution channel, 2017 - 2030 (USD Million)
- Table 15 Mexico kombucha market estimates and forecast, 2017 - 2030 (USD Million)
- Table 16 Mexico kombucha market estimates and forecast, by product, 2017 - 2030 (USD Million)
- Table 17 Mexico kombucha market estimates and forecast, by distribution channel, 2017 - 2030 (USD Million)
- Table 18 Europe kombucha market estimates and forecast, 2017 - 2030 (USD Million)
- Table 19 Europe kombucha market estimates and forecast, by product, 2017 - 2030 (USD Million)
- Table 20 Europe kombucha market estimates and forecast, by distribution channel, 2017 - 2030 (USD Million)
- Table 21 Germany kombucha market estimates and forecast, 2017 - 2030 (USD Million)
- Table 22 Germany kombucha market estimates and forecast, by product, 2017 - 2030 (USD Million)
- Table 23 Germany kombucha market estimates and forecast, by distribution channel, 2017 - 2030 (USD Million)
- Table 24 U.K. kombucha market estimates and forecast, 2017 - 2030 (USD Million)
- Table 25 U.K. kombucha market estimates and forecast, by product, 2017 - 2030 (USD Million)
- Table 26 U.K. kombucha market estimates and forecast, by distribution channel, 2017 - 2030 (USD Million)
- Table 27 France kombucha market estimates and forecast, 2017 - 2030 (USD Million)
- Table 28 France kombucha market estimates and forecast, by product, 2017 - 2030 (USD Million)
- Table 29 France kombucha market estimates and forecast, by distribution channel, 2017 - 2030 (USD Million)
- Table 30 Netherlands kombucha market estimates and forecast, 2017 - 2030 (USD Million)
- Table 31 Netherlands kombucha market estimates and forecast, by product, 2017 - 2030 (USD Million)
- Table 32 Netherlands kombucha market estimates and forecast, by distribution channel, 2017 - 2030 (USD Million)
- Table 33 Switzerland kombucha market estimates and forecast, 2017 - 2030 (USD Million)
- Table 34 Switzerland kombucha market estimates and forecast, by product, 2017 - 2030 (USD Million)
- Table 35 Switzerland kombucha market estimates and forecast, by distribution channel, 2017 - 2030 (USD Million)
- Table 36 Asia Pacific kombucha market estimates and forecast, 2017 - 2030 (USD Million)
- Table 37 Asia Pacific kombucha market estimates and forecast, by product, 2017 - 2030 (USD Million)
- Table 38 Asia Pacific kombucha market estimates and forecast, by distribution channel, 2017 - 2030 (USD Million)
- Table 39 China kombucha market estimates and forecast, 2017 - 2030 (USD Million)
- Table 40 China kombucha market estimates and forecast, by product, 2017 - 2030 (USD Million)
- Table 41 China kombucha market estimates and forecast, by distribution channel, 2017 - 2030 (USD Million)
- Table 42 India kombucha market estimates and forecast, 2017 - 2030 (USD Million)
- Table 43 India kombucha market estimates and forecast, by product, 2017 - 2030 (USD Million)
- Table 44 India kombucha market estimates and forecast, by distribution channel, 2017 - 2030 (USD Million)
- Table 45 Japan kombucha market estimates and forecast, 2017 - 2030 (USD Million)
- Table 46 Japan kombucha market estimates and forecast, by product, 2017 - 2030 (USD Million)
- Table 47 Japan kombucha market estimates and forecast, by distribution channel, 2017 - 2030 (USD Million)
- Table 48 Australia kombucha market estimates and forecast, 2017 - 2030 (USD Million)
- Table 49 Australia kombucha market estimates and forecast, by product, 2017 - 2030 (USD Million)
- Table 50 Australia kombucha market estimates and forecast, by distribution channel, 2017 - 2030 (USD Million)
- Table 51 Central & South America kombucha market estimates and forecast, 2017 - 2030 (USD Million)
- Table 52 Central & South America kombucha market estimates and forecast, by product, 2017 - 2030 (USD Million)
- Table 53 Central & South America kombucha market estimates and forecast, by distribution channel, 2017 - 2030 (USD Million)
- Table 54 Brazil kombucha market estimates and forecast, 2017 - 2030 (USD Million)
- Table 55 Brazil kombucha market estimates and forecast, by product, 2017 - 2030 (USD Million)
- Table 56 Brazil kombucha market estimates and forecast, by distribution channel, 2017 - 2030 (USD Million)
- Table 57 Argentina kombucha market estimates and forecast, 2017 - 2030 (USD Million)
- Table 58 Argentina kombucha market estimates and forecast, by product, 2017 - 2030 (USD Million)
- Table 59 Argentina kombucha market estimates and forecast, by distribution channel, 2017 - 2030 (USD Million)
- Table 60 Middle East & Africa kombucha market estimates and forecast, 2017 - 2030 (USD Million)
- Table 61 Middle East & Africa kombucha market estimates and forecast, by product, 2017 - 2030 (USD Million)
- Table 62 Middle East & Africa kombucha market estimates and forecast, by distribution channel, 2017 - 2030 (USD Million)
- Table 63 UAE kombucha market estimates and forecast, 2017 - 2030 (USD Million)
- Table 64 UAE kombucha market estimates and forecast, by product, 2017 - 2030 (USD Million)
- Table 65 UAE kombucha market estimates and forecast, by distribution channel, 2017 - 2030 (USD Million)
- Table 66 South Africa kombucha market estimates and forecast, 2017 - 2030 (USD Million)
- Table 67 South Africa kombucha market estimates and forecast, by product, 2017 - 2030 (USD Million)
- Table 68 South Africa kombucha market estimates and forecast, by distribution channel, 2017 - 2030 (USD Million)
- Table 69 Company categorization
List of Figures
- Fig. 1 Kombucha market snapshot
- Fig. 2 Kombucha market segmentation & scope
- Fig. 3 Kombucha market penetration & growth prospect mapping
- Fig. 4 Kombucha market value chain analysis
- Fig. 5 Kombucha market dynamics
- Fig. 6 Kombucha market Porter's analysis
- Fig. 7 Kombucha market: Product movement analysis
- Fig. 8 Kombucha market: Distribution channel movement analysis
- Fig. 9 Kombucha market: Regional movement analysis
Kombucha Market Growth & Trends:
The global kombucha market size is expected to reach USD 9.70 billion by 2030, according to a new report by Grand View Research, Inc. Furthermore, the market is expected to expand at a 15.6% CAGR from 2022 to 2030. The market has reported rapid growth in recent years and has caught consumers' attention recently, as kombucha is considered to be a functional beverage. Growing consumer awareness of functional beverages has escalated the demand for kombucha. The product has grown into a commercial product in the U.S. and several companies are producing it, and the variety of kombuchas is increasing rapidly.
Kombucha has gained immense popularity in recent times due to various associated health benefits. The therapeutic effects of this beverage are thought to be derived from its chemical composition, mainly the polyphenols and secondary metabolites, which are produced during fermentation. Kombucha is considered a potential beverage and has replaced the consumption of carbonated beverages due to its possession of health benefits and therapeutic properties. The product has gained popularity in the U.S., China, Russia, Germany, and the Middle Eastern countries, and is produced on a large scale for consumption.
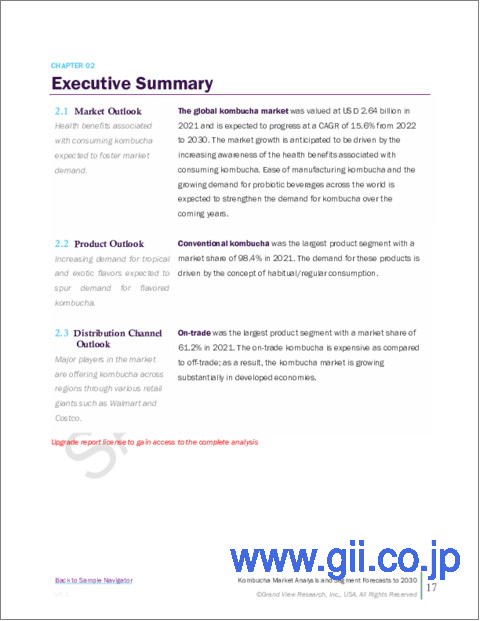
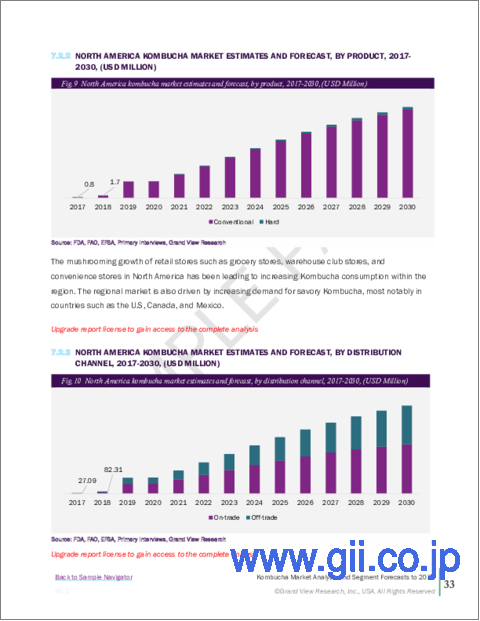
The conventional kombucha segment accounted for the dominant share of the global revenue in 2021. The growing availability of conventional kombucha in flavors of fruits and herbs, such as ginger, lemon, blueberry, raspberry, strawberry, lime, mint, and mango, is driving the product demand. With the current trend of growing cannabidiol (CBD) application in the U.S. food industry, some market players are launching CBD-infused kombucha in the market, thus driving the product demand.
The off-trade segment is expected to grow with a higher CAGR during the forecast period. Several brands are using proprietary filtration and encapsulation technologies that allow probiotic bacteria to survive pasteurization and survive at room temperatures, to make it suitable for kombucha to be kept on non-refrigerated shelves in supermarkets. These technologies are being employed by non-alcoholic (less than 5% alcohol) and alcoholic kombuchas like Flying Embers to make products sustain for a more extended period.
The market for kombucha is highly competitive and dominated by large multinational manufacturing companies. These companies face intense competition, especially from the top players in the kombucha industry, as they have a large consumer base, strong brand recognition, and vast distribution networks.
Kombucha Market Report Highlights:
- North America held the largest regional share and is expected to advance at a CAGR of 15.9% through 2030, as regional consumers are consuming kombucha in order to boost immunity, increase energy, improve gastrointestinal (GI), joint health & liver functions, and lower blood pressure and cholesterol
- The hard kombucha segment is expected to advance at a higher CAGR during the forecast period, as they are preferred by consumers who enjoy non-alcoholic beverages such as premium crafted cocktails with low-ABV content
- The on-trade segment accounted for a larger share of the global revenue in 2021, owing to the increasing consumption of kombucha in classic cocktails through premium bars, cafes, restaurants, and hotels
Table of Contents
Chapter 1. Methodology and Scope
- 1.1. Market Segmentation & Scope
- 1.2. Market Definition
- 1.3. Information Procurement
- 1.3.1. Purchased Database
- 1.3.2. GVR's Internal Database
- 1.3.3. Secondary Sources & Third-Party Perspectives
- 1.3.4. Primary Research
- 1.4. Information Analysis
- 1.4.1. Data Analysis Models
- 1.5. Market Formulation & Data Visualization
- 1.6. Data Validation & Publishing
Chapter 2. Executive Summary
- 2.1. Market Outlook
- 2.2. Product Outlook
- 2.3. Distribution Channel Outlook
- 2.4. Regional Outlook
- 2.5. Competitive Insights
Chapter 3. Kombucha Market Variables, Trends & Scope
- 3.1. Market Introduction
- 3.2. Penetration & Growth Prospect Mapping
- 3.3. Industry Value Chain Analysis
- 3.3.1. Sales/Retail Channel Analysis
- 3.3.2. Profit Margin Analysis
- 3.4. Market Dynamics
- 3.4.1. Market Driver Analysis
- 3.4.2. Market Restraint Analysis
- 3.4.3. Industry Challenges
- 3.4.4. Industry Opportunities
- 3.5. Business Environment Analysis
- 3.5.1. Industry Analysis - Porter's
- 3.5.1.1. Supplier Power
- 3.5.1.2. Buyer Power
- 3.5.1.3. Substitution Threat
- 3.5.1.4. Threat from New Entrant
- 3.5.1.5. Competitive Rivalry
- 3.5.1. Industry Analysis - Porter's
- 3.6. Roadmap of Kombucha Market
- 3.7. Market Entry Strategies
- 3.8. Impact of COVID-19 on the Kombucha Market
Chapter 4. Consumer Behavior Analysis
- 4.1. Demographic Analysis
- 4.2. Consumer Trends and Preferences
- 4.3. Factors Affecting Buying Decision
- 4.4. Consumer Product Adoption
- 4.5. Observations & Recommendations
Chapter 5. Kombucha Market: Product Estimates & Trend Analysis
- 5.1. Product Movement Analysis & Market Share, 2021 & 2030
- 5.2. Conventional
- 5.2.1. Conventional kombucha market estimates and forecast, 2017 - 2030 (USD Million)
- 5.3. Hard
- 5.3.1. Hard kombucha market estimates and forecast, 2017 - 2030 (USD Million)
Chapter 6. Kombucha Market: Distribution Channel Estimates & Trend Analysis
- 6.1. Distribution Channel Movement Analysis & Market Share, 2021 & 2030
- 6.2. On-trade
- 6.2.1. Kombucha market estimates and forecast, through on-trade channel, 2017 - 2030 (USD Million)
- 6.3. Off-trade
- 6.3.1. Kombucha market estimates and forecast, through off-trade channel, 2017 - 2030 (USD Million)
Chapter 7. Kombucha Market: Regional Estimates & Trend Analysis
- 7.1. Regional Movement Analysis & Market Share, 2021 & 2030
- 7.2. North America
- 7.2.1. Market estimates and forecast, 2017 - 2030 (USD Million)
- 7.2.2. Market estimates and forecast, by product, 2017 - 2030 (USD Million)
- 7.2.3. Market estimates and forecast, by distribution channel, 2017 - 2030 (USD Million)
- 7.2.4. U.S.
- 7.2.4.1. Market estimates and forecast, 2017 - 2030 (USD Million)
- 7.2.4.2. Market estimates and forecast, by product, 2017 - 2030 (USD Million)
- 7.2.4.3. Market estimates and forecast, by distribution channel, 2017 - 2030 (USD Million)
- 7.2.5. Canada
- 7.2.5.1. Market estimates and forecast, 2017 - 2030 (USD Million)
- 7.2.5.2. Market estimates and forecast, by product, 2017 - 2030 (USD Million)
- 7.2.5.3. Market estimates and forecast, by distribution channel, 2017 - 2030 (USD Million)
- 7.2.6. Mexico
- 7.2.6.1. Market estimates and forecast, 2017 - 2030 (USD Million)
- 7.2.6.2. Market estimates and forecast, by product, 2017 - 2030 (USD Million)
- 7.2.6.3. Market estimates and forecast, by distribution channel, 2017 - 2030 (USD Million)
- 7.3. Europe
- 7.3.1. Market estimates and forecast, 2017 - 2030 (USD Million)
- 7.3.2. Market estimates and forecast, by product, 2017 - 2030 (USD Million)
- 7.3.3. Market estimates and forecast, by distribution channel, 2017 - 2030 (USD Million)
- 7.3.4. Germany
- 7.3.4.1. Market estimates and forecast, 2017 - 2030 (USD Million)
- 7.3.4.2. Market estimates and forecast, by product, 2017 - 2030 (USD Million)
- 7.3.4.3. Market estimates and forecast, by distribution channel, 2017 - 2030 (USD Million)
- 7.3.5. U.K.
- 7.3.5.1. Market estimates and forecast, 2017 - 2030 (USD Million)
- 7.3.5.2. Market estimates and forecast, by product, 2017 - 2030 (USD Million)
- 7.3.5.3. Market estimates and forecast, by distribution channel, 2017 - 2030 (USD Million)
- 7.3.6. France
- 7.3.6.1. Market estimates and forecast, 2017 - 2030 (USD Million)
- 7.3.6.2. Market estimates and forecast, by product, 2017 - 2030 (USD Million)
- 7.3.6.3. Market estimates and forecast, by distribution channel, 2017 - 2030 (USD Million)
- 7.3.7. The Netherlands
- 7.3.7.1. Market estimates and forecast, 2017 - 2030 (USD Million)
- 7.3.7.2. Market estimates and forecast, by product, 2017 - 2030 (USD Million)
- 7.3.7.3. Market estimates and forecast, by distribution channel, 2017 - 2030 (USD Million)
- 7.3.8. Switzerland
- 7.3.8.1. Market estimates and forecast, 2017 - 2030 (USD Million)
- 7.3.8.2. Market estimates and forecast, by product, 2017 - 2030 (USD Million)
- 7.3.8.3. Market estimates and forecast, by distribution channel, 2017 - 2030 (USD Million)
- 7.4. Asia Pacific
- 7.4.1. Market estimates and forecast, 2017 - 2030 (USD Million)
- 7.4.2. Market estimates and forecast, by product, 2017 - 2030 (USD Million)
- 7.4.3. Market estimates and forecast, by distribution channel, 2017 - 2030 (USD Million)
- 7.4.4. China
- 7.4.4.1. Market estimates and forecast, 2017 - 2030 (USD Million)
- 7.4.4.2. Market estimates and forecast, by product, 2017 - 2030 (USD Million)
- 7.4.4.3. Market estimates and forecast, by distribution channel, 2017 - 2030 (USD Million)
- 7.4.5. India
- 7.4.5.1. Market estimates and forecast, 2017 - 2030 (USD Million)
- 7.4.5.2. Market estimates and forecast, by product, 2017 - 2030 (USD Million)
- 7.4.5.3. Market estimates and forecast, by distribution channel, 2017 - 2030 (USD Million)
- 7.4.6. Japan
- 7.4.6.1. Market estimates and forecast, 2017 - 2030 (USD Million)
- 7.4.6.2. Market estimates and forecast, by product, 2017 - 2030 (USD Million)
- 7.4.6.3. Market estimates and forecast, by distribution channel, 2017 - 2030 (USD Million)
- 7.4.7. Australia
- 7.4.7.1. Market estimates and forecast, 2017 - 2030 (USD Million)
- 7.4.7.2. Market estimates and forecast, by product, 2017 - 2030 (USD Million)
- 7.4.7.3. Market estimates and forecast, by distribution channel, 2017 - 2030 (USD Million)
- 7.5. Central & South America
- 7.5.1. Market estimates and forecast, 2017 - 2030 (USD Million)
- 7.5.2. Market estimates and forecast, by product, 2017 - 2030 (USD Million)
- 7.5.3. Market estimates and forecast, by distribution channel, 2017 - 2030 (USD Million)
- 7.5.4. Brazil
- 7.5.4.1. Market estimates and forecast, 2017 - 2030 (USD Million)
- 7.5.4.2. Market estimates and forecast, by product, 2017 - 2030 (USD Million)
- 7.5.4.3. Market estimates and forecast, by distribution channel, 2017 - 2030 (USD Million)
- 7.5.5. Argentina
- 7.5.5.1. Market estimates and forecast, 2017 - 2030 (USD Million)
- 7.5.5.2. Market estimates and forecast, by product, 2017 - 2030 (USD Million)
- 7.5.5.3. Market estimates and forecast, by distribution channel, 2017 - 2030 (USD Million)
- 7.6. Middle East & Africa
- 7.6.1. Market estimates and forecast, 2017 - 2030 (USD Million)
- 7.6.2. Market estimates and forecast, by product, 2017 - 2030 (USD Million)
- 7.6.3. Market estimates and forecast, by distribution channel, 2017 - 2030 (USD Million)
- 7.6.4. UAE
- 7.6.4.1. Market estimates and forecast, 2017 - 2030 (USD Million)
- 7.6.4.2. Market estimates and forecast, by product, 2017 - 2030 (USD Million)
- 7.6.4.3. Market estimates and forecast, by distribution channel, 2017 - 2030 (USD Million)
- 7.6.5. South Africa
- 7.6.5.1. Market estimates and forecast, 2017 - 2030 (USD Million)
- 7.6.5.2. Market estimates and forecast, by product, 2017 - 2030 (USD Million)
- 7.6.5.3. Market estimates and forecast, by distribution channel, 2017 - 2030 (USD Million)
Chapter 8. Competitive Analysis
- 8.1. Key global players, recent developments & their impact on the industry
- 8.2. Key Company/Competition Categorization (Key innovators, Market leaders, Emerging players)
- 8.3. Vendor Landscape
- 8.3.1. Key company market share analysis, 2021
Chapter 9. Company Profiles
- 9.1. GT's Living Food
- 9.1.1. Company Overview
- 9.1.2. Financial Performance
- 9.1.3. Product Benchmarking
- 9.1.4. Strategic Initiatives
- 9.2. København Kombucha
- 9.2.1. Company Overview
- 9.2.2. Financial Performance
- 9.2.3. Product Benchmarking
- 9.2.4. Strategic Initiatives
- 9.3. Remedy Drinks
- 9.3.1. Company Overview
- 9.3.2. Financial Performance
- 9.3.3. Product Benchmarking
- 9.3.4. Strategic Initiatives
- 9.4. GO Kombucha
- 9.4.1. Company Overview
- 9.4.2. Financial Performance
- 9.4.3. Product Benchmarking
- 9.4.4. Strategic Initiatives
- 9.5. Læsk
- 9.5.1. Company Overview
- 9.5.2. Financial Performance
- 9.5.3. Product Benchmarking
- 9.5.4. Strategic Initiatives
- 9.6. Lo Bros.
- 9.6.1. Company Overview
- 9.6.2. Financial Performance
- 9.6.3. Product Benchmarking
- 9.6.4. Strategic Initiatives
- 9.7. VIGO KOMBUCHA
- 9.7.1. Company Overview
- 9.7.2. Financial Performance
- 9.7.3. Product Benchmarking
- 9.7.4. Strategic Initiatives
- 9.8. Brothers and sisters
- 9.8.1. Company Overview
- 9.8.2. Financial Performance
- 9.8.3. Product Benchmarking
- 9.8.4. Strategic Initiatives
- 9.9. BB Kombucha
- 9.9.1. Company Overview
- 9.9.2. Financial Performance
- 9.9.3. Product Benchmarking
- 9.9.4. Strategic Initiatives
- 9.10. MOMO KOMBUCHA
- 9.10.1. Company Overview
- 9.10.2. Financial Performance
- 9.10.3. Product Benchmarking
- 9.10.4. Strategic Initiatives
- 9.11. Real Kombucha
- 9.11.1. Company Overview
- 9.11.2. Financial Performance
- 9.11.3. Product Benchmarking
- 9.11.4. Strategic Initiatives
- 9.12. Equinox Kombucha
- 9.12.1. Company Overview
- 9.12.2. Financial Performance
- 9.12.3. Product Benchmarking
- 9.12.4. Strategic Initiatives