|
|
市場調査レポート
商品コード
1092441
クルーズの世界市場規模、シェア、動向分析:タイプ別(オーシャンクルーズ、リバークルーズ)、地域別のセグメント予測(2022年~2028年)Cruise Market Size, Share & Trends Analysis Report By Type (Ocean Cruises, River Cruises), By Region, And Segment Forecasts, 2022 - 2028 |
||||||
|
|
|||||||
|
● お客様のご希望に応じて、既存データの加工や未掲載情報(例:国別セグメント)の追加などの対応が可能です。 詳細はお問い合わせください。 |
|||||||


| クルーズの世界市場規模、シェア、動向分析:タイプ別(オーシャンクルーズ、リバークルーズ)、地域別のセグメント予測(2022年~2028年) |
|
出版日: 2022年05月04日
発行: Grand View Research
ページ情報: 英文 74 Pages
納期: 2~10営業日
|
- 全表示
- 概要
- 図表
- 目次
世界のクルーズの市場規模は、2022年から2028年の予測期間中に11.0%のCAGRで推移し、2028年までに151億米ドルに達すると予測されています。
市場の成長は、さまざまな消費者グループを魅了するテーマクルーズの人気上昇によって大きく推進されています。また、Z世代はミレニアル世代をを上回る最大のクルーズ業界の消費者になる可能性が期待されています。この世代は、ユニークで本格的な体験を追及し、より熱心に旅を求めているため、同市場の拡大を牽引するものと予想されています。
当レポートでは、世界のクルーズ市場を調査し、市場の概要、タイプ別・地域別の市場規模の推移と予測、競合情勢、主要企業のプロファイルなどの情報を提供しています。
目次
第1章 調査手法と範囲
第2章 エグゼクティブサマリー
第3章 市場変数、動向、範囲
- 市場イントロダクション
- 浸透・成長の見通しマッピング
- 業界のバリューチェーン分析
- 市場力学
- ビジネス環境分析
- クルーズ市場のロードマップ
- 市場参入戦略
- COVID-19の影響
第4章 消費者行動分析
- 消費者動向・嗜好
- 購入決定に影響を与える要因
- 消費者タイプの採用
- 観察・推奨事項
第5章 クルーズ市場の推計と動向分析:タイプ別
- 動向分析・市場シェア:タイプ別(2021年・2028年)
- オーシャンクルーズ
- リバークルーズ
第6章 クルーズ市場の推計と動向分析:地域別
- 動向分析・市場シェア:地域別(2021年・2028年)
- 北米
- 米国
- カナダ
- 欧州
- 英国
- ドイツ
- フランス
- アジア太平洋
- 中国
- インド
- 日本
- 中南米
- ブラジル
- アルゼンチン
- 中東・アフリカ
- サウジアラビア
- 南アフリカ
第7章 競合分析
- 世界の主要企業、最新動向、業界への影響
- 主要企業/競合の分類(主要なイノベーター、市場リーダー、新興企業)
- ベンダー情勢
第8章 企業プロファイル
- Carnival Corporation & Plc.
- Royal Caribbean Group
- MSC Cruises S.A.
- Norwegian Cruise Line Holdings Ltd.
- Disney Cruise Line
- Genting Hong Kong Limited
- Fred. Olsen Cruise Lines
List of Tables
- 1. Cruises market - Key market driver analysis
- 2. Cruises market - Key market restraint analysis
- 3. Global Ocean Cruises market revenue estimates and forecast by Type, from 2017 - 2028 (USD Million)
- 4. Global River Cruises market revenue estimates and forecast by Type, from 2017 - 2028 (USD Million)
- 5. Global Cruises market estimates and forecast, by region 2017 - 2028 (USD Million)
- 6. Global Cruises market revenue estimates and forecast by Type, 2017 - 2028 (USD Million)
- 7. North America Cruises market estimates and forecast, 2017 - 2028 (USD Million)
- 8. North America Cruises market revenue estimates and forecast, by Type, 2017 - 2028 (USD Million)
- 9. U.S. Cruises market estimates and forecast, 2017 - 2028 (USD Million)
- 10. U.S. Cruises market revenue estimates and forecast by Type, 2017 - 2028 (USD Million)
- 11. Canada Cruises market estimates and forecast, 2017 - 2028 (USD Million)
- 12. Canada Cruises market revenue estimates and forecast by Type, 2017 - 2028 (USD Million)
- 13. Europe Cruises market estimates and forecast, 2017 - 2028 (USD Million)
- 14. Europe Cruises market revenue estimates and forecast by Type, 2017 - 2028 (USD Million)
- 15. U.K. Cruises market estimates and forecast, 2017 - 2028 (USD Million)
- 16. U.K. Cruises market revenue estimates and forecast by Type, 2017 - 2028 (USD Million)
- 17. Germany Cruises market estimates and forecast, 2017 - 2028 (USD Million)
- 18. Germany Cruises market revenue estimates and forecast by Type, 2017 - 2028 (USD Million)
- 19. France Cruises market estimates and forecast, 2017 - 2028 (USD Million)
- 20. France Cruises market revenue estimates and forecast by Type, 2017 - 2028 (USD Million)
- 21. Asia Pacific Cruises market estimates and forecast, 2017 - 2028 (USD Million)
- 22. Asia Pacific Cruises market revenue estimates and forecast by Type, 2017 - 2028 (USD Million)
- 23. China Cruises market estimates and forecast, 2017 - 2028 (USD Million)
- 24. China Cruises market revenue estimates and forecast by Type, 2017 - 2028 (USD Million)
- 25. India Cruises market estimates and forecast, 2017 - 2028 (USD Million)
- 26. India Cruises market revenue estimates and forecast by Type, 2017 - 2028 (USD Million)
- 27. Japan Cruises market estimates and forecast, 2017 - 2028 (USD Million)
- 28. Japan Cruises market revenue estimates and forecast by Type, 2017 - 2028 (USD Million)
- 29. Central & South America Cruises market estimates and forecast, 2017 - 2028 (USD Million)
- 30. Central & South America Cruises market revenue estimates and forecast by Type, 2017 - 2028 (USD Million)
- 31. Brazil Cruises market estimates and forecast, 2017 - 2028 (USD Million)
- 32. Brazil Cruises market revenue estimates and forecast by Type, 2017 - 2028 (USD Million)
- 33. Argentina Cruises market estimates and forecast, 2017 - 2028 (USD Million)
- 34. Argentina Cruises market revenue estimates and forecast by Type, 2017 - 2028 (USD Million)
- 35. Middle East & Africa Cruises market estimates and forecast, 2017 - 2028 (USD Million)
- 36. Middle East & Africa Cruises market revenue estimates and forecast by Type, 2017 - 2028 (USD Million)
- 37. Saudi Arabia Cruises market estimates and forecast, 2017 - 2028 (USD Million)
- 38. Saudi Arabia Cruises market revenue estimates and forecast by Type, 2017 - 2028 (USD Million)
- 39. South Africa Cruises market estimates and forecast, 2017 - 2028 (USD Million)
- 40. South Africa Cruises market revenue estimates and forecast by Type, 2017 - 2028 (USD Million)
- 41. Vendor landscape
List of Figures
- 1. Cruises Market snapshot
- 2. Cruises Market segmentation & scope
- 3. Cruises Market penetration & growth prospect mapping
- 4. Cruises Market value chain analysis
- 5. Cruises Market dynamics
- 6. Cruises Market Porter's analysis
- 7. Cruises Market: Type movement analysis
- 8. Cruises Market: Regional movement analysis
Cruise Market Growth & Trends:
The global cruise market size is expected to reach USD 15.10 billion by 2028, registering a CAGR of 11.0% during the forecast period from 2022 to 2028, according to a new report by Grand View Research, Inc. The market growth is substantially driven by the rising popularity of the theme cruises that attract various consumer groups. The kids-related theme, yoga theme, mystery theme, and adventure theme are likely to offer extra fun with destination traveling, rather than traditional cruises.
According to the Cruise Lines International Association, gen z is likely to become the largest consumer of the cruise industry outpacing millennials. This generation seeks out unique and authentic experiences and seeks out travel more enthusiastically, which is expected to drive the enlargement of the cruises market. The market growth is restrained by the limited companies playing in the market and rising concerns over environmental pollution of the ocean bodies, destroying marine wildlife.
The COVID-19 pandemic negatively impacted the global cruises industry. At the break of the pandemic, a significant number of cruises were stranded in 2019 and were canceled in 2020. According to the Cruise Lines International Association, passenger volume fell more than 80.0% worldwide from 2019 to 2020. However, with the vaccination process and resumed activities along with relaxed restrictions, the ocean as well as river cruising industry is slowly starting operations with the required care.
The ocean cruises segment dominated the market and held more than 80.0% revenue share, in 2021. The worldwide ocean cruise industry is more developed as compared to the counterpart type of cruises, with more ocean cruise lines operating in the segment. Vacationers' preference for ocean cruises is higher as compared to the river cruises on the account of spacious decks and rooms, exciting on-board/on-shore activities, and more intercontinental destinations.
North America ranked first in the market revenue share during 2021, in the global cruises market, recording around 50.0% share. The large market share of North America is mainly attributed to the United States' higher share due to the consumer's elevated spending on travel and tourism, the strong presence of key players, and the highly developed cruise industry. Major players dominating the market are Carnival Corporation & Plc. and Royal Cruise Group, whose major customers and revenue generated is from the North American region, attributing the highest market share.
Cruise Market Report Highlights:
- North America dominated the global cruises market in 2021, occupying around 50.0% revenue share of the market. The developed travel and tourism industry, strong presence of the key players, and higher consumer spending are the factors credited to the higher market revenue share
- River cruises is expected to witness the highest growth rate, registering a CAGR of 13.3% from 2022 to 2028.Rising popularity of river cruise packages and limited operation ability of the ocean cruises, due to COVID-19 restrictions, are the factors likely to help river cruise type, driving the growth rate
- Europe was the second dominating region in terms of revenue share and accounted for more than 25.0% of the share, in 2021. The growing demand for sustainable tourism is fueling the market growth during the forecast period. The growing demand for sustainable tourism within the region leads to be more beneficial for the small as well as medium-sized tour operators and attracts them in large numbers thus contributing to more revenue generation
Table of Contents
Chapter 1. Methodology and Scope
- 1.1. Market Segmentation & Scope
- 1.2. Market Definition
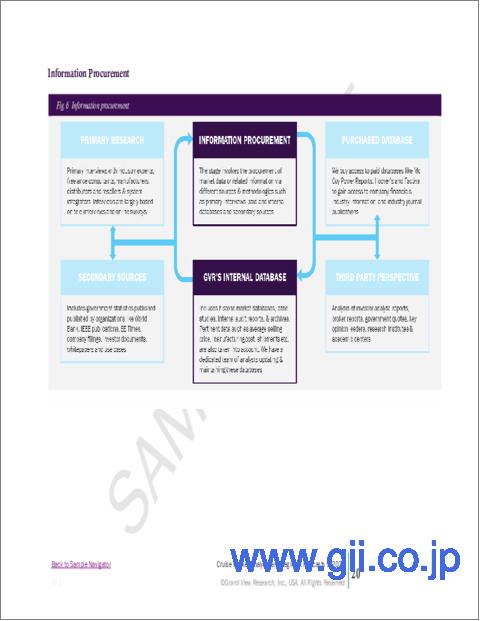
- 1.3. Information Procurement
- 1.3.1. Purchased Database
- 1.3.2. GVR's Internal Database
- 1.3.3. Secondary Sources & Third-Party Perspectives
- 1.3.4. Primary Research
- 1.4. Information Analysis
- 1.4.1. Data Analysis Models
- 1.5. Market Formulation & Data Visualization
- 1.6. Data Validation & Publishing
Chapter 2. Executive Summary
- 2.1. Market Outlook
- 2.2. Type Outlook
- 2.3. Regional Outlook
Chapter 3. Cruises Market Variables, Trends & Scope
- 3.1. Market Introduction
- 3.2. Penetration & Growth Prospect Mapping
- 3.3. Industry Value Chain Analysis
- 3.3.1. Sales/Retail Channel Analysis
- 3.3.2. Profit Margin Analysis
- 3.4. Market Dynamics
- 3.4.1. Market Driver Analysis
- 3.4.2. Market Restraint Analysis
- 3.4.3. Industry Challenges
- 3.4.4. Industry Opportunities
- 3.5. Business Environment Analysis
- 3.5.1. Industry Analysis - Porter's Five Forces Analysis
- 3.5.1.1. Supplier Power
- 3.5.1.2. Buyer Power
- 3.5.1.3. Substitution Threat
- 3.5.1.4. Threat from New Entrant
- 3.5.1.5. Competitive Rivalry
- 3.5.1. Industry Analysis - Porter's Five Forces Analysis
- 3.6. Roadmap of Cruises Market
- 3.7. Market Entry Strategies
- 3.8. Impact of COVID-19
Chapter 4. Consumer Behavior Analysis
- 4.1. Consumer Trends and Preferences
- 4.2. Factors Affecting Buying Decision
- 4.3. Consumer Type Adoption
- 4.4. Observations & Recommendations
Chapter 5. Cruises Market: Type Estimates & Trend Analysis
- 5.1. Type Movement Analysis & Market Share, 2021& 2028
- 5.2. Ocean Cruises
- 5.2.1. Market estimates and forecast, 2017 - 2028 (USD Million)
- 5.3. River Cruises
- 5.3.1. Market estimates and forecast, 2017 - 2028 (USD Million)
Chapter 6. Cruises Market: Regional Estimates & Trend Analysis
- 6.1. Regional Movement Analysis & Market Share, 2021& 2028
- 6.2. North America
- 6.2.1. Market estimates and forecast, 2017 - 2028 (USD Million)
- 6.2.2. Market estimates and forecast, by Type, 2017 - 2028 (USD Million)
- 6.2.3. U.S.
- 6.2.3.1. Market estimates and forecast, 2017 - 2028 (USD Million)
- 6.2.3.2. Market estimates and forecast, by Type, 2017 - 2028 (USD Million)
- 6.2.4. Canada
- 6.2.4.1. Market estimates and forecast, 2017 - 2028 (USD Million)
- 6.2.4.2. Market estimates and forecast, by Type, 2017 - 2028 (USD Million)
- 6.3. Europe
- 6.3.1. Market estimates and forecast, 2017 - 2028 (USD Million)
- 6.3.2. Market estimates and forecast, by Type, 2017 - 2028 (USD Million)
- 6.3.3. U.K.
- 6.3.3.1. Market estimates and forecast, 2017 - 2028 (USD Million)
- 6.3.3.2. Market estimates and forecast, by Type, 2017 - 2028 (USD Million)
- 6.3.4. Germany
- 6.3.4.1. Market estimates and forecast, 2017 - 2028 (USD Million)
- 6.3.4.2. Market estimates and forecast, by Type, 2017 - 2028 (USD Million)
- 6.3.5. France
- 6.3.5.1. Market estimates and forecast, 2017 - 2028 (USD Million)
- 6.3.5.2. Market estimates and forecast, by Type, 2017 - 2028 (USD Million)
- 6.4. Asia Pacific
- 6.4.1. Market estimates and forecast, 2017 - 2028 (USD Million)
- 6.4.2. Market estimates and forecast, by Type, 2017 - 2028 (USD Million)
- 6.4.3. China
- 6.4.3.1. Market estimates and forecast, 2017 - 2028 (USD Million)
- 6.4.3.2. Market estimates and forecast, by Type, 2017 - 2028 (USD Million)
- 6.4.4. India
- 6.4.4.1. Market estimates and forecast, 2017 - 2028 (USD Million)
- 6.4.4.2. Market estimates and forecast, by Type, 2017 - 2028 (USD Million)
- 6.4.5. Japan
- 6.4.5.1. Market estimates and forecast, 2017 - 2028 (USD Million)
- 6.4.5.2. Market estimates and forecast, by Type, 2017 - 2028 (USD Million)
- 6.5. Central & South America
- 6.5.1. Market estimates and forecast, 2017 - 2028 (USD Million)
- 6.5.2. Market estimates and forecast, by Type, 2017 - 2028 (USD Million)
- 6.5.3. Brazil
- 6.5.3.1. Market estimates and forecast, 2017 - 2028 (USD Million)
- 6.5.3.2. Market estimates and forecast, by Type, 2017 - 2028 (USD Million)
- 6.5.4. Argentina
- 6.5.4.1. Market estimates and forecast, 2017 - 2028 (USD Million)
- 6.5.4.2. Market estimates and forecast, by Type, 2017 - 2028 (USD Million)
- 6.6. Middle East & Africa
- 6.6.1. Market estimates and forecast, 2017 - 2028 (USD Million)
- 6.6.2. Market estimates and forecast, by Type, 2017 - 2028 (USD Million)
- 6.6.3. Saudi Arabia
- 6.6.3.1. Market estimates and forecast, 2017 - 2028 (USD Million)
- 6.6.3.2. Market estimates and forecast, by Type, 2017 - 2028 (USD Million)
- 6.6.4. South Africa
- 6.6.4.1. Market estimates and forecast, 2017 - 2028 (USD Million)
- 6.6.4.2. Market estimates and forecast, by Type, 2017 - 2028 (USD Million)
Chapter 7. Competitive Analysis
- 7.1. Key global players, recent developments & their impact on the industry
- 7.2. Key Company/Competition Categorization (Key innovators, Market leaders, Emerging players)
- 7.3. Vendor Landscape
- 7.3.1. Key company market share analysis, 2021
Chapter 8. Company Profiles
- 8.1. Carnival Corporation & Plc.
- 8.1.1. Company Overview
- 8.1.2. Financial Performance
- 8.1.3. Product Benchmarking
- 8.1.4. Strategic Initiatives
- 8.2. Royal Caribbean Group
- 8.2.1. Company Overview
- 8.2.2. Financial Performance
- 8.2.3. Product Benchmarking
- 8.2.4. Strategic Initiatives
- 8.3. MSC Cruises S.A.
- 8.3.1. Company Overview
- 8.3.2. Financial Performance
- 8.3.3. Product Benchmarking
- 8.3.4. Strategic Initiatives
- 8.4. Norwegian Cruise Line Holdings Ltd.
- 8.4.1. Company Overview
- 8.4.2. Financial Performance
- 8.4.3. Product Benchmarking
- 8.4.4. Strategic Initiatives
- 8.5. Disney Cruise Line
- 8.5.1. Company Overview
- 8.5.2. Financial Performance
- 8.5.3. Product Benchmarking
- 8.5.4. Strategic Initiatives
- 8.6. Genting Hong Kong Limited
- 8.6.1. Company Overview
- 8.6.2. Financial Performance
- 8.6.3. Product Benchmarking
- 8.6.4. Strategic Initiatives
- 8.7. Fred. Olsen Cruise Lines
- 8.7.1. Company Overview
- 8.7.2. Financial Performance
- 8.7.3. Product Benchmarking
- 8.7.4. Strategic Initiatives