|
|
市場調査レポート
商品コード
1404960
シェアードモビリティ市場の市場規模、シェア、動向分析レポート:サービスモデル別、チャネル別、車両別、地域別、セグメント別予測(2023年~2030年)Shared Mobility Market Size, Share & Trends Analysis Report By Service Model (Ride Hailing, Bike Sharing, Ride Sharing, Car Sharing), By Channel, By Vehicle (Cars, Two-wheelers), By Region, And Segment Forecasts, 2023 - 2030 |
||||||
|
|
|||||||
|
● お客様のご希望に応じて、既存データの加工や未掲載情報(例:国別セグメント)の追加などの対応が可能です。 詳細はお問い合わせください。 |
|||||||


| シェアードモビリティ市場の市場規模、シェア、動向分析レポート:サービスモデル別、チャネル別、車両別、地域別、セグメント別予測(2023年~2030年) |
|
出版日: 2023年11月13日
発行: Grand View Research
ページ情報: 英文 125 Pages
納期: 2~10営業日
|
- 全表示
- 概要
- 図表
- 目次
シェアードモビリティ市場の成長と動向:
世界のシェアードモビリティの市場規模は2030年までに6,753億6,000万米ドルに達し、2023年~2030年にCAGR14.8%で成長すると予測されます。
この成長の原動力となっているのは、ユーザーが迅速かつ簡単に相乗りにアクセスし、予約できるモバイルアプリの普及です。これらのアプリは、車両の空き状況、価格、位置に関するリアルタイムの情報を提供するため、ユーザーは旅行の計画を立てやすくなり、街中を移動しやすくなります。都市や政府が二酸化炭素排出量を削減し、大気の質を改善するために、持続可能な交通ソリューションを優先する傾向が強まっているため、市場における電気自動車やハイブリッド車の利用は今後数年間で拡大すると予想されます。
2023年2月、Uber TechnologiesはTata Motorsと、インドで持続可能なモビリティを推進するための覚書(MoU)を締結しました。同協業は、コルカタ、ムンバイ、チェンナイ、ハイデラバード、デリーNCR、ベンガルール、アーメダバードなど、インドの主要都市におけるUberサービスの電動化を支援します。Tata Motorsとの協業は、インドのモビリティ・プラットフォームにおいて四輪EVが大きく成長するための基盤を確立します。
UberやLyftのような企業は、電気自動車やハイブリッド車を配車することが増えており、利用者により持続可能な選択肢を提供しています。ZipcarやCar2Goも電気自動車やハイブリッド車を導入し、利用者に短期レンタルの選択肢を提供しています。消費者もまた、より便利で柔軟なサービスを求めており、それが新たなビジネスモデルやサービスの開発につながっています。例えば、UberやLyftは、オンデマンドの交通手段を提供するライドヘイリングサービスを導入しました。対照的に、ZipcarやCar2Goのようなカーシェアリングサービスは、時間貸しで柔軟な送迎オプションを提供しています。
自動車メーカーは、シェアードモビリティ・サービスに適した自動車を製造しています。これには、伝統的な自動車メーカーと、電気自動車や自律走行車に注力する企業が含まれます。シェアードモビリティ・プロバイダーは、車両を購入したりリースしたりして車両を保有します。また、カスタマイズされたソリューションを提供するために、自動車メーカーと提携するプロバイダーもあります。車両管理会社は、車両が適切に整備、点検され、必要に応じて修理されるようにする上で重要な役割を果たします。これには、定期的なメンテナンス、清掃、技術的な問題の解決などが含まれます。また、車両のスケジューリングも管理し、さまざまな場所での需要と供給の最適なバランスを確保します。
インターネットベースの技術の浸透、コネクテッドビークルの大量販売、インテリジェント交通システム(ITS)の普及は、この業界にプラスの影響を与えると予想される主要な技術的ブレークスルーのひとつです。統合されたウェブサービスは、V2X、V2I、V2V通信のような革新的な機能を車両に提供します。さらに、駐車場、渋滞、公共交通機関に関するリアルタイムの情報がますます利用可能になることで、今後数年間のシェアードモビリティ産業の成長がさらに促進されると思われます。
アーバンモビリティは、先進的な車両特性、デジタルインフラ、セクター横断的な利害関係者を組み合わせたものであり、今後数年間で著しい成長を示すと予想されます。デジタルインフラには、顧客の利便性を高めるためのリアルタイムの旅行情報の提供やコネクテッドトランスポートインフラが含まれます。また、この先進インフラには、電子財布、スマートカード、オンライン口座管理システムが含まれ、関連流通網を通じてシームレスな顧客体験のためのアクセス可能なワンストップ決済オプションが可能になります。
シェアードモビリティ市場レポートハイライト
- 二輪車セグメントは、2023年~2030年のCAGRが17.8%超と最速になると予測されます。二輪車は、その低コストと燃費効率の高さから、常に人気の高い移動手段となっています。シェアードモビリティ企業はこの動向を認識し、市場成長に対応するため、バイクシェアリングやスクーターシェアリングなどのシェアード二輪車サービスを提供し始めています。
- 2023年~2030年に、バイクシェアリングサービスモデル・セグメントが最も速いCAGRを記録すると予想されます。二輪車は混雑した市街地を移動する最速の手段と考えられているため、二輪車サービスは今後数年で盛んになると予想されます。
- 中東・アフリカは予測期間中に最も高いCAGRを記録すると予想されます。アラブ首長国連邦や南アフリカなどの国々では、企業旅行者の増加により、シェアード交通ソリューションに対する需要が高まっており、市場の成長を後押ししています。
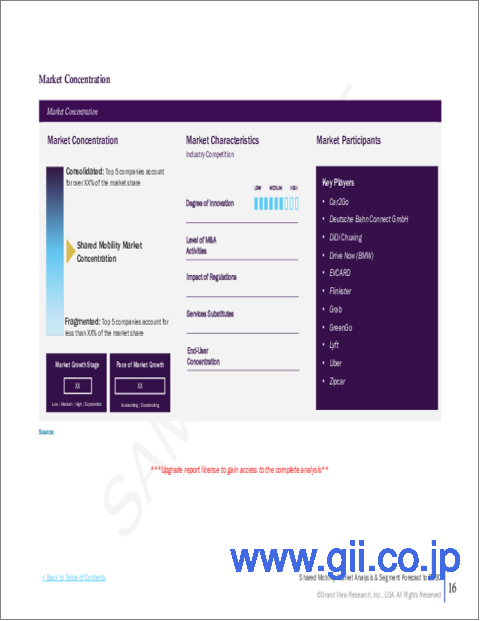
- 同市場で事業を展開している主な企業は、Uber、Car2Go、DiDi Chuxing、Drive Now(BMW)、Deutsche Bahn Connect GmbHなどです。
目次
第1章 調査手法と範囲
第2章 エグゼクティブサマリー
第3章 シェアードモビリティ市場:業界の展望
- 市場系統の見通し
- バリューチェーン分析
- 市場力学
- 業界分析ツール
- 業界ロードマップ:世界のシェアードモビリティ市場
- 主要なシェアードモビリティサービスプロバイダー間の比較(2022年)
- シェアードモビリティ市場:技術動向
- 規制状況:シェアードモビリティ市場
- COVID-19がシェアードモビリティ市場に与える影響
第4章 シェアードモビリティ市場:サービスモデルの推定・動向分析
- サービスモデルの変動分析と市場シェア(2022年・2030年)
- サービスモデル別
- 配車サービス
- 自転車シェアリング
- ライドシェアリング
- カーシェアリング
- その他
第5章 シェアードモビリティ市場:チャネルの推定・動向分析
- チャネルの変動分析と市場シェア(2022年・2030年)
- チャネル別
- オンライン
- オフライン
第6章 シェアードモビリティ市場:車両の推定・動向分析
- 車両の変動分析と市場シェア(2022年・2030年)
- 車両別
- 車
- 二輪車
- その他
第7章 地域の推定・動向分析
- シェアードモビリティ市場:地域展望
- 北米
- 北米のシェアードモビリティ市場の推定と予測(2018年~2030年)
- 米国
- カナダ
- 欧州
- 欧州のシェアードモビリティ市場の推定と予測(2018年~2030年)
- 英国
- ドイツ
- フランス
- イタリア
- スペイン
- アジア太平洋
- アジア太平洋のシェアードモビリティ市場の推定と予測(2018年~2030年)
- 中国
- 日本
- シンガポール
- インド
- ラテンアメリカ
- ラテンアメリカのシェアードモビリティ市場の推定と予測(2018年~2030年)
- ブラジル
- メキシコ
- 中東とアフリカ
- 中東とアフリカのシェアードモビリティ市場の推定と予測(2018年~2030年)
- 南アフリカ
- サウジアラビア
- アラブ首長国連邦
第8章 シェアードモビリティ市場:競合情勢
- 主要市場参入企業による最近の動向と影響分析
- Car2Go(ShareNow GmbH)
- Deutsche Bahn Connect GmbH
- Didi Chuxing
- DriveNow
- EvCard
- Flinkster
- Grab Holdings Limited
- GreenGo
- Lyft, Inc.
- Toyota Motor Corporation
- Docomo Bike Share Inc.
- Meitetsu Kyosho Co. Ltd.
- Nissan Retnal Solutions Co. Ltd.
- Earthcar Co. Ltd.
- Times Mobility Co. Ltd.
- Orix Corporation
- Tembici
- BlaBlaCar
- Uber Technologies Inc.
- Picap
- Cabify Espana SLU
- 99Taxi
- Zipcar Inc.
- 企業の分類
- 参入企業の概要
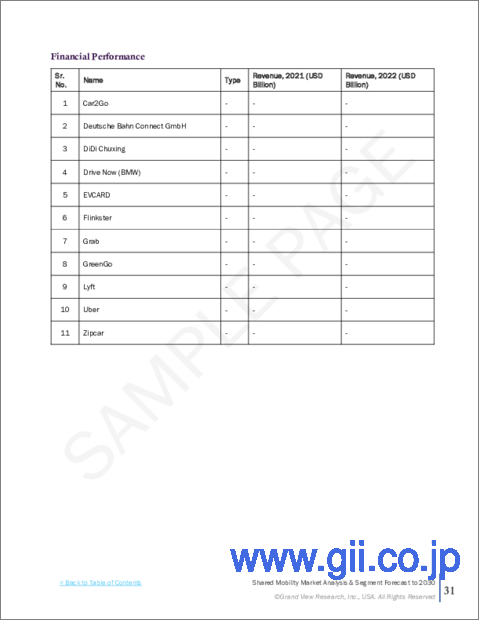
- 財務実績
- 製品のベンチマーク
- 企業の市場ポジショニング
- 企業の市場シェア分析(2022年)
- 企業ヒートマップ分析
- 戦略マッピング
- 事業拡張/売却
- 合併と買収
- コラボレーション/パートナーシップ
- 新製品の発売
List of Tables
- Table 1 Shared mobility market - Key market driver impact
- Table 2 Shared mobility market - Key market restraint impact
- Table 3 Comparison between leading shared mobility service providers, 2022
- Table 4 Shared Mobility Market Revenue Estimates and Forecast, By Service Model, 2018 - 2030 (USD Billion)
- Table 5 Shared Mobility Market Revenue Estimates and Forecast, By Service Model, 2018 - 2030 (USD Billion)
- Table 6 Shared Mobility Market Revenue Estimates and Forecast, By Channel, 2018 - 2030 (USD Billion)
- Table 7 Shared Mobility Market Revenue Estimates and Forecast, By Channel, 2018 - 2030 (USD Billion)
- Table 8 Shared Mobility Market Revenue Estimates and Forecast, By Vehicle, 2018 - 2030 (USD Billion)
- Table 9 Shared Mobility Market Revenue Estimates and Forecast, By Vehicle, 2018 - 2030 (USD Billion)
- Table 10 Recent Developments & Impact Analysis, By Key Market Participants
- Table 11 Company Heat Map Analysis
- Table 12 Key Companies undergoing expansions/divestitures.
- Table 13 Key Companies involved in M&As
- Table 14 Key Companies undergoing collaborations.
- Table 15 Key Companies launching new products.
List of Figures
- Fig. 1 Shared Mobility Market Segmentation
- Fig. 2 Information Procurement
- Fig. 3 Data Analysis Models
- Fig. 4 Market Formulation and Validation
- Fig. 5 Data Validating & Publishing
- Fig. 6 Market Snapshot
- Fig. 7 Segment Snapshot (1/2)
- Fig. 8 Segment Snapshot (2/2)
- Fig. 9 Competitive Landscape Snapshot
- Fig. 10 Shared Mobility Market- Industry Value Chain Analysis
- Fig. 11 Market Dynamics
- Fig. 12 Global Traffic Congestion Ranking in TCI (Traffic Congestion Index), 2022
- Fig. 13 Carbon Emission from Passenger Road Transportation Worldwide, 2010 - 2020
- Fig. 14 Global CO2 Emission By Transport Sector, 2019-2022 in Gt CO2
- Fig. 15 Average Per-Mile Vehicle Cost, 2017-2022
- Fig. 16 Number of electric LDV (Light Duty Vehicle) per public charging point and kW per electric LDV, 2022
- Fig. 17 Shared mobility market: PORTER's Analysis
- Fig. 18 Shared mobility market: PESTEL Analysis
- Fig. 19 Industry Roadmap - Shared Mobility Market
- Fig. 20 Levels of Automation
- Fig. 21 Vehicles by Autonomous-Driving (AD) Features, % of total vehicles sales
- Fig. 22 Shared Micromobility Ridership in the U.S. from 2011-2021 in Million Trips
- Fig. 23 Electric Car Sales, 2016-2023
- Fig. 24 Survey on risk of COVID-19 using shared mobility services
- Fig. 25 Shared Mobility Market, by Service Model: Key Takeaways
- Fig. 26 Shared Mobility Market, by Service Model: Market Share, 2022 & 2030
- Fig. 27 Ride-hailing service model market estimates & forecasts, 2018 - 2030 (USD Billion)
- Fig. 28 Bike sharing service model market estimates & forecasts, 2018 - 2030 (USD Billion)
- Fig. 29 Ride-sharing service model market estimates & forecasts, 2018 - 2030 (USD Billion)
- Fig. 30 Car sharing service model market estimates & forecasts, 2018 - 2030 (USD Billion)
- Fig. 31 Others service model market estimates & forecasts, 2018 - 2030 (USD Billion)
- Fig. 32 Shared Mobility Market, by Channel: Key Takeaways
- Fig. 33 Shared Mobility Market, by Channel: Market Share, 2022 & 2030
- Fig. 34 Online channel market estimates & forecasts, 2018 - 2030 (USD Billion)
- Fig. 35 Offline channel market estimates & forecasts, 2018 - 2030 (USD Billion)
- Fig. 36 Shared Mobility Market, by Vehicle: Key Takeaways
- Fig. 37 Shared Mobility Market, by Vehicle: Market Share, 2022 & 2030
- Fig. 38 Car's vehicle market estimates & forecasts, 2018 - 2030 (USD Billion)
- Fig. 39 Two-wheeler vehicles market estimates & forecasts, 2018 - 2030 (USD Billion)
- Fig. 40 Other vehicle market estimates & forecasts, 2018 - 2030 (USD Billion)
- Fig. 41 Shared Mobility Market Revenue by Region, 2022 & 2030 (USD Billion)
- Fig. 42 Regional marketplace: Key takeaways
- Fig. 43 North America shared mobility market estimates & forecasts, 2018 - 2030 (USD Billion)
- Fig. 44 U.S. shared mobility market estimates & forecasts, 2018 - 2030 (USD Billion)
- Fig. 45 Canada shared mobility market estimates & forecasts, 2018 - 2030 (USD Billion)
- Fig. 46 Europe shared mobility market estimates & forecasts, 2018 - 2030 (USD Billion)
- Fig. 47UK shared mobility market estimates & forecasts, 2018 - 2030 (USD Billion)
- Fig. 48 Germany shared mobility market estimates & forecasts, 2018 - 2030 (USD Billion)
- Fig. 49 France shared mobility market estimates & forecasts, 2018 - 2030 (USD Billion)
- Fig. 50 Italy shared mobility market estimates & forecasts, 2018 - 2030 (USD Billion)
- Fig. 51 Spain shared mobility market estimates & forecasts, 2018 - 2030 (USD Billion)
- Fig. 52 Asia Pacific shared mobility market estimates & forecasts, 2018 - 2030 (USD Billion)
- Fig. 53 China shared mobility market estimates & forecasts, 2018 - 2030 (USD Billion)
- Fig. 54 Japan shared mobility market estimates & forecasts, 2018 - 2030 (USD Billion)
- Fig. 55 Singapore shared mobility market estimates & forecasts, 2018 - 2030 (USD Billion)
- Fig. 56 India shared mobility market estimates & forecasts, 2018 - 2030 (USD Billion)
- Fig. 57 Latin America shared mobility market estimates & forecasts, 2018 - 2030 (USD Billion)
- Fig. 58 Brazil shared mobility market estimates & forecasts, 2018 - 2030 (USD Billion)
- Fig. 59 Mexico shared mobility market estimates & forecasts, 2018 - 2030 (USD Billion)
- Fig. 60 Middle East and Africa shared mobility market estimates & forecasts, 2018 - 2030 (USD Billion)
- Fig. 61 South Africa shared mobility market estimates & forecasts, 2018 - 2030 (USD Billion)
- Fig. 62 Saudi Arabia shared mobility market estimates & forecasts, 2018 - 2030 (USD Billion)
- Fig. 63 UAE shared mobility market estimates & forecasts, 2018 - 2030 (USD Billion)
- Fig. 64 Key Company Categorization
- Fig. 65 Company Market Positioning
- Fig. 66 Company Market Share Analysis, 2022
- Fig. 67 Strategic framework
Shared Mobility Market Growth & Trends:
The global shared mobility market size is expected to reach USD 675.36 billion by 2030, according to a new report by Grand View Research, Inc. The market is expected to grow at a CAGR of 14.8% from 2023 to 2020. This growth is driven by the widespread adoption of mobile apps that enable users to access, and book carpools quickly and easily. These apps provide real-time information on vehicle availability, pricing, and location, making it easier for users to plan their trips and navigate the city. The use of electric and hybrid vehicles in the market is expected to grow in the coming years as cities and governments increasingly prioritize sustainable transportation solutions to reduce carbon emissions and improve air quality.
In February 2023, Uber Technologies signed a Memorandum of Understanding (MoU) with Tata Motors to advance sustainable mobility in India. The collaboration will aid in the electrification of Uber services across major cities in India, including Kolkata, Mumbai, Chennai, Hyderabad, Delhi NCR, Bengaluru, and Ahmedabad. The collaboration with Tata Motors will establish the groundwork for a significant growth of four-wheeler EVs on an Indian mobility platform.
Companies like Uber and Lyft are increasingly offering electric and hybrid vehicles as a part of their fleets, providing riders with a more sustainable option. Zipcar and Car2Go also introduced electric and hybrid vehicles to their fleet, giving users access to better short-term rental options. Consumers also demand more convenience and flexibility in the services, which has led to the development of new business models and services. For example, Uber and Lyft have introduced ride-hailing services that offer on-demand transportation. In contrast, car-sharing services like Zipcar and Car2Go provide flexible pick-up and drop-off options for hourly rentals.
Automakers produce vehicles suitable for shared mobility services. This includes traditional car manufacturers and companies focused on electric and autonomous vehicles. Shared mobility providers may purchase or lease vehicles to build their fleets. Some providers may also partner with vehicle manufacturers for customized solutions. Fleet management companies play a crucial role in ensuring vehicles are properly maintained, inspected, and repaired as needed. This involves routine maintenance, cleaning, and resolving technical issues. They also manage vehicle scheduling, ensuring an optimal balance of supply and demand across different locations.
Rising penetration of internet-based technologies, mass marketing of connected vehicles, and the prevalence of intelligent transportation systems (ITS) are among the key technological breakthroughs expected to positively impact the industry. The integrated web services provide vehicles with innovative features like V2X, V2I, and V2V communication. Moreover, the increasing availability of real-time information for parking, congestion, and public transit will further propel the shared mobility industry's growth over the coming years.
Urban mobility is anticipated to showcase tremendous growth over the coming years, which combines advanced vehicle characteristics, digital infrastructure, and cross-sector stakeholders. The digital infrastructure involves the provision of real-time travel information and connected transport infrastructure for the convenience of the customers. Also, this advanced infrastructure includes e-wallets, smart cards, and online account management systems, which allow accessible and one-stop payment options for seamless customer experience via relevant distribution networks.
Shared Mobility Market Report Highlights:
- The two-wheeler vehicle segment is anticipated to witness the fastest CAGR of over 17.8% from 2023 to 2030. Two-wheelers have always been a popular mode of transportation due to their low cost and fuel efficiency. Shared mobility companies have recognized this trend and have started to offer shared two-wheeler services, such as bike-sharing and scooter-sharing to cater to the market growth
- The bike-sharing service model segment is expected to register the fastest CAGR from 2023 to 2030. Two-wheeler services are expected to flourish in the coming years as two-wheelers are considered the fastest way to travel on congested city streets
- Middle East and Africa is anticipated to register the highest CAGR over the forecast period. The growing demand for shared transportation solutions due to increased corporate travelers in countries such as the UAE and South Africa encourages market growth
- The major companies operating in the market are Uber, Car2Go, DiDi Chuxing, Drive Now (BMW), and Deutsche Bahn Connect GmbH
Table of Contents
Chapter 1 Methodology and Scope
- 1.1 Market Segmentation & Scope
- 1.2 Market Definitions
- 1.3 Information Procurement
- 1.3.1 Information Analysis
- 1.3.2 Market Formulation & Data Visualization
- 1.3.3 Data Validation & Publishing
- 1.4 Research Scope and Assumptions
- 1.4.1 List of Data Sources
Chapter 2 Executive Summary
- 2.1 Shared Mobility Market Snapshot
- 2.2 Shared Mobility - Segment Snapshot (1/2)
- 2.3 Shared Mobility - Segment Snapshot (2/2)
- 2.4 Shared Mobility - Competitive Landscape Snapshot
Chapter 3 Shared Mobility Market- Industry Outlook
- 3.1 Market Lineage Outlook
- 3.2 Value Chain Analysis
- 3.3 Market Dynamics
- 3.3.1 Market Driver Analysis
- 3.3.1.1 Increasing traffic congestion due to urbanization
- 3.3.1.2 increasing demand for sustainable transportation
- 3.3.1.3 Rising cost of vehicle ownership globally
- 3.3.2 Market Restraint Analysis
- 3.3.2.1 Lack of charging infrastructure and facility
- 3.3.3 Market Challenges Analysis
- 3.3.4 Market Opportunities Analysis
- 3.3.1 Market Driver Analysis
- 3.4 Industry Analysis Tools
- 3.4.1 Porter's Analysis
- 3.4.2 Macroeconomic Analysis
- 3.5 Industry Roadmap - Global Shared Mobility Market
- 3.6 Comparison Between Leading Shared Mobility Service Providers, 2022
- 3.7 Shared Mobility Market - Technology Trends
- 3.7.1 Robo-Taxi
- 3.7.2 Shared E-Bikes And Shared Micro Mobility
- 3.7.3 Electromobility
- 3.7.4 Urban Air Mobility (UAM)
- 3.8 Regulatory Landscape - Shared Mobility Market
- 3.8.1 North America
- 3.8.2 Europe
- 3.8.3 Asia Pacific
- 3.8.4 Latin America
- 3.8.5 Middle East And Africa
- 3.9 Impact of COVID-19 on Shared Mobility Market
Chapter 4 Shared Mobility Market: Service Model Estimates & Trend Analysis
- 4.1 Service Model Movement Analysis & Market Share, 2022 & 2030
- 4.2 Shared Mobility Market Estimates & Forecast, By Service Model (USD Billion)
- 4.2.1 Ride Hailing
- 4.2.2 Bike Sharing
- 4.2.3 Ride Sharing
- 4.2.4 Car Sharing
- 4.2.5 Others
Chapter 5 Shared Mobility Market: Channel Estimates & Trend Analysis
- 5.1 Service Model Movement Analysis & Market Share, 2022 & 2030
- 5.2 Shared Mobility Market Estimates & Forecast, By Channel (USD Billion)
- 5.2.1 Online
- 5.2.2 Offline
Chapter 6 Shared Mobility Market: Vehicle Estimates & Trend Analysis
- 6.1 Service Model Movement Analysis & Market Share, 2022 & 2030
- 6.2 Shared Mobility Market Estimates & Forecast, By Vehicle (USD Billion)
- 6.2.1 Cars
- 6.2.2 Two-Wheelers
- 6.2.3 Others
Chapter 7 Regional Estimates & Trend Analysis
- 7.1 Shared Mobility Market: Regional Outlook
- 7.2 North America
- 7.2.1 North America Shared Mobility Market Estimates & Forecasts, 2018 - 2030 (USD Billion)
- 7.2.2 U.S.
- 7.2.2.1 U.S. Shared Mobility Market Estimates & Forecasts, 2018 - 2030 (USD Billion)
- 7.2.3 Canada
- 7.2.3.1 Canada Shared Mobility Market Estimates & Forecasts, 2018 - 2030 (USD Billion)
- 7.3 Europe
- 7.3.1 Europe Shared Mobility Market Estimates & Forecasts, 2018 - 2030 (USD Billion)
- 7.3.2 UK
- 7.3.2.1 UK Shared Mobility Market Estimates & Forecasts, 2018 - 20302030 (USD Billion)
- 7.3.3 Germany
- 7.3.3.1 Germany Shared Mobility Market Estimates & Forecasts, 2018 - 2030 (USD Billion)
- 7.3.4 France
- 7.3.4.1 France Shared Mobility Market Estimates & Forecasts, 2018 - 2030 (USD Billion)
- 7.3.5 Italy
- 7.3.5.1 Italy Shared Mobility Market Estimates & Forecasts, 2018 - 2030 (USD Billion)
- 7.3.6 Spain
- 7.3.6.1 Spain Shared Mobility Market Estimates & Forecasts, 2018 - 2030 (USD Billion)
- 7.4 Asia Pacific
- 7.4.1 Asia Pacific Shared Mobility Market Estimates & Forecasts, 2018 - 2030 (USD Billion)
- 7.4.2 China
- 7.4.2.1 China Shared Mobility Market Estimates & Forecasts, 2018 - 2030 (USD Billion)
- 7.4.3 Japan
- 7.4.3.1 Japan Shared Mobility Market Estimates & Forecasts, 2018 - 2030 (USD Billion)
- 7.4.4 Singapore
- 7.4.4.1 Singapore Shared Mobility Market Estimates & Forecasts, 2018 - 2030 (USD Billion)
- 7.4.5 India
- 7.4.5.1 India Shared Mobility Market Estimates & Forecasts, 2018 - 2030 (USD Billion)
- 7.5 Latin America
- 7.5.1 Latin America Shared Mobility Market Estimates & Forecasts, 2018 - 2030 (USD Billion)
- 7.5.2 Brazil
- 7.5.2.1 Brazil Shared Mobility Market Estimates & Forecasts, 2018 - 2030 (USD Billion)
- 7.5.3 Mexico
- 7.5.3.1 Mexico Shared Mobility Market Estimates & Forecasts, 2018 - 2030 (USD BILLION)
- 7.6 Middle East and Africa
- 7.6.1 Middle East And Africa Shared Mobility Market Estimates & Forecasts, 2018 - 20302030 (USD Billion)
- 7.6.2 South Africa
- 7.6.2.1 South Africa Shared Mobility Market Estimates & Forecasts, 2018 - 2030 (USD Billion)
- 7.6.3 Saudi Arabia
- 7.6.3.1 Saudi Arabia Shared Mobility Market Estimates & Forecasts, 2018 - 2030 (USD Billion)
- 7.6.4 UAE
- 7.6.4.1 UAE Shared Mobility Market Estimates & Forecasts, 2018 - 2030 (USD Billion)
Chapter 8 Shared Mobility Market - Competitive Landscape
- 8.1 Recent Developments & Impact Analysis, By Key Market Participants
- 8.1.1 Car2Go (ShareNow GmbH)
- 8.1.2 Deutsche Bahn Connect GmbH
- 8.1.3 Didi Chuxing
- 8.1.4 DriveNow
- 8.1.5 EvCard
- 8.1.6 Flinkster
- 8.1.7 Grab Holdings Limited
- 8.1.8 GreenGo
- 8.1.9 Lyft, Inc.
- 8.1.10 Toyota Motor Corporation
- 8.1.11 Docomo Bike Share Inc.
- 8.1.12 Meitetsu Kyosho Co. Ltd.
- 8.1.13 Nissan Retnal Solutions Co. Ltd.
- 8.1.14 Earthcar Co. Ltd.
- 8.1.15 Times Mobility Co. Ltd.
- 8.1.16 Orix Corporation
- 8.1.17 Tembici
- 8.1.18 BlaBlaCar
- 8.1.19 Uber Technologies Inc.
- 8.1.20 Picap
- 8.1.21 Cabify Espana S.L.U.
- 8.1.22 99Taxi
- 8.1.23 Zipcar Inc.
- 8.2 Recent Developments & Impact Analysis, By Key Market Participants
- 8.3 Company Categorization
- 8.4 Participant's Overview
- 8.5 Financial Performance
- 8.6 Product Benchmarking
- 8.7 Company Market Positioning
- 8.8 Company Market Share Analysis, 2022
- 8.9 Company Heat Map Analysis
- 8.10 Strategy Mapping
- 8.10.1 Expansion/Divestiture
- 8.10.2 Mergers & Acquisition
- 8.10.3 Collaborations/Partnerships
- 8.10.4 New Product Launches