|
|
市場調査レポート
商品コード
1076680
水上太陽光発電パネルの世界市場 - 市場規模・シェア・動向分析:製品別(追尾型、定置型)、地域別(アジア太平洋、北米、欧州、中東・アフリカ)、セグメント別の予測(2022年~2030年)Floating Solar Panels Market Size, Share & Trends Analysis Report By Product (Tracking, Stationary), By Region (Asia Pacific, North America, Europe, Middle East & Africa) And Segment Forecasts, 2022 - 2030 |
||||||
|
|
|||||||
|
● お客様のご希望に応じて、既存データの加工や未掲載情報(例:国別セグメント)の追加などの対応が可能です。 詳細はお問い合わせください。 |
|||||||


| 水上太陽光発電パネルの世界市場 - 市場規模・シェア・動向分析:製品別(追尾型、定置型)、地域別(アジア太平洋、北米、欧州、中東・アフリカ)、セグメント別の予測(2022年~2030年) |
|
出版日: 2022年04月28日
発行: Grand View Research
ページ情報: 英文 130 Pages
納期: 2~10営業日
|
- 全表示
- 概要
- 図表
- 目次
世界の水上太陽光発電パネルの市場規模は、2030年に1億8,021万米ドルに達し、2022年~2030年にCAGRで22.5%の成長が予測されています。
水上太陽光発電技術の技術的側面は、発電のための信頼できる再生可能エネルギー源への需要の高まりにより、予測期間中に大幅な成長が見られると予測されています。また、土地関連コストの削減が、予測期間中の需要を押し上げる可能性があります。
当レポートでは、世界の水上太陽光発電パネル市場について調査分析し、市場の動向、製品・地域別の展望、競合情勢などを提供しています。
目次
第1章 調査手法と範囲
第2章 エグゼクティブサマリー
第3章 市場の定義
第4章 水上太陽光発電パネル市場の変数・動向・範囲
- 市場規模と成長見通し
- 業界のバリューチェーン分析
- 原材料の動向
- 市場力学
- 浸透と成長見通しのマッピング
- 規制の枠組み
- 事業環境分析ツール
- 水上太陽光発電パネル市場に対するコロナウイルスの影響
第5章 水上太陽光発電パネル市場の展望:製品別
- 市場規模の推計・予測・動向分析(2019年~2030年)
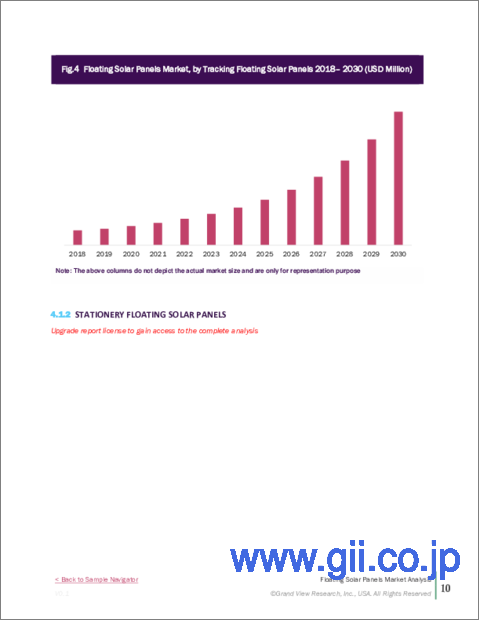
- 追尾型水上太陽光発電パネル
- 定置型水上太陽光発電パネル
第6章 水上太陽光発電パネルの展望:地域別
- 水上太陽光発電パネル市場:地域別(2019年・2027年)
- 北米
- 米国
- 欧州
- アジア太平洋
- 中国
- インド
- 日本
- 韓国
- 中南米
- 中東・アフリカ
第7章 競合情勢
- Kyocera Corporation
- Trina Solar
- Yellow Tropus Pvt. Ltd.
- Wuxi Suntech Power Co., Ltd.
- Yingli Solar
- Ciel & Terre International
- Longi Solar
- Ja Solar Technology Co. Ltd.
- Hanwha Group
- Vikram Solar Limited
- Gcl-Si
- Talesun
- Pristine Sun Corp.
- Sharp Corporation
- Itochu Corporation
List of Tables
- TABLE 1 Global Floating Solar Panels Market 2019 - 2030 (MW, USD Million)
- TABLE 2 Global Floating Solar Panels Market estimates and forecasts by Application, (MW, USD Million), 2019 - 2030
- TABLE 3 Global Floating Solar Panels Market estimates and forecasts by Application, (MW, USD Million), 2019 - 2030
- TABLE 4 Floating Solar Panels - Key Market Restraint
- TABLE 5 Global Tracking Floating Solar Panels market by region 2019 - 2030 (MW, USD Million)
- TABLE 6 Global Stationery Floating Solar Panels Market by region 2019 - 2030 (MW, USD Million)
- TABLE 7 North America Floating Solar Panels market by Product 2019 - 2030 (MW, USD Million)
- TABLE 8 U.S. Floating Solar Panels market by Capacity 2019 - 2030 (MW, USD Million)
- TABLE 9 Europe Floating Solar Panels market by Product 2019 - 2030 (MW, USD Million)
- TABLE 10 Asia Pacific Floating Solar Panels market by Product 2019 - 2030 (MW, USD Million)
- TABLE 11 India Floating Solar Panels market by Product 2019 - 2030 (MW, USD Million)
- TABLE 12 China Floating Solar Panels market by Product 2019 - 2030 (MW, USD Million)
- TABLE 13 Japan Floating Solar Panels market by Product 2019 - 2030 (MW, USD Million)
- TABLE 14 South Korea Floating Solar Panels market by Product 2019 - 2030 (MW, USD Million)
- TABLE 15 CSA Floating Solar Panels market by Product 2019 - 2030 (MW, USD Million)
- TABLE 16 MEA Floating Solar Panels market by Product 2019 - 2030 (MW, USD Million)
List of Figures
- Fig. 1 Market segmentation & scope
- Fig. 2 Floating Solar Panels market size and growth prospects
- Fig. 3 Floating Solar Panels Value chain analysis
- Fig. 4 Market Dynamics
- Fig. 5 Floating Solar Panels market - Penetration & Growth Prospect Mapping
- Fig. 6 Porter's Five Forces Analysis
- Fig. 7 PEST Analysis for Floating Solar Panels Industry
- Fig. 8 Floating Solar Panels Market: Product Movement Analysis 2021 & 2030
- Fig. 9 Floating Solar Panels Market: Regional Movement Analysis 2021 & 2030
Floating Solar Panels Market Growth & Trends:
The global floating solar panels market size is expected to reach USD 180.21 million by 2030, according to a new report by Grand View Research, Inc. The market is expected to expand at a CAGR of 22.5% from 2022 to 2030. The technical aspect of floating solar technology is projected to observe substantial growth over the estimated period owing to the growing demand for dependable renewable sources of energy for power generation. In addition, the reduction in land-related costs is likely to boost the demand over the forecast period. The stationary floating solar panels segment led the market in 2021. The segment is expected to keep its leading position over the forecast period. Stationary floating solar panels do not take up land area and are easy to install. These panels can be deployed easily on a body of water, such as a reservoir or a lake.
Stationary floating solar panels also double as shades for the water body, which reduces the evaporation of water. The increasing emphasis by various governments on the usage of renewable sources of energy for electricity generation coupled with efforts towards decreasing environmental pollution by reducing the dependence on fossil fuels is likely to have a positive influence on the market over the forecast period. Tracking floating solar panels are projected to witness increased demand over the forecast period owing to the augmented efficiency of the panels with a tracking technique. The increasing investments in R&D by manufacturers and installers to decrease the cost of the tracking technology are expected to strengthen market growth. Japan was the largest country-level market in 2019 due to the low availability of land and promising government initiatives to encourage the usage of renewable energy.
Floating Solar Panels Market Report Highlights:
- In terms of revenue, the stationary floating solar panels segment accounted for a prominent share in the market in 2021 and is further expected to witness steady growth over the forecast period
- in 2021, Asia Pacific accounted for the largest revenue share. Countries like Japan and China are investing heavily into the adoption of floating solar panels, which drives the market growth
- Various strategic initiatives were recorded over the past few years to boost the growth of the market
- For instance, in October 2018, KYOCERA Corp. formed a joint venture with Tokyo Century to open the largest floating solar park in Japan
- The floating solar park has a capacity of 13.7MW and is installed in Yamakura Dam reservoir in Ichihara, Chiba Prefecture, Japan
Table of Contents
Chapter 1. Methodology and Scope
- 1.1. Market Segmentation & Scope
- 1.2. Information Procurement
- 1.2.1. Purchased Database
- 1.2.2. GVR's Internal Database
- 1.2.3. Secondary Sources & Third-Party Perspectives
- 1.2.4. Primary Research
- 1.3. Information Analysis
- 1.3.1. Data Analysis Models
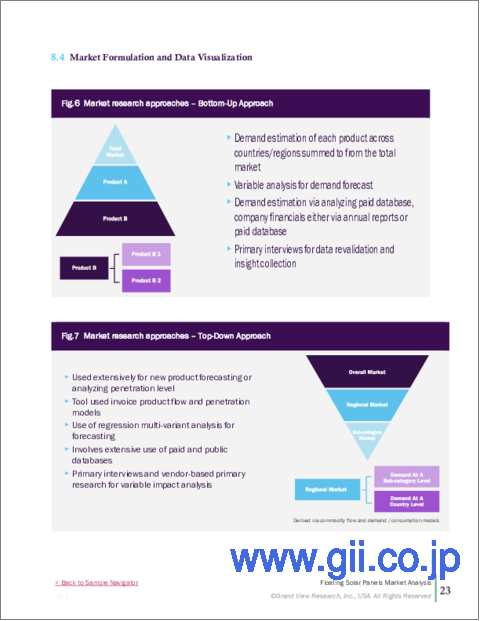
- 1.4. Market Formulation & Data Visualization
- 1.5. Data Validation & Publishing
Chapter 2. Executive Summary
Chapter 3. Market Definitions
Chapter 4. Floating Solar Panels Market Variables, Trends & Scope
- 4.1. Market Size and Growth Prospects
- 4.2. Industry Value Chain Analysis
- 4.3. Raw Material Trends
- 4.4. Market Dynamics
- 4.4.1. Market Driver Analysis
- 4.4.2. Market Restraint Analysis
- 4.4.3. Opportunity Assessment
- 4.5. Penetration & Growth Prospect Mapping
- 4.6. Regulatory Framework
- 4.7. Business Environment Analysis Tools
- 4.7.1. Industry Analysis - Porter's
- 4.7.2. PESTEL Analysis
- 4.8. Impact of Corona Virus on Floating Solar Panels Market
Chapter 5. Floating Solar Panels Market Product Outlook
- 5.1. Market Size Estimates & Forecasts and Trend Analysis 2019 - 2030 (Installed Capacity, MW; Revenue, USD Million)
- 5.2. Tracking Floating Solar Panels
- 5.2.1. Market Estimates And Forecasts By Region 2019 - 2030 (Installed Capacity, MW, Revenue, USD Million)
- 5.3. Stationary Floating Solar Panels
- 5.3.1. Market Estimates And Forecasts By Region 2019 - 2030 (Volume, MW, Revenue, USD Million)
Chapter 6. Floating Solar Panels Regional Outlook
- 6.1. Floating Solar Panels Market, By Region, 2019 & 2027
- 6.2. North America
- 6.2.1. Market Estimates And Forecasts By Product 2019 - 2030 (Installed Capacity, MW Revenue, USD Million)
- 6.2.2. U.S.
- 6.2.2.1. Market Estimates And Forecasts By Product 2019 - 2030 (Installed Capacity, MW Revenue, USD Million)
- 6.3. Europe
- 6.3.1. Market Estimates And Forecasts By Product 2019 - 2030 (Installed Product, MW Revenue, USD Million)
- 6.4. Asia Pacific
- 6.4.1. Market Estimates And Forecasts By Product 2019 - 2030 (Installed Capacity, MW Revenue, USD Million)
- 6.4.2. China
- 6.4.2.1. Market Estimates And Forecasts By Product 2019 - 2030 (Installed Capacity, MW Revenue, USD Million)
- 6.4.3. India
- 6.4.3.1. Market Estimates And Forecasts By Product 2019 - 2030 (Installed Capacity, MW Revenue, USD Million)
- 6.4.4. Japan
- 6.4.4.1. Market Estimates And Forecasts By Product 2019 - 2030 (Installed Capacity, MW Revenue, USD Million)
- 6.4.5. South Korea
- 6.4.5.1. Market Estimates And Forecasts By Product 2019 - 2030 (Installed Capacity, MW Revenue, USD Million)
- 6.5. Central & South America
- 6.5.1. Market Estimates And Forecasts By Product 2019 - 2030 (Installed Capacity, MW Revenue, USD Million)
- 6.6. MEA
- 6.6.1. Market Estimates And Forecasts By Product 2019 - 2030 (Installed Capacity, MW Revenue, USD Million)
Chapter 7. Competitive Landscape
- 7.1. Kyocera Corporation
- 7.1.1. Company Overview
- 7.1.2. Financial Performance
- 7.1.3. Product Benchmarking
- 7.1.4. Recent Developments
- 7.2. Trina Solar
- 7.2.1. Company Overview
- 7.2.2. Financial Performance
- 7.2.3. Product Benchmarking
- 7.2.4. Recent Developments
- 7.3. Yellow Tropus Pvt. Ltd.
- 7.3.1. Company Overview
- 7.3.2. Financial Performance
- 7.3.3. Product Benchmarking
- 7.3.4. Recent Developments
- 7.4. Wuxi Suntech Power Co., Ltd.
- 7.4.1. Company Overview
- 7.4.2. Financial Performance
- 7.4.3. Product Benchmarking
- 7.4.4. Recent Developments
- 7.5. Yingli Solar
- 7.5.1. Company Overview
- 7.5.2. Financial Performance
- 7.5.3. Product Benchmarking
- 7.5.4. Recent Developments
- 7.6. Ciel & Terre International
- 7.6.1. Company Overview
- 7.6.2. Financial Performance
- 7.6.3. Product Benchmarking
- 7.6.4. Recent Developments
- 7.7. Longi Solar
- 7.7.1. Company Overview
- 7.7.2. Financial Performance
- 7.7.3. Product Benchmarking
- 7.7.4. Recent Developments
- 7.8. Ja Solar Technology Co. Ltd.
- 7.8.1. Company Overview
- 7.8.2. Financial Performance
- 7.8.3. Product Benchmarking
- 7.8.4. Recent Developments
- 7.9. Hanwha Group
- 7.9.1. Company Overview
- 7.9.2. Financial Performance
- 7.9.3. Product Benchmarking
- 7.9.4. Recent Developments
- 7.10. Vikram Solar Limited
- 7.10.1. Company Overview
- 7.10.2. Financial Performance
- 7.10.3. Product Benchmarking
- 7.10.4. Recent Developments
- 7.11. Gcl-Si
- 7.11.1. Company Overview
- 7.11.2. Financial Performance
- 7.11.3. Product Benchmarking
- 7.11.4. Recent Developments
- 7.12. Talesun
- 7.12.1. Company Overview
- 7.12.2. Financial Performance
- 7.12.3. Product Benchmarking
- 7.12.4. Recent Developments
- 7.13. Pristine Sun Corp.
- 7.13.1. Company Overview
- 7.13.2. Financial Performance
- 7.13.3. Product Benchmarking
- 7.13.4. Recent Developments
- 7.14. Sharp Corporation
- 7.14.1. Company Overview
- 7.14.2. Financial Performance
- 7.14.3. Product Benchmarking
- 7.14.4. Recent Developments
- 7.15. Itochu Corporation
- 7.15.1. Company Overview
- 7.15.2. Financial Performance
- 7.15.3. Product Benchmarking
- 7.15.4. Recent Developments