|
|
市場調査レポート
商品コード
1268759
アルミ箔の市場規模、シェア、動向分析レポート製品別(包装用箔、容器用箔)、最終用途別(包装、産業)、地域別、セグメント予測、2023年~2030年Aluminum Foil Market Size, Share & Trends Analysis Report By Product (Wrapper Foils, Container Foils), By End-use (Packaging, Industrial), By Region, And Segment Forecasts, 2023 - 2030 |
||||||
|
|
|||||||
|
● お客様のご希望に応じて、既存データの加工や未掲載情報(例:国別セグメント)の追加などの対応が可能です。 詳細はお問い合わせください。 |
|||||||


| アルミ箔の市場規模、シェア、動向分析レポート製品別(包装用箔、容器用箔)、最終用途別(包装、産業)、地域別、セグメント予測、2023年~2030年 |
|
出版日: 2023年04月05日
発行: Grand View Research
ページ情報: 英文 120 Pages
納期: 2~10営業日
|
- 全表示
- 概要
- 図表
- 目次
アルミ箔の市場成長と動向:
Grand View Research, Inc.の新しいレポートによると、世界のアルミ箔の市場規模は、予測期間中に5.5%のCAGRをで成長し、2030年までに395億8,000万米ドルに達すると予想されています。
電気自動車(EV)産業への投資の増加、飲食品、製薬産業からの包装需要の高まり、さらにカーボンフットプリント削減に関する政府の好意的な政策が、市場の成長を後押ししています。
世界中の政府は、EVの生産を奨励しています。例えば、2021年、フランス政府は、原子力&再生可能エネルギー源、電気自動車、半導体、ロボットなどの分野で300億ユーロ(~321億米ドル)相当の産業復興計画を発表し、産業部門を復活させました。この計画の中で、交通・モビリティに40億ユーロ(~43億米ドル)を割り当て、2030年までに200万台のEVおよびハイブリッド車を生産することを目標としています。
アルミ箔は、0.006mmからISO規格の上限である0.2mmまでの薄いアルミニウム板です。高熱伝導性、耐熱性、低密度、防湿性、非吸収性などの特性により、さまざまな最終用途産業での需要が高まっています。現在の市場動向では、ラッパーホイルの人気が高まっており、これは予測期間中も続くと予想されています。軽量で柔軟性があり、無害であることから、パッケージング業界において着実に需要が増加しています。
地域別に見ると、2021年の世界市場ではアジア太平洋地域が最大の収益シェアを占めています。同地域では、2021年に中国が最も高い収益シェアを占めていましたが、当該予測期間にはインドが最も速い成長率を記録することになるでしょう。さまざまな最終用途産業からの需要の高まりは、予測期間を通じてアルミ箔の使用を促進します。
世界のアルミ箔市場は、競争が激しいです。最終用途産業の主要プレーヤーは後方統合されており、原材料へのアクセス、価格変動に対するより良いコントロール、および顧客アクセスの改善を持っています。2021年は、能力拡張と買収のための投資が示されました。例えば、2021年4月、ANG Lifesciences IndiaはMansa Print and Publisher Ltd.を買収しました。この戦略的な後方統合は、医薬品事業におけるANGの足跡を拡大することを目的としています。
アルミ箔市場レポートハイライト
- 製品別では、コンテナフォイルが2023年から2030年にかけて、収益ベースで最も速いCAGR 6.7%で成長すると予測されます。この成長は、都市化の進展、労働人口の増加、それに伴う包装食品の需要増に起因しています。
- 最終用途に基づくと、包装は2023年から2030年にかけて、収益ベースで5.9%のCAGRをで成長すると予測されます。アルミ箔パッケージは、飲食品、製薬産業で消費されています。
- 包装の最終用途セグメントは、さらに飲食品、タバコ、医薬品、その他に分けられます。飲食品は、予測期間中の収益で、6.1%という最も高いCAGRをで成長すると思われます。成長の要因は、持ち帰り用食品と加工食品の需要増にあります。
- 地域別では、アジア太平洋が予測期間中、収益ベースで最も高いCAGR 6.3%をで成長すると予想されます。EV産業が重視され、パッケージ食品の生産が増加していることが、同地域の成長を促進しています。
目次
第1章 調査手法と範囲
- 市場セグメンテーションと範囲
- 市場の定義
- 情報調達
- 情報分析
- データ分析モデル
- 市場の形成とデータの視覚化
- データの検証と公開
- 調査範囲と前提条件
- データソースのリスト
第2章 エグゼクティブサマリー
- 市場の見通し
- セグメント別の見通し
- 競争力の見通し
第3章 市場変数、動向、および範囲
- 市場系統の見通し
- 世界のアルミ箔市場
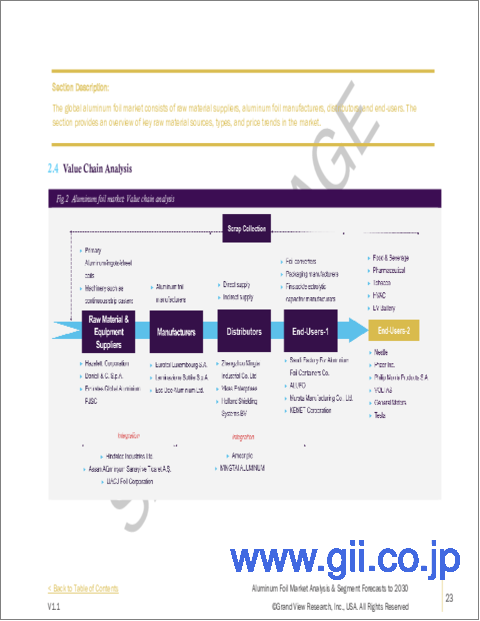
- 業界のバリューチェーン分析
- 原材料の動向
- 技術概要
- 規制の枠組み
- 市場力学
- 市場促進要因の分析
- 市場抑制要因分析
- 市場機会分析
- 市場の課題
- ポーターのファイブフォース分析
- 供給企業の交渉力
- 買い手の交渉力
- 代替の脅威
- 新規参入業者の脅威
- 競争企業間の敵対関係
- PESTLE分析
- 政治的
- 経済的
- 社会的情勢
- テクノロジー
- 環境
- 法的
第4章 アルミ箔市場:製品の見通し予測と傾向
- 定義と範囲
- アルミ箔市場:製品変動分析、2022年および2030年
- 包装用箔
- 市場の推定と予測、2018~2030年(100万米ドル)(キロトン)
- 容器用箔
- 市場の推定と予測、2018~2030年(100万米ドル)(キロトン)
- ホイル蓋
- 市場の推定と予測、2018~2030年(100万米ドル)(キロトン)
- パウチ
- 市場の推定と予測、2018~2030年(100万米ドル)(キロトン)
- ブリスターパック
- 市場の推定と予測、2018~2030年(100万米ドル)(キロトン)
- その他
- 市場の推定と予測、2018~2030年(100万米ドル)(キロトン)
第5章 アルミ箔市場:最終用途の推定・動向分析
- 定義と範囲
- アルミ箔市場:最終用途の変動分析、2022年および2030年
- 包装
- 市場の推定と予測、2018~2030年(100万米ドル)(キロトン)
- 飲食品別、2018-2030
- 医薬品別、2018~2030年
- タバコ別、2018-2030
- 他者別、2018~2030年
- 産業用
- 市場の推定と予測、2018~2030年(100万米ドル)(キロトン)
- HVAC別、2018~2030
- EVバッテリー別、2018年~2030年
- 他者別、2018~2030年
第6章 アルミ箔市場:地域推定・動向分析
- 地域分析、2022年と2030年
- 北米
- 製品別、2018~2030年
- 最終用途別、2018~2030年
- 米国
- カナダ
- メキシコ
- 欧州
- 製品別、2018~2030年
- 最終用途別、2018~2030年
- ドイツ
- 英国
- イタリア
- トルコ
- ロシア
- アジア太平洋地域
- 製品別、2018~2030年
- 最終用途別、2018~2030年
- 中国
- インド
- 日本
- 韓国
- インドネシア
- 中南米
- 製品別、2018~2030年
- 最終用途別、2018~2030年
- ブラジル
- アルゼンチン
- 中東とアフリカ
- 製品別、2018~2030年
- 最終用途別、2018~2030年
- サウジアラビア
- 南アフリカ
第7章 競合情勢
- 主要市場参入企業別最近の動向と影響分析
- 会社の分類
- 企業ランキング
- ヒートマップ分析
- ベンダー情勢
- List of raw material suppliers, key manufacturers, and distributors
- List of prospective end-users
- 戦略マッピング
- 企業プロファイル・一覧表
- ACM Carcano
- 会社概要
- 財務実績
- 製品のベンチマーク
- Amcor Plc
- 会社概要
- 財務実績
- 製品のベンチマーク
- Assan Aluminyum
- 会社概要
- 財務実績
- 製品のベンチマーク
- Ess Dee Aluminium
- 会社概要
- 製品のベンチマーク
- Eurofoil
- 会社概要
- 製品のベンチマーク
- Hindalco Industries Limited
- 会社概要
- 製品のベンチマーク
- Huawei Aluminium
- 会社概要
- 製品のベンチマーク
- Shanghai Metal Corporation
- 会社概要
- 製品のベンチマーク
- Laminazione Sottile
- 会社概要
- 製品のベンチマーク
- UACJ Corporation
- 会社概要
- 財務実績
- 製品のベンチマーク
- Xiamen Xiashun Aluminium Foil Co., Ltd
- 会社概要
- 財務実績
- 製品のベンチマーク
- Zhejiang Junma Aluminum Industry
- 会社概要
- 財務実績
- 製品のベンチマーク
- ACM Carcano
List of Tables
- TABLE 1 Aluminum foil market estimates & forecasts, 2018 - 2030 (USD Million) (Kilotons)
- TABLE 2 Aluminum foil market estimates & forecasts, by wrapper foils, 2018 - 2030 (USD Million) (Kilotons)
- TABLE 3 Aluminum foil market estimates & forecasts, by container foils, 2018 - 2030 (USD Million) (Kilotons)
- TABLE 4 Aluminum foil market estimates & forecasts, by foil lids, 2018 - 2030 (USD Million) (Kilotons)
- TABLE 5 Aluminum foil market estimates & forecasts, by pouches, 2018 - 2030 (USD Million) (Kilotons)
- TABLE 6 Aluminum foil market estimates & forecasts, by blister packs, 2018 - 2030 (USD Million) (Kilotons)
- TABLE 7 Aluminum foil market estimates & forecasts, by others, 2018 - 2030 (USD Million) (Kilotons)
- TABLE 8 Aluminum foil market estimates & forecasts, by packaging, 2018 - 2030 (USD Million) (Kilotons)
- TABLE 9 Aluminum foil market estimates & forecasts, by industrial, 2018 - 2030 (USD Million) (Kilotons)
- TABLE 10 Aluminum foil market estimates & forecasts, by food & beverage packaging end-use, 2018 - 2030 (USD Million) (Kilotons)
- TABLE 11 Aluminum foil market estimates & forecasts, by pharmaceutical packaging end-use, 2018 - 2030 (USD Million) (Kilotons)
- TABLE 12 Aluminum foil market estimates & forecasts, by tobacco packaging end-use, 2018 - 2030 (USD Million) (Kilotons)
- TABLE 13 Aluminum foil market estimates & forecasts, by others, 2018 - 2030 (USD Million) (Kilotons)
- TABLE 14 Aluminum foil market estimates & forecasts, by HVAC industrial end-use, 2018 - 2030 (USD Million) (Kilotons)
- TABLE 15 Aluminum foil market estimates & forecasts, by EV battery industrial end-use, 2018 - 2030 (USD Million) (Kilotons)
- TABLE 16 Aluminum foil market estimates & forecasts, by others, 2018 - 2030 (USD Million) (Kilotons)
- TABLE 17 North America aluminum foil market estimates & forecasts, 2018 - 2030 (USD Million) (Kilotons)
- TABLE 18 North America aluminum foil market estimates & forecasts, by product, 2018 - 2030 (USD Million)
- TABLE 19 North America aluminum foil market estimates & forecasts, by product, 2018 - 2030 (Kilotons)
- TABLE 20 North America aluminum foil market estimates & forecasts, by end-use, 2018 - 2030 (USD Million)
- TABLE 21 North America aluminum foil market estimates & forecasts, by end-use, 2018 - 2030 (Kilotons)
- TABLE 22 North America aluminum foil market estimates & forecasts, by packaging end-use, 2018 - 2030 (USD Million)
- TABLE 23 North America aluminum foil market estimates & forecasts, by industrial end-use, 2018 - 2030 (Kilotons)
- TABLE 24 U.S. aluminum foil market estimates & forecasts, 2018 - 2030 (USD Million) (Kilotons)
- TABLE 25 U.S. aluminum foil market estimates & forecasts, by product, 2018 - 2030 (USD Million)
- TABLE 26 U.S. aluminum foil market estimates & forecasts, by product, 2018 - 2030 (Kilotons)
- TABLE 27 U.S. aluminum foil market estimates & forecasts, by end-use, 2018 - 2030 (USD Million)
- TABLE 28 U.S. aluminum foil market estimates & forecasts, by end-use, 2018 - 2030 (Kilotons)
- TABLE 29 U.S. aluminum foil market estimates & forecasts, by packaging end-use, 2018 - 2030 (USD Million)
- TABLE 30 U.S. aluminum foil market estimates & forecasts, by industrial end-use, 2018 - 2030 (Kilotons)
- TABLE 31 Canada aluminum foil market estimates & forecasts, 2018 - 2030 (USD Million) (Kilotons)
- TABLE 32 Canada aluminum foil market estimates & forecasts, by product, 2018 - 2030 (USD Million)
- TABLE 33 Canada aluminum foil market estimates & forecasts, by product, 2018 - 2030 (Kilotons)
- TABLE 34 Canada aluminum foil market estimates & forecasts, by end-use, 2018 - 2030 (USD Million)
- TABLE 35 Canada aluminum foil market estimates & forecasts, by end-use, 2018 - 2030 (Kilotons)
- TABLE 36 Canada aluminum foil market estimates & forecasts, by packaging end-use, 2018 - 2030 (USD Million)
- TABLE 37 Canada aluminum foil market estimates & forecasts, by industrial end-use, 2018 - 2030 (Kilotons)
- TABLE 38 Mexico aluminum foil market estimates & forecasts, 2018 - 2030 (USD Million) (Kilotons)
- TABLE 39 Mexico aluminum foil market estimates & forecasts, by product, 2018 - 2030 (USD Million)
- TABLE 40 Mexico aluminum foil market estimates & forecasts, by product, 2018 - 2030 (Kilotons)
- TABLE 41 Mexico aluminum foil market estimates & forecasts, by end-use, 2018 - 2030 (USD Million)
- TABLE 42 Mexico aluminum foil market estimates & forecasts, by end-use, 2018 - 2030 (Kilotons)
- TABLE 43 Mexico aluminum foil market estimates & forecasts, by packaging end-use, 2018 - 2030 (USD Million)
- TABLE 44 Mexico aluminum foil market estimates & forecasts, by industrial end-use, 2018 - 2030 (Kilotons)
- TABLE 45 Europe aluminum foil market estimates & forecasts, 2018 - 2030 (USD Million) (Kilotons)
- TABLE 46 Europe aluminum foil market estimates & forecasts, by product, 2018 - 2030 (USD Million)
- TABLE 47 Europe aluminum foil market estimates & forecasts, by product, 2018 - 2030 (Kilotons)
- TABLE 48 Europe aluminum foil market estimates & forecasts, by end-use, 2018 - 2030 (USD Million)
- TABLE 49 Europe aluminum foil market estimates & forecasts, by end-use, 2018 - 2030 (Kilotons)
- TABLE 50 Europe aluminum foil market estimates & forecasts, by packaging end-use, 2018 - 2030 (USD Million)
- TABLE 51 Europe aluminum foil market estimates & forecasts, by industrial end-use, 2018 - 2030 (Kilotons)
- TABLE 52 Germany aluminum foil market estimates & forecasts, 2018 - 2030 (USD Million) (Kilotons)
- TABLE 53 Germany aluminum foil market estimates & forecasts, by product, 2018 - 2030 (USD Million)
- TABLE 54 Germany aluminum foil market estimates & forecasts, by product, 2018 - 2030 (Kilotons)
- TABLE 55 Germany aluminum foil market estimates & forecasts, by end-use, 2018 - 2030 (USD Million)
- TABLE 56 Germany aluminum foil market estimates & forecasts, by end-use, 2018 - 2030 (Kilotons)
- TABLE 57 Germany aluminum foil market estimates & forecasts, by packaging end-use, 2018 - 2030 (USD Million)
- TABLE 58 Germany aluminum foil market estimates & forecasts, by industrial end-use, 2018 - 2030 (Kilotons)
- TABLE 59 U.K. aluminum foil market estimates & forecasts, 2018 - 2030 (USD Million) (Kilotons)
- TABLE 60 U.K. aluminum foil market estimates & forecasts, by product, 2018 - 2030 (USD Million)
- TABLE 61 U.K. aluminum foil market estimates & forecasts, by product, 2018 - 2030 (Kilotons)
- TABLE 62 U.K. aluminum foil market estimates & forecasts, by end-use, 2018 - 2030 (USD Million)
- TABLE 63 U.K. aluminum foil market estimates & forecasts, by end-use, 2018 - 2030 (Kilotons)
- TABLE 64 U.K. aluminum foil market estimates & forecasts, by packaging end-use, 2018 - 2030 (USD Million)
- TABLE 65 U.K. aluminum foil market estimates & forecasts, by industrial end-use, 2018 - 2030 (Kilotons)
- TABLE 66 Italy aluminum foil market estimates & forecasts, 2018 - 2030 (USD Million) (Kilotons)
- TABLE 67 Italy aluminum foil market estimates & forecasts, by product, 2018 - 2030 (USD Million)
- TABLE 68 Italy aluminum foil market estimates & forecasts, by product, 2018 - 2030 (Kilotons)
- TABLE 69 Italy aluminum foil market estimates & forecasts, by end-use, 2018 - 2030 (USD Million)
- TABLE 70 Italy aluminum foil market estimates & forecasts, by end-use, 2018 - 2030 (Kilotons)
- TABLE 71 Italy aluminum foil market estimates & forecasts, by packaging end-use, 2018 - 2030 (USD Million)
- TABLE 72 Italy aluminum foil market estimates & forecasts, by industrial end-use, 2018 - 2030 (Kilotons)
- TABLE 73 Turkey aluminum foil market estimates & forecasts, 2018 - 2030 (USD Million) (Kilotons)
- TABLE 74 Turkey aluminum foil market estimates & forecasts, by product, 2018 - 2030 (USD Million)
- TABLE 75 Turkey aluminum foil market estimates & forecasts, by product, 2018 - 2030 (Kilotons)
- TABLE 76 Turkey aluminum foil market estimates & forecasts, by end-use, 2018 - 2030 (USD Million)
- TABLE 77 Turkey aluminum foil market estimates & forecasts, by end-use, 2018 - 2030 (Kilotons)
- TABLE 78 Turkey aluminum foil market estimates & forecasts, by packaging end-use, 2018 - 2030 (USD Million)
- TABLE 79 Turkey aluminum foil market estimates & forecasts, by industrial end-use, 2018 - 2030 (Kilotons)
- TABLE 80 Russia aluminum foil market estimates & forecasts, 2018 - 2030 (USD Million) (Kilotons)
- TABLE 81 Russia aluminum foil market estimates & forecasts, by product, 2018 - 2030 (USD Million)
- TABLE 82 Russia aluminum foil market estimates & forecasts, by product, 2018 - 2030 (Kilotons)
- TABLE 83 Russia aluminum foil market estimates & forecasts, by end-use, 2018 - 2030 (USD Million)
- TABLE 84 Russia aluminum foil market estimates & forecasts, by end-use, 2018 - 2030 (Kilotons)
- TABLE 85 Russia aluminum foil market estimates & forecasts, by packaging end-use, 2018 - 2030 (USD Million)
- TABLE 86 Russia aluminum foil market estimates & forecasts, by industrial end-use, 2018 - 2030 (Kilotons)
- TABLE 87 Asia Pacific aluminum foil market estimates & forecasts, 2018 - 2030 (USD Million) (Kilotons)
- TABLE 88 Asia Pacific aluminum foil market estimates & forecasts, by product, 2018 - 2030 (USD Million)
- TABLE 89 Asia Pacific aluminum foil market estimates & forecasts, by product, 2018 - 2030 (Kilotons)
- TABLE 90 Asia Pacific aluminum foil market estimates & forecasts, by end-use, 2018 - 2030 (USD Million)
- TABLE 91 Asia Pacific aluminum foil market estimates & forecasts, by end-use, 2018 - 2030 (Kilotons)
- TABLE 92 Asia Pacific aluminum foil market estimates & forecasts, by packaging end-use, 2018 - 2030 (USD Million)
- TABLE 93 Asia Pacific aluminum foil market estimates & forecasts, by industrial end-use, 2018 - 2030 (Kilotons)
- TABLE 94 China aluminum foil market estimates & forecasts, 2018 - 2030 (USD Million) (Kilotons)
- TABLE 95 China aluminum foil market estimates & forecasts, by product, 2018 - 2030 (USD Million)
- TABLE 96 China aluminum foil market estimates & forecasts, by product, 2018 - 2030 (Kilotons)
- TABLE 97 China aluminum foil market estimates & forecasts, by end-use, 2018 - 2030 (USD Million)
- TABLE 98 China aluminum foil market estimates & forecasts, by end-use, 2018 - 2030 (Kilotons)
- TABLE 99 China aluminum foil market estimates & forecasts, by packaging end-use, 2018 - 2030 (USD Million)
- TABLE 100 China aluminum foil market estimates & forecasts, by industrial end-use, 2018 - 2030 (Kilotons)
- TABLE 101 India aluminum foil market estimates & forecasts, 2018 - 2030 (USD Million) (Kilotons)
- TABLE 102 India aluminum foil market estimates & forecasts, by product, 2018 - 2030 (USD Million)
- TABLE 103 India aluminum foil market estimates & forecasts, by product, 2018 - 2030 (Kilotons)
- TABLE 104 India aluminum foil market estimates & forecasts, by end-use, 2018 - 2030 (USD Million)
- TABLE 105 India aluminum foil market estimates & forecasts, by end-use, 2018 - 2030 (Kilotons)
- TABLE 106 India aluminum foil market estimates & forecasts, by packaging end-use, 2018 - 2030 (USD Million)
- TABLE 107 India aluminum foil market estimates & forecasts, by industrial end-use, 2018 - 2030 (Kilotons)
- TABLE 108 Japan aluminum foil market estimates & forecasts, 2018 - 2030 (USD Million) (Kilotons)
- TABLE 109 Japan aluminum foil market estimates & forecasts, by product, 2018 - 2030 (USD Million)
- TABLE 110 Japan aluminum foil market estimates & forecasts, by product, 2018 - 2030 (Kilotons)
- TABLE 111 Japan aluminum foil market estimates & forecasts, by end-use, 2018 - 2030 (USD Million)
- TABLE 112 Japan aluminum foil market estimates & forecasts, by end-use, 2018 - 2030 (Kilotons)
- TABLE 113 Japan aluminum foil market estimates & forecasts, by packaging end-use, 2018 - 2030 (USD Million)
- TABLE 114 Japan aluminum foil market estimates & forecasts, by industrial end-use, 2018 - 2030 (Kilotons)
- TABLE 115 South Korea aluminum foil market estimates & forecasts, 2018 - 2030 (USD Million) (Kilotons)
- TABLE 116 South Korea aluminum foil market estimates & forecasts, by product, 2018 - 2030 (USD Million)
- TABLE 117 South Korea aluminum foil market estimates & forecasts, by product, 2018 - 2030 (Kilotons)
- TABLE 118 South Korea aluminum foil market estimates & forecasts, by end-use, 2018 - 2030 (USD Million)
- TABLE 119 South Korea aluminum foil market estimates & forecasts, by end-use, 2018 - 2030 (Kilotons)
- TABLE 120 South Korea aluminum foil market estimates & forecasts, by packaging end-use, 2018 - 2030 (USD Million)
- TABLE 121 South Korea aluminum foil market estimates & forecasts, by industrial end-use, 2018 - 2030 (Kilotons)
- TABLE 122 Indonesia aluminum foil market estimates & forecasts, 2018 - 2030 (USD Million) (Kilotons)
- TABLE 123 Indonesia aluminum foil market estimates & forecasts, by product, 2018 - 2030 (USD Million)
- TABLE 124 Indonesia aluminum foil market estimates & forecasts, by product, 2018 - 2030 (Kilotons)
- TABLE 125 Indonesia aluminum foil market estimates & forecasts, by end-use, 2018 - 2030 (USD Million)
- TABLE 126 Indonesia aluminum foil market estimates & forecasts, by end-use, 2018 - 2030 (Kilotons)
- TABLE 127 Indonesia aluminum foil market estimates & forecasts, by packaging end-use, 2018 - 2030 (USD Million)
- TABLE 128 Indonesia aluminum foil market estimates & forecasts, by industrial end-use, 2018 - 2030 (Kilotons)
- TABLE 129 Central & South America aluminum foil market estimates & forecasts, 2018 - 2030 (USD Million) (Kilotons)
- TABLE 130 Central & South America aluminum foil market estimates & forecasts, by product, 2018 - 2030 (USD Million)
- TABLE 131 Central & South America aluminum foil market estimates & forecasts, by product, 2018 - 2030 (Kilotons)
- TABLE 132 Central & South America aluminum foil market estimates & forecasts, by end-use, 2018 - 2030 (USD Million)
- TABLE 133 Central & South America aluminum foil market estimates & forecasts, by end-use, 2018 - 2030 (Kilotons)
- TABLE 134 Central & South America aluminum foil market estimates & forecasts, by packaging end-use, 2018 - 2030 (USD Million)
- TABLE 135 Central & South America aluminum foil market estimates & forecasts, by industrial end-use, 2018 - 2030 (Kilotons)
- TABLE 136 Brazil aluminum foil market estimates & forecasts, 2018 - 2030 (USD Million) (Kilotons)
- TABLE 137 Brazil aluminum foil market estimates & forecasts, by product, 2018 - 2030 (USD Million)
- TABLE 138 Brazil aluminum foil market estimates & forecasts, by product, 2018 - 2030 (Kilotons)
- TABLE 139 Brazil aluminum foil market estimates & forecasts, by end-use, 2018 - 2030 (USD Million)
- TABLE 140 Brazil aluminum foil market estimates & forecasts, by end-use, 2018 - 2030 (Kilotons)
- TABLE 141 Brazil aluminum foil market estimates & forecasts, by packaging end-use, 2018 - 2030 (USD Million)
- TABLE 142 Brazil aluminum foil market estimates & forecasts, by industrial end-use, 2018 - 2030 (Kilotons)
- TABLE 143 Argentina aluminum foil market estimates & forecasts, 2018 - 2030 (USD Million) (Kilotons)
- TABLE 144 Argentina aluminum foil market estimates & forecasts, by product, 2018 - 2030 (USD Million)
- TABLE 145 Argentina aluminum foil market estimates & forecasts, by product, 2018 - 2030 (Kilotons)
- TABLE 146 Argentina aluminum foil market estimates & forecasts, by end-use, 2018 - 2030 (USD Million)
- TABLE 147 Argentina aluminum foil market estimates & forecasts, by end-use, 2018 - 2030 (Kilotons)
- TABLE 148 Argentina aluminum foil market estimates & forecasts, by packaging end-use, 2018 - 2030 (USD Million)
- TABLE 149 Argentina aluminum foil market estimates & forecasts, by industrial end-use, 2018 - 2030 (Kilotons)
- TABLE 150 Middle East & Africa aluminum foil market estimates & forecasts, 2018 - 2030 (USD Million) (Kilotons)
- TABLE 151 Middle East & Africa aluminum foil market estimates & forecasts, by product, 2018 - 2030 (USD Million)
- TABLE 152 Middle East & Africa aluminum foil market estimates & forecasts, by product, 2018 - 2030 (Kilotons)
- TABLE 153 Middle East & Africa aluminum foil market estimates & forecasts, by end-use, 2018 - 2030 (USD Million)
- TABLE 154 Middle East & Africa aluminum foil market estimates & forecasts, by end-use, 2018 - 2030 (Kilotons)
- TABLE 155 Middle East & Africa aluminum foil market estimates & forecasts, by packaging end-use, 2018 - 2030 (USD Million)
- TABLE 156 Middle East & Africa aluminum foil market estimates & forecasts, by industrial end-use, 2018 - 2030 (Kilotons)
- TABLE 157 Saudi Arabia aluminum foil market estimates & forecasts, 2018 - 2030 (USD Million) (Kilotons)
- TABLE 158 Saudi Arabia aluminum foil market estimates & forecasts, by product, 2018 - 2030 (USD Million)
- TABLE 159 Saudi Arabia aluminum foil market estimates & forecasts, by product, 2018 - 2030 (Kilotons)
- TABLE 160 Saudi Arabia aluminum foil market estimates & forecasts, by end-use, 2018 - 2030 (USD Million)
- TABLE 161 Saudi Arabia aluminum foil market estimates & forecasts, by end-use, 2018 - 2030 (Kilotons)
- TABLE 162 Saudi Arabia aluminum foil market estimates & forecasts, by packaging end-use, 2018 - 2030 (USD Million)
- TABLE 163 Saudi Arabia aluminum foil market estimates & forecasts, by industrial end-use, 2018 - 2030 (Kilotons)
- TABLE 164 South Africa aluminum foil market estimates & forecasts, 2018 - 2030 (USD Million) (Kilotons)
- TABLE 165 South Africa aluminum foil market estimates & forecasts, by product, 2018 - 2030 (USD Million)
- TABLE 166 South Africa aluminum foil market estimates & forecasts, by product, 2018 - 2030 (Kilotons)
- TABLE 167 South Africa aluminum foil market estimates & forecasts, by end-use, 2018 - 2030 (USD Million)
- TABLE 168 South Africa aluminum foil market estimates & forecasts, by end-use, 2018 - 2030 (Kilotons)
- TABLE 169 South Africa aluminum foil market estimates & forecasts, by packaging end-use, 2018 - 2030 (USD Million)
- TABLE 170 South Africa aluminum foil market estimates & forecasts, by industrial end-use, 2018 - 2030 (Kilotons)
List of Figures
- Fig 1. Market segmentation
- Fig 2. Information procurement
- Fig 3. Data Analysis Models
- Fig 4. Market Formulation and Validation
- Fig 5. Market snapshot
- Fig 6. Segmental outlook - Product & End-Use
- Fig 7. Competitive Outlook
- Fig 8. Aluminum foil market outlook, 2018 - 2030 (USD Million) (Kilotons)
- Fig 9. Value chain analysis
- Fig 10. Market dynamics
- Fig 11. Porter's Analysis
- Fig 12. PESTEL Analysis
- Fig 13. Aluminum foil market, by product: Key takeaways
- Fig 14. Aluminum foil market, by product: Market share, 2022 & 2030
- Fig 15. Aluminum foil market, by end-use: Key takeaways
- Fig 16. Aluminum foil market, by end-use: Market share, 2022 & 2030
- Fig 17. Aluminum foil market: Regional analysis, 2022
- Fig 18. Aluminum foil market, by region: Key takeaways
Aluminum Foil Market Growth & Trends:
The global aluminum foil market size is expected to reach USD 39.58 billion by 2030, registering a CAGR of 5.5% over the forecast period, according to a new report by Grand View Research, Inc. The increasing investments in the Electric Vehicle (EV) industry and rising demand for packaging from the food & beverage, and pharmaceutical industries, along with favorable government policies regarding carbon footprint reduction, are driving the market growth.
Governments around the world are encouraging the production of EVs. For instance, in 2021, the French government unveiled an industrial revival plan worth EUR 30.0 billion (~USD 32.1 billion) in sectors such as nuclear & renewable energy sources, electric cars, semiconductors, and robotics, and revive the industrial sector. In this plan, the government has allocated EUR 4.0 billion (~USD 4.3 billion) for transport and mobility, with a target to produce 2 million EVs and hybrid vehicles by 2030.
The aluminum foil is a thin aluminum sheet ranging from 0.006 mm to the upper ISO defined limit of 0.2 mm. Owing to its properties like high thermal conductivity, excellent resistance, low density, the excellent barrier to moisture, and non-absorbent has increased the demand in the various end-use industries. The current trend in the market showcases the rising popularity of wrapper foil, which is anticipated to continue across the forecast period. Due to its lightweight, flexible, and non-toxic characteristics, its demand has been steadily increasing in the packaging industry.
Based on region, Asia Pacific held the largest revenue share of the global market in 2021. In the region, China had the highest revenue share in 2021 but India will register the fastest growth rate in the said forecast period. The growing demand from various end-use industries will propel the use of aluminum foil across the forecast period.
The global aluminum foil market is highly competitive. Key players of the end-use industry are backward integrated and have access to raw materials, have better control over price volatility, and have improved customer access. The year 2021 witnessed investments for capacity expansion and acquisitions. For instance, in April 2021, ANG Lifesciences India acquired Mansa Print and Publisher Ltd. This strategic backward integration is aimed to help expand ANG's footprint in the pharmaceutical business.
Aluminum Foil Market Report Highlights:
- Based on product, container foils are anticipated to register the fastest CAGR of 6.7%, in terms of revenue, from 2023 to 2030. The growth is due to increasing urbanization, the rise in the working population, and the corresponding rise in demand for packaged food
- Based on end-use, the packaging is anticipated to register a CAGR of 5.9%, in terms of revenue, from 2023 to 2030. Aluminum foil packaging is consumed by the food & beverage, and pharmaceutical industries
- The packaging end-use segment is further divided into food & beverage, tobacco, pharmaceutical, and others. Food & beverage is likely to register the highest CAGR of 6.1%, in terms of revenue during the forecast period. Growth is attributed to the growing demand for takeaway and processed food
- Based on region, Asia Pacific is expected to register the highest CAGR of 6.3%, in terms of revenue, over the forecast period. Rising emphasis on the EV industry and increasing production of packaged food is propelling growth in the region
Table of Contents
Chapter 1. Methodology and Scope
- 1.1. Market Segmentation & Scope
- 1.2. Market Definition
- 1.3. Information Procurement
- 1.3.1. Information Analysis
- 1.3.2. Data Analysis Models
- 1.3.3. Market Formulation & Data Visualization
- 1.3.4. Data Validation & Publishing
- 1.4. Research Scope and Assumptions
- 1.4.1. List of Data Sources
Chapter 2. Executive Summary
- 2.1. Market Outlook
- 2.2. Segmental Outlook
- 2.3. Competitive Outlook
Chapter 3. Market Variables, Trends, and Scope
- 3.1. Market Lineage Outlook
- 3.1.1. Global Aluminum Foil Market
- 3.2. Industry Value Chain Analysis
- 3.2.1. Raw Material Trends
- 3.3. Technology Overview
- 3.4. Regulatory Framework
- 3.5. Market Dynamics
- 3.5.1. Market Driver Analysis
- 3.5.2. Market Restraint Analysis
- 3.5.3. Market Opportunity Analysis
- 3.5.4. Market Challenges
- 3.6. Porter's Five Forces Analysis
- 3.6.1. Bargaining Power of Suppliers
- 3.6.2. Bargaining Power of Buyers
- 3.6.3. Threat of Substitution
- 3.6.4. Threat of New Entrants
- 3.6.5. Competitive Rivalry
- 3.7. PESTLE Analysis
- 3.7.1. Political
- 3.7.2. Economic
- 3.7.3. Social Landscape
- 3.7.4. Technology
- 3.7.5. Environmental
- 3.7.6. Legal
Chapter 4. Aluminum Foil Market: Product Outlook Estimates & Trend
- 4.1. Definition & Scope
- 4.2. Aluminum Foil Market: Product Movement Analysis, 2022 & 2030
- 4.3. Wrapper Foils
- 4.3.1. Market estimates & forecasts, 2018 - 2030 (USD Million) (Kilotons)
- 4.4. Container Foils
- 4.4.1. Market estimates & forecasts, 2018 - 2030 (USD Million) (Kilotons)
- 4.5. Foil Lids
- 4.5.1. Market estimates & forecasts, 2018 - 2030 (USD Million) (Kilotons)
- 4.6. Pouches
- 4.6.1. Market estimates & forecasts, 2018 - 2030 (USD Million) (Kilotons)
- 4.7. Blister Packs
- 4.7.1. Market estimates & forecasts, 2018 - 2030 (USD Million) (Kilotons)
- 4.8. Others
- 4.8.1. Market estimates & forecasts, 2018 - 2030 (USD Million) (Kilotons)
Chapter 5. Aluminum Foil Market: End-Use Estimates & Trend Analysis
- 5.1. Definition & Scope
- 5.2. Aluminum Foil Market: End-Use Movement Analysis, 2022 & 2030
- 5.3. Packaging
- 5.3.1. Market estimates & forecasts, 2018 - 2030 (USD Million) (Kilotons)
- 5.3.2. Market estimates & forecasts, by food & beverage, 2018 - 2030 (USD Million) (Kilotons)
- 5.3.3. Market estimates & forecasts, by pharmaceutical, 2018 - 2030 (USD Million) (Kilotons)
- 5.3.4. Market estimates & forecasts, by tobacco, 2018 - 2030 (USD Million) (Kilotons)
- 5.3.5. Market estimates & forecasts, by others, 2018 - 2030 (USD Million) (Kilotons)
- 5.4. Industrial
- 5.4.1. Market estimates & forecasts, 2018 - 2030 (USD Million) (Kilotons)
- 5.4.2. Market estimates & forecasts, by HVAC, 2018 - 2030 (USD Million) (Kilotons)
- 5.4.3. Market estimates & forecasts, by EV battery, 2018 - 2030 (USD Million) (Kilotons)
- 5.4.4. Market estimates & forecasts, by others, 2018 - 2030 (USD Million) (Kilotons)
Chapter 6. Aluminum Foil Market: Regional Estimates & Trend Analysis
- 6.1. Regional Analysis, 2022 & 2030
- 6.2. North America
- 6.2.1. Market estimates and forecasts, 2018 - 2030 (Kilotons) (USD Million)
- 6.2.2. Market estimates and forecasts, by product, 2018 - 2030 (Kilotons) (USD Million)
- 6.2.3. Market estimates and forecasts, by end-use, 2018 - 2030 (Kilotons) (USD Million)
- 6.2.4. U.S.
- 6.2.4.1. Market estimates and forecasts, 2018 - 2030 (Kilotons) (USD Million)
- 6.2.4.2. Market estimates and forecasts, by product, 2018 - 2030 (Kilotons) (USD Million)
- 6.2.4.3. Market estimates and forecasts, by end-use, 2018 - 2030 (Kilotons) (USD Million)
- 6.2.5. Canada
- 6.2.5.1. Market estimates and forecasts, 2018 - 2030 (Kilotons) (USD Million)
- 6.2.5.2. Market estimates and forecasts, by product, 2018 - 2030 (Kilotons) (USD Million)
- 6.2.5.3. Market estimates and forecasts, by end-use, 2018 - 2030 (Kilotons) (USD Million)
- 6.2.6. Mexico
- 6.2.6.1. Market estimates and forecasts, 2018 - 2030 (Kilotons) (USD Million)
- 6.2.6.2. Market estimates and forecasts, by product, 2018 - 2030 (Kilotons) (USD Million)
- 6.2.6.3. Market estimates and forecasts, by end-use, 2018 - 2030 (Kilotons) (USD Million)
- 6.3. Europe
- 6.3.1. Market estimates and forecasts, 2018 - 2030 (Kilotons) (USD Million)
- 6.3.2. Market estimates and forecasts, by product, 2018 - 2030 (Kilotons) (USD Million)
- 6.3.3. Market estimates and forecasts, by end-use, 2018 - 2030 (Kilotons) (USD Million)
- 6.3.4. Germany
- 6.3.4.1. Market estimates and forecasts, 2018 - 2030 (Kilotons) (USD Million)
- 6.3.4.2. Market estimates and forecasts, by product, 2018 - 2030 (Kilotons) (USD Million)
- 6.3.4.3. Market estimates and forecasts, by end-use, 2018 - 2030 (Kilotons) (USD Million)
- 6.3.5. U.K.
- 6.3.5.1. Market estimates and forecasts, 2018 - 2030 (Kilotons) (USD Million)
- 6.3.5.2. Market estimates and forecasts, by product, 2018 - 2030 (Kilotons) (USD Million)
- 6.3.5.3. Market estimates and forecasts, by end-use, 2018 - 2030 (Kilotons) (USD Million)
- 6.3.6. Italy
- 6.3.6.1. Market estimates and forecasts, 2018 - 2030 (Kilotons) (USD Million)
- 6.3.6.2. Market estimates and forecasts, by product, 2018 - 2030 (Kilotons) (USD Million)
- 6.3.6.3. Market estimates and forecasts, by end-use, 2018 - 2030 (Kilotons) (USD Million)
- 6.3.7. Turkey
- 6.3.7.1. Market estimates and forecasts, 2018 - 2030 (Kilotons) (USD Million)
- 6.3.7.2. Market estimates and forecasts, by product, 2018 - 2030 (Kilotons) (USD Million)
- 6.3.7.3. Market estimates and forecasts, by end-use, 2018 - 2030 (Kilotons) (USD Million)
- 6.3.8. Russia
- 6.3.8.1. Market estimates and forecasts, 2018 - 2030 (Kilotons) (USD Million)
- 6.3.8.2. Market estimates and forecasts, by product, 2018 - 2030 (Kilotons) (USD Million)
- 6.3.8.3. Market estimates and forecasts, by end-use, 2018 - 2030 (Kilotons) (USD Million)
- 6.4. Asia Pacific
- 6.4.1. Market estimates and forecasts, 2018 - 2030 (Kilotons) (USD Million)
- 6.4.2. Market estimates and forecasts, by product, 2018 - 2030 (Kilotons) (USD Million)
- 6.4.3. Market estimates and forecasts, by end-use, 2018 - 2030 (Kilotons) (USD Million)
- 6.4.4. China
- 6.4.4.1. Market estimates and forecasts, 2018 - 2030 (Kilotons) (USD Million)
- 6.4.4.2. Market estimates and forecasts, by product, 2018 - 2030 (Kilotons) (USD Million)
- 6.4.4.3. Market estimates and forecasts, by end-use, 2018 - 2030 (Kilotons) (USD Million)
- 6.4.5. India
- 6.4.5.1. Market estimates and forecasts, 2018 - 2030 (Kilotons) (USD Million)
- 6.4.5.2. Market estimates and forecasts, by product, 2018 - 2030 (Kilotons) (USD Million)
- 6.4.5.3. Market estimates and forecasts, by end-use, 2018 - 2030 (Kilotons) (USD Million)
- 6.4.6. Japan
- 6.4.6.1. Market estimates and forecasts, 2018 - 2030 (Kilotons) (USD Million)
- 6.4.6.2. Market estimates and forecasts, by product, 2018 - 2030 (Kilotons) (USD Million)
- 6.4.6.3. Market estimates and forecasts, by end-use, 2018 - 2030 (Kilotons) (USD Million)
- 6.4.7. South Korea
- 6.4.7.1. Market estimates and forecasts, 2018 - 2030 (Kilotons) (USD Million)
- 6.4.7.2. Market estimates and forecasts, by product, 2018 - 2030 (Kilotons) (USD Million)
- 6.4.7.3. Market estimates and forecasts, by end-use, 2018 - 2030 (Kilotons) (USD Million)
- 6.4.8. Indonesia
- 6.4.8.1. Market estimates and forecasts, 2018 - 2030 (Kilotons) (USD Million)
- 6.4.8.2. Market estimates and forecasts, by product, 2018 - 2030 (Kilotons) (USD Million)
- 6.4.8.3. Market estimates and forecasts, by end-use, 2018 - 2030 (Kilotons) (USD Million)
- 6.5. Central & South America
- 6.5.1. Market estimates and forecasts, 2018 - 2030 (Kilotons) (USD Million)
- 6.5.2. Market estimates and forecasts, by product, 2018 - 2030 (Kilotons) (USD Million)
- 6.5.3. Market estimates and forecasts, by end-use, 2018 - 2030 (Kilotons) (USD Million)
- 6.5.4. Brazil
- 6.5.4.1. Market estimates and forecasts, 2018 - 2030 (Kilotons) (USD Million)
- 6.5.4.2. Market estimates and forecasts, by product, 2018 - 2030 (Kilotons) (USD Million)
- 6.5.4.3. Market estimates and forecasts, by end-use, 2018 - 2030 (Kilotons) (USD Million)
- 6.5.5. Argentina
- 6.5.5.1. Market estimates and forecasts, 2018 - 2030 (Kilotons) (USD Million)
- 6.5.5.2. Market estimates and forecasts, by product, 2018 - 2030 (Kilotons) (USD Million)
- 6.5.5.3. Market estimates and forecasts, by end-use, 2018 - 2030 (Kilotons) (USD Million)
- 6.6. Middle East & Africa
- 6.6.1. Market estimates and forecasts, 2018 - 2030 (Kilotons) (USD Million)
- 6.6.2. Market estimates and forecasts, by product, 2018 - 2030 (Kilotons) (USD Million)
- 6.6.3. Market estimates and forecasts, by end-use, 2018 - 2030 (Kilotons) (USD Million)
- 6.6.4. Saudi Arabia
- 6.6.4.1. Market estimates and forecasts, 2018 - 2030 (Kilotons) (USD Million)
- 6.6.4.2. Market estimates and forecasts, by product, 2018 - 2030 (Kilotons) (USD Million)
- 6.6.4.3. Market estimates and forecasts, by end-use, 2018 - 2030 (Kilotons) (USD Million)
- 6.6.5. South Africa
- 6.6.5.1. Market estimates and forecasts, 2018 - 2030 (Kilotons) (USD Million)
- 6.6.5.2. Market estimates and forecasts, by product, 2018 - 2030 (Kilotons) (USD Million)
- 6.6.5.3. Market estimates and forecasts, by end-use, 2018 - 2030 (Kilotons) (USD Million)
Chapter 7. Competitive Landscape
- 7.1. Recent Developments & Impact Analysis, By Key Market Participants
- 7.2. Company Categorization
- 7.3. Company Ranking
- 7.4. Heat Map Analysis
- 7.5. Vendor Landscape
- 7.5.1. List of raw material suppliers, key manufacturers, and distributors
- 7.5.2. List of prospective end-users
- 7.6. Strategy Mapping
- 7.7. Company Profiles/Listing
- 7.7.1. ACM Carcano
- 7.7.1.1. Company overview
- 7.7.1.2. Financial performance
- 7.7.1.3. Product benchmarking
- 7.7.2. Amcor Plc
- 7.7.2.1. Company overview
- 7.7.2.2. Financial performance
- 7.7.2.3. Product benchmarking
- 7.7.3. Assan Aluminyum
- 7.7.3.1. Company overview
- 7.7.3.2. Financial performance
- 7.7.3.3. Product benchmarking
- 7.7.4. Ess Dee Aluminium
- 7.7.4.1. Company overview
- 7.7.4.2. Product benchmarking
- 7.7.5. Eurofoil
- 7.7.5.1. Company overview
- 7.7.5.2. Product benchmarking
- 7.7.6. Hindalco Industries Limited
- 7.7.6.1. Company overview
- 7.7.6.2. Product benchmarking
- 7.7.7. Huawei Aluminium
- 7.7.7.1. Company overview
- 7.7.7.2. Product benchmarking
- 7.7.8. Shanghai Metal Corporation
- 7.7.8.1. Company overview
- 7.7.8.2. Product benchmarking
- 7.7.9. Laminazione Sottile
- 7.7.9.1. Company overview
- 7.7.9.2. Product benchmarking
- 7.7.10. UACJ Corporation
- 7.7.10.1. Company overview
- 7.7.10.2. Financial performance
- 7.7.10.3. Product benchmarking
- 7.7.11. Xiamen Xiashun Aluminium Foil Co., Ltd
- 7.7.11.1. Company overview
- 7.7.11.2. Financial performance
- 7.7.11.3. Product benchmarking
- 7.7.12. Zhejiang Junma Aluminum Industry
- 7.7.12.1. Company overview
- 7.7.12.2. Financial performance
- 7.7.12.3. Product benchmarking
- 7.7.1. ACM Carcano