|
|
市場調査レポート
商品コード
1076460
人工血管の世界市場 - 市場規模・シェア・動向分析:製品別(血液透析アクセスグラフト、血管内ステントグラフト)、用途別、原材料別、地域別、セグメント別の予測(2022年~2030年)Vascular Grafts Market Size, Share & Trends Analysis Report By Product (Hemodialysis Access Grafts, Endovascular Stent Grafts), By Application, By Raw Material, By Region, And Segment Forecasts, 2022 - 2030 |
||||||
|
|
|||||||
|
● お客様のご希望に応じて、既存データの加工や未掲載情報(例:国別セグメント)の追加などの対応が可能です。 詳細はお問い合わせください。 |
|||||||


| 人工血管の世界市場 - 市場規模・シェア・動向分析:製品別(血液透析アクセスグラフト、血管内ステントグラフト)、用途別、原材料別、地域別、セグメント別の予測(2022年~2030年) |
|
出版日: 2022年04月19日
発行: Grand View Research
ページ情報: 英文 120 Pages
納期: 2~10営業日
|
- 全表示
- 概要
- 図表
- 目次
世界の人工血管の市場規模は、2030年までに31億米ドルに達し、予測期間中にCAGRで7.0%の成長が予測されています。
人工透析の実施件数の増加や慢性腎臓病、心臓発作、動脈硬化性心疾患、脳卒中の流行が、人工血管の採用を後押ししています。また、低侵襲手術の需要が高まっていることも、市場の成長に拍車をかけています。
当レポートでは、世界の人工血管市場について調査分析し、市場の動向、製品・用途・原材料・地域別の分析、競合情勢などを提供しています。
目次
第1章 調査手法と範囲
第2章 エグゼクティブサマリー
第3章 世界の人工血管市場の変数・動向・範囲
- 浸透と成長の見通しのマッピング
- 世界の人工血管市場力学
- 世界の人工血管業界分析 - ポーターのファイブフォース
- 世界の人工血管業界分析 - PEST
- 主要な取引と戦略的提携の分析
- COVID-19パンデミックが世界の人工血管市場に与える影響
第4章 世界の人工血管市場:競合分析
- 最近の動向と影響分析:主要な市場参入企業別
- 企業/競合の分類(主要なイノベーター、マーケットリーダー、新興企業)
- ベンダー情勢
- 主要なディストリビューター/チャネルパートナーのリスト
- 主要顧客
- 主要な新興企業/テクノロジーディスラプター/イノベーターのリスト
- 企業の市況分析(地理的プレゼンス、製品ポートフォリオ、主要なアライアンス、産業体験)
第5章 世界の人工血管市場:推計と動向分析、製品別
- 世界の人工血管市場:製品分析
- 血液透析アクセスグラフト
- 血管内ステントグラフト
- 冠状動脈バイパスグラフト
- 大動脈疾患のための人工血管
- 末梢人工血管
第6章 世界の人工血管市場:推計と動向分析、用途別
- 世界の人工血管市場:用途の動向分析
- 心臓動脈瘤
- 腎不全
- 血管閉塞
- 冠動脈疾患
第7章 世界の人工血管市場:推計と動向分析、原材料別
- 世界の人工血管市場:原材料の動向分析
- ポリエステル人工血管
- ポリテトラフルオロエチレン人工血管
- ポリウレタン人工血管
- 生体物質ベースの人工血管
第8章 人工血管市場:推計と動向分析、地域別
- 地域市場スナップショット
- 人工血管市場:地域の動向分析(2020年・2030年)
- 北米
- 米国
- カナダ
- 欧州
- ドイツ
- 英国
- フランス
- イタリア
- スペイン
- アジア太平洋
- 日本
- 中国
- インド
- シンガポール
- 韓国
- ラテンアメリカ
- ブラジル
- メキシコ
- アルゼンチン
- 中東・アフリカ
- 南アフリカ
- サウジアラビア
- アラブ首長国連邦
第9章 競合情勢
- 企業プロファイル
- Medtronic plc
- Terumo Corporation
- LeMaitre Vascular, Inc.
- C.R. Bard
- W.L. Gore and Associates, Inc.
- Cook
- Shanghai Suokang Medical Implants Co. Ltd.
- Getinge AB
List of Tables
- Table 1 Global vascular grafts market, by region, 2016 - 2030 (USD Million)
- Table 2 Global vascular grafts market, by product, 2016 - 2030 (USD Million)
- Table 3 Global vascular grafts market, by application, 2016 - 2030 (USD Million)
- Table 4 Global vascular grafts market for cardiac aneurysm, by application, 2016 - 2030 (USD Million)
- Table 5 Global vascular grafts market, by raw material, 2016 - 2030 (USD Million)
- Table 6 Global vascular grafts market for biological material based vascular grafts, by application, 2016 - 2030 (USD Million)
- Table 7 North America vascular grafts market, by country, 2016 - 2030 (USD Million)
- Table 8 North America vascular grafts market, by product, 2016 - 2030 (USD Million)
- Table 9 North America vascular grafts market, by application, 2016 - 2030 (USD Million)
- Table 10 North America vascular grafts market for cardiac aneurysm, by application, 2016 - 2030 (USD Million)
- Table 11 North America vascular grafts market, by raw material, 2016 - 2030 (USD Million)
- Table 12 North America vascular grafts market for biological material based vascular grafts, by application, 2016 - 2030 (USD Million)
- Table 13 U.S. vascular grafts market, by product, 2016 - 2030 (USD Million)
- Table 14 U.S. vascular grafts market, by application, 2016 - 2030 (USD Million)
- Table 15 U.S. vascular grafts market for cardiac aneurysm, by application, 2016 - 2030 (USD Million)
- Table 16 U.S. vascular grafts market, by raw material, 2016 - 2030 (USD Million)
- Table 17 U.S. vascular grafts market for biological material based vascular grafts, by application, 2016 - 2030 (USD Million)
- Table 18 Canada vascular grafts market, by product, 2016 - 2030 (USD Million)
- Table 19 Canada vascular grafts market, by application, 2016 - 2030 (USD Million)
- Table 20 Canada vascular grafts market for cardiac aneurysm, by application, 2016 - 2030 (USD Million)
- Table 21 Canada vascular grafts market, by raw material, 2016 - 2030 (USD Million)
- Table 22 Canada vascular grafts market for biological material based vascular grafts, by application, 2016 - 2030 (USD Million)
- Table 23 Europe vascular grafts market, by country, 2016 - 2030 (USD Million)
- Table 24 Europe vascular grafts market, by product, 2016 - 2030 (USD Million)
- Table 25 Europe vascular grafts market, by application, 2016 - 2030 (USD Million)
- Table 26 Europe vascular grafts market for cardiac aneurysm, by application, 2016 - 2030 (USD Million)
- Table 27 Europe vascular grafts market, by raw material, 2016 - 2030 (USD Million)
- Table 28 Europe vascular grafts market for biological material based vascular grafts, by application, 2016 - 2030 (USD Million)
- Table 29 U.K. vascular grafts market, by product, 2016 - 2030 (USD Million)
- Table 30 U.K. vascular grafts market, by application, 2016 - 2030 (USD Million)
- Table 31 U.K. vascular grafts market for cardiac aneurysm, by application, 2016 - 2030 (USD Million)
- Table 32 U.K. vascular grafts market, by raw material, 2016 - 2030 (USD Million)
- Table 33 U.K. vascular grafts market for biological material based vascular grafts, by application, 2016 - 2030 (USD Million)
- Table 34 Germany vascular grafts market, by product, 2016 - 2030 (USD Million)
- Table 35 Germany vascular grafts market, by application, 2016 - 2030 (USD Million)
- Table 36 Germany vascular grafts market for cardiac aneurysm, by application, 2016 - 2030 (USD Million)
- Table 37 Germany vascular grafts market, by raw material, 2016 - 2030 (USD Million)
- Table 38 Germany vascular grafts market for biological material based vascular grafts, by application, 2016 - 2030 (USD Million)
- Table 39 France vascular grafts market, by product, 2016 - 2030 (USD Million)
- Table 40 France vascular grafts market, by application, 2016 - 2030 (USD Million)
- Table 41 France vascular grafts market for cardiac aneurysm, by application, 2016 - 2030 (USD Million)
- Table 42 France vascular grafts market, by raw material, 2016 - 2030 (USD Million)
- Table 43 France vascular grafts market for biological material based vascular grafts, by application, 2016 - 2030 (USD Million)
- Table 44 Italy vascular grafts market, by product, 2016 - 2030 (USD Million)
- Table 45 Italy vascular grafts market, by application, 2016 - 2030 (USD Million)
- Table 46 Italy vascular grafts market for cardiac aneurysm, by application, 2016 - 2030 (USD Million)
- Table 47 Italy vascular grafts market, by raw material, 2016 - 2030 (USD Million)
- Table 48 Italy vascular grafts market for biological material based vascular grafts, by application, 2016 - 2030 (USD Million)
- Table 49 Spain vascular grafts market, by product, 2016 - 2030 (USD Million)
- Table 50 Spain vascular grafts market, by application, 2016 - 2030 (USD Million)
- Table 51 Spain vascular grafts market for cardiac aneurysm, by application, 2016 - 2030 (USD Million)
- Table 52 Spain vascular grafts market, by raw material, 2016 - 2030 (USD Million)
- Table 53 Spain vascular grafts market for biological material based vascular grafts, by application, 2016 - 2030 (USD Million)
- Table 54 Asia Pacific vascular grafts market, by country, 2016 - 2030 (USD Million)
- Table 55 Asia Pacific vascular grafts market, by product, 2016 - 2030 (USD Million)
- Table 56 Asia Pacific vascular grafts market, by application, 2016 - 2030 (USD Million)
- Table 57 Asia Pacific vascular grafts market for cardiac aneurysm, by application, 2016 - 2030 (USD Million)
- Table 58 Asia Pacific vascular grafts market, by raw material, 2016 - 2030 (USD Million)
- Table 59 Asia Pacific vascular grafts market for biological material based vascular grafts, by application, 2016 - 2030 (USD Million)
- Table 60 Japan vascular grafts market, by product, 2016 - 2030 (USD Million)
- Table 61 Japan vascular grafts market, by application, 2016 - 2030 (USD Million)
- Table 62 Japan vascular grafts market for cardiac aneurysm, by application, 2016 - 2030 (USD Million)
- Table 63 Japan vascular grafts market, by raw material, 2016 - 2030 (USD Million)
- Table 64 Japan vascular grafts market for biological material based vascular grafts, by application, 2016 - 2030 (USD Million)
- Table 65 China vascular grafts market, by product, 2016 - 2030 (USD Million)
- Table 66 China vascular grafts market, by application, 2016 - 2030 (USD Million)
- Table 67 China vascular grafts market for cardiac aneurysm, by application, 2016 - 2030 (USD Million)
- Table 68 China vascular grafts market, by raw material, 2016 - 2030 (USD Million)
- Table 69 China vascular grafts market for biological material based vascular grafts, by application, 2016 - 2030 (USD Million)
- Table 70 India vascular grafts market, by product, 2016 - 2030 (USD Million)
- Table 71 India vascular grafts market, by application, 2016 - 2030 (USD Million)
- Table 72 India vascular grafts market for cardiac aneurysm, by application, 2016 - 2030 (USD Million)
- Table 73 India vascular grafts market, by raw material, 2016 - 2030 (USD Million)
- Table 74 India vascular grafts market for biological material based vascular grafts, by application, 2016 - 2030 (USD Million)
- Table 75 Singapore vascular grafts market, by product, 2016 - 2030 (USD Million)
- Table 76 Singapore vascular grafts market, by application, 2016 - 2030 (USD Million)
- Table 77 Singapore vascular grafts market for cardiac aneurysm, by application, 2016 - 2030 (USD Million)
- Table 78 Singapore vascular grafts market, by raw material, 2016 - 2030 (USD Million)
- Table 79 Singapore vascular grafts market for biological material based vascular grafts, by application, 2016 - 2030 (USD Million)
- Table 80 South Korea vascular grafts market, by product, 2016 - 2030 (USD Million)
- Table 81 South Korea vascular grafts market, by application, 2016 - 2030 (USD Million)
- Table 82 South Korea vascular grafts market for cardiac aneurysm, by application, 2016 - 2030 (USD Million)
- Table 83 South Korea vascular grafts market, by raw material, 2016 - 2030 (USD Million)
- Table 84 South Korea vascular grafts market for biological material based vascular grafts, by application, 2016 - 2030 (USD Million)
- Table 85 Latin America vascular grafts market, by country, 2016 - 2030 (USD Million)
- Table 86 Latin America vascular grafts market, by product, 2016 - 2030 (USD Million)
- Table 87 Latin America vascular grafts market, by application, 2016 - 2030 (USD Million)
- Table 88 Latin America vascular grafts market for cardiac aneurysm, by application, 2016 - 2030 (USD Million)
- Table 89 Latin America vascular grafts market, by raw material, 2016 - 2030 (USD Million)
- Table 90 Latin America vascular grafts market for biological material based vascular grafts, by application, 2016 - 2030 (USD Million)
- Table 91 Brazil vascular grafts market, by product, 2016 - 2030 (USD Million)
- Table 92 Brazil vascular grafts market, by application, 2016 - 2030 (USD Million)
- Table 93 Brazil vascular grafts market for cardiac aneurysm, by application, 2016 - 2030 (USD Million)
- Table 94 Brazil vascular grafts market, by raw material, 2016 - 2030 (USD Million)
- Table 95 Brazil vascular grafts market for biological material based vascular grafts, by application, 2016 - 2030 (USD Million)
- Table 96 Mexico vascular grafts market, by product, 2016 - 2030 (USD Million)
- Table 97 Mexico vascular grafts market, by application, 2016 - 2030 (USD Million)
- Table 98 Mexico vascular grafts market for cardiac aneurysm, by application, 2016 - 2030 (USD Million)
- Table 99 Mexico vascular grafts market, by raw material, 2016 - 2030 (USD Million)
- Table 100 Mexico vascular grafts market for biological material based vascular grafts, by application, 2016 - 2030 (USD Million)
- Table 101 Argentina vascular grafts market, by product, 2016 - 2030 (USD Million)
- Table 102 Argentina vascular grafts market, by application, 2016 - 2030 (USD Million)
- Table 103 Argentina vascular grafts market for cardiac aneurysm, by application, 2016 - 2030 (USD Million)
- Table 104 Argentina vascular grafts market, by raw material, 2016 - 2030 (USD Million)
- Table 105 Argentina vascular grafts market for biological material based vascular grafts, by application, 2016 - 2030 (USD Million)
- Table 106 MEA vascular grafts market, by country, 2016 - 2030 (USD Million)
- Table 107 MEA vascular grafts market, by product, 2016 - 2030 (USD Million)
- Table 108 MEA vascular grafts market, by application, 2016 - 2030 (USD Million)
- Table 109 MEA vascular grafts market for cardiac aneurysm, by application, 2016 - 2030 (USD Million)
- Table 110 MEA vascular grafts market, by raw material, 2016 - 2030 (USD Million)
- Table 111 MEA vascular grafts market for biological material based vascular grafts, by application, 2016 - 2030 (USD Million)
- Table 112 South Africa vascular grafts market, by product, 2016 - 2030 (USD Million)
- Table 113 South Africa vascular grafts market, by application, 2016 - 2030 (USD Million)
- Table 114 South Africa vascular grafts market for cardiac aneurysm, by application, 2016 - 2030 (USD Million)
- Table 115 South Africa vascular grafts market, by raw material, 2016 - 2030 (USD Million)
- Table 116 South Africa vascular grafts market for biological material based vascular grafts, by application, 2016 - 2030 (USD Million)
- Table 117 Saudi Arabia vascular grafts market, by product, 2016 - 2030 (USD Million)
- Table 118 Saudi Arabia vascular grafts market, by application, 2016 - 2030 (USD Million)
- Table 119 Saudi Arabia vascular grafts market for cardiac aneurysm, by application, 2016 - 2030 (USD Million)
- Table 120 Saudi Arabia vascular grafts market, by raw material, 2016 - 2030 (USD Million)
- Table 121 Saudi Arabia vascular grafts market for biological material based vascular grafts, by application, 2016 - 2030 (USD Million)
- Table 122 UAE vascular grafts market, by product, 2016 - 2030 (USD Million)
- Table 123 UAE vascular grafts market, by application, 2016 - 2030 (USD Million)
- Table 124 UAE vascular grafts market for cardiac aneurysm, by application, 2016 - 2030 (USD Million)
- Table 125 UAE vascular grafts market, by raw material, 2016 - 2030 (USD Million)
- Table 126 UAE vascular grafts market for biological material based vascular grafts, by application, 2016 - 2030 (USD Million)
List of Figures
- Fig. 1 Global vascular grafts market segmentation
- Fig. 2 Market research process
- Fig. 3 Information procurement
- Fig. 4 Primary research pattern
- Fig. 5 Market research approaches
- Fig. 6 Supply chain-based sizing & forecasting
- Fig. 7 QFD modeling for market share assessment
- Fig. 8 Company market share analysis, 2016 - 2021
- Fig. 9 Commodity flow model
- Fig. 10 Market formulation & validation
- Fig. 11 Market summary, 2021 (USD Million)
- Fig. 12 Market variables and trends analysis
- Fig. 13 Global vascular grafts market segmentation
- Fig. 14 Penetration & growth prospect mapping
- Fig. 15 Market driver relevance analysis (Current & future impact)
- Fig. 16 Market restraint relevance analysis (Current & future impact)
- Fig. 17 Company market position analysis, 2021
- Fig. 18 Global vascular grafts market, product outlook: Key takeaways (USD Million)
- Fig. 19 Global vascular grafts market: product movement analysis (USD Million)
- Fig. 20 Global hemodialysis access grafts market value estimates and forecasts, 2016 - 2030 (USD Million)
- Fig. 21 Global endovascular stent grafts market value estimates and forecasts, 2016 - 2030 (USD Million)
- Fig. 22 Global coronary artery by-pass grafts market value estimates and forecasts, 2016 - 2030 (USD Million)
- Fig. 23 Global vascular grafts for aorta disease market value estimates and forecasts, 2016 - 2030 (USD Million)
- Fig. 24 Global peripheral vascular grafts market value estimates and forecasts, 2016 - 2030 (USD Million)
- Fig. 25 Global vascular grafts market, application outlook: Key takeaways (USD Million)
- Fig. 26 Global vascular grafts market: application movement analysis (USD Million)
- Fig. 27 Global cardiac aneurysm market estimates and forecasts, 2016 - 2030 (USD Million)
- Fig. 28 Global endovascular stent graft market estimates and forecasts, 2016 - 2030 (USD Million)
- Fig. 29 Global vascular graft in cardiac aneurysm market estimates and forecasts, 2016 - 2030 (USD Million)
- Fig. 30 Global kidney failure market estimates and forecasts, 2016 - 2030 (USD Million)
- Fig. 31 Global vascular occlusion market estimates and forecasts, 2016 - 2030 (USD Million)
- Fig. 32 Global coronary artery disease market estimates and forecasts, 2016 - 2030 (USD Million)
- Fig. 33 Global vascular grafts market, raw material outlook: Key takeaways (USD Million)
- Fig. 34 Global vascular grafts market: raw material movement analysis (USD Million)
- Fig. 35 Global polyester vascular grafts market estimates and forecasts, 2016 - 2030 (USD Million)
- Fig. 36 Global polytetrafluoroethylene vascular market estimates and forecasts, 2016 - 2030 (USD Million)
- Fig. 37 Global polyurethane vascular grafts market estimates and forecasts, 2016 - 2030 (USD Million)
- Fig. 38 Global biological material based vascular grafts market estimates and forecasts, 2016 - 2030 (USD Million)
- Fig. 39 Global human saphenous and umbilical veins market estimates and forecasts, 2016 - 2030 (USD Million)
- Fig. 40 Global tissue engineered materials market estimates and forecasts, 2016 - 2030 (USD Million)
- Fig. 41 North America vascular grafts market estimates and forecasts, 2016 - 2030 (USD Million)
- Fig. 42 U.S. vascular grafts market estimates and forecasts, 2016 - 2030 (USD Million)
- Fig. 43 Canada vascular grafts market estimates and forecasts, 2016 - 2030 (USD Million)
- Fig. 44 Europe vascular grafts market estimates and forecasts, 2016 - 2030 (USD Million)
- Fig. 45 Germany vascular grafts market estimates and forecasts, 2016 - 2030 (USD Million)
- Fig. 46 U.K. vascular grafts market estimates and forecasts, 2016 - 2030 (USD Million)
- Fig. 47 France vascular grafts market estimates and forecasts, 2016 - 2030 (USD Million)
- Fig. 48 Italy vascular grafts market estimates and forecasts, 2016 - 2030 (USD Million)
- Fig. 49 Spain vascular grafts market estimates and forecasts, 2016 - 2030 (USD Million)
- Fig. 50 Asia Pacific vascular grafts market estimates and forecasts, 2016 - 2030 (USD Million)
- Fig. 51 Japan vascular grafts market estimates and forecasts, 2016 - 2030 (USD Million)
- Fig. 52 China vascular grafts market estimates and forecasts, 2016 - 2030 (USD Million)
- Fig. 53 India vascular grafts market estimates and forecasts, 2016 - 2030 (USD Million)
- Fig. 54 Singapore vascular grafts market estimates and forecasts, 2016 - 2030 (USD Million)
- Fig. 55 South Korea vascular grafts market estimates and forecasts, 2016 - 2030 (USD Million)
- Fig. 56 Latin America vascular grafts market estimates and forecasts, 2016 - 2030 (USD Million)
- Fig. 57 Brazil vascular grafts market estimates and forecasts, 2016 - 2030 (USD Million)
- Fig. 58 Mexico vascular grafts market estimates and forecasts, 2016 - 2030 (USD Million)
- Fig. 59 Argentina vascular grafts market estimates and forecasts, 2016 - 2030 (USD Million)
- Fig. 60 MEA vascular grafts market estimates and forecasts, 2016 - 2030 (USD Million)
- Fig. 61 South Africa vascular grafts market estimates and forecasts, 2016 - 2030 (USD Million)
- Fig. 62 Saudi Arabia vascular grafts market estimates and forecasts, 2016 - 2030 (USD Million)
- Fig. 63 UAE vascular grafts market estimates and forecasts, 2016 - 2030 (USD Million)
- Fig. 64 Company/Competition Categorization (Key innovators, Market leaders, Emerging Players)
- Fig. 65 Company Market Position Analysis (Geographic Presence, Product Portfolio, Key Alliance, Industry Experience)
Vascular Grafts Market Growth & Trends:
The global vascular grafts market size is anticipated to reach USD 3.1 billion by 2030 and is expected to expand at a CAGR of 7.0% during the forecast period, according to a new report by Grand View Research, Inc. The rising number of dialysis procedures and prevalence of chronic kidney diseases, heart attacks, atherosclerotic heart diseases, and stroke is boosting the adoption of vascular grafts. Moreover, the rising demand for minimally invasive surgeries among the population is impelling the market growth.
Furthermore, the increasing medical applications and developments in intraoperative techniques are driving the market. Peripheral vascular disease affects more than 200 million people worldwide. This is anticipated to raise the demand for vascular grafts during the forecast period. The outbreak of COVID-19 had a negative impact on the market growth due to the deferrals in non-essential medical procedures. It also affected the sales and operation of companies.
In 2021, the endovascular stent-graft products segment dominated the market with a revenue share of 63.8% due to its increasing adoption in response to the rising cases of aortic aneurysms. According to the data published by CDC, in 2019, about 9,904 deaths were witnessed due to aortic aneurysms in the United States. An unhealthy lifestyle has raised the prevalence of cardiac diseases and renal disease, thereby impelling the market growth.
Additionally, the increasing geriatric population and rising disposable income coupled with healthcare expenditure in emerging countries is contributing to market growth in these regions. The peripheral vascular grafts segment is expected to grow at the fastest rate due to increasing use in peripheral artery bypass. Also, the rising cases of hardening of arteries is boosting the demand for peripheral vascular graft.
The cardiac aneurysm application segment held the majority share in 2021 owing to the rising cases of raised blood pressure, hyperglycemia, hypercholesterolemia, etc. Also, the rising geriatric population and increasing cases of atherosclerotic heart diseases among the population are impelling the market growth. Moreover, the shifting trend toward minimally invasive treatments has raised the adoption of minimally invasive vascular implants to treat cardiac aneurysms, thereby boosting the segment growth.
On the other hand, the vascular occlusion application segment is anticipated to witness the fastest growth rate due to the increasing prevalence of vascular occlusion disease and the availability of graft procedures. Moreover, the development of novel therapies to treat vascular occlusion is anticipated to drive the market during the forecast period.
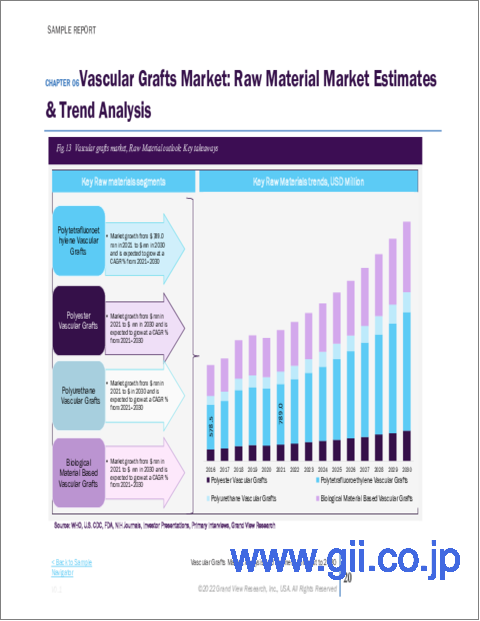
As of 2021, the polytetrafluoroethylene raw material segment held the majority share in the market and is expected to witness the fastest growth rate during the forecast period. The growth is attributed to its capability of tolerating pressures and flows in large and medium arteries; moreover, it offers low degradation and infection risk.
The key players offering innovative products that offer maximum protection and help reduce the pain is impelling the market growth. For instance, Biovic offers AVATAR PTFE Vascular Graft. It is developed using Humidity Resistant Technology and has porous microstructure on both internal and external surfaces to maximize tissue in-growth and healing response.
North America dominated the market in 2021 owing to the rising geriatric population and associated health diseases. Moreover, the well-developed healthcare infrastructure and rising adoption of products with technological advancement are propelling the market growth. Also, the increasing investments in research and development activities in the region are contributing to the market growth. On the other hand, MEA is expected to witness the fastest growth during the projection period due to rising cases of people suffering from cardiovascular diseases in the region.
Vascular Grafts Market Report Highlights:
- The global market size is anticipated to reach USD 3.1 billion by 2030, owing to the increasing prevalence of cardiovascular disease and the shifting trend toward minimally invasive procedures
- The endovascular stent-grafts product segment dominated the market in 2021 owing to rising cases of aneurysms and increasing patient preference for endovascular stent-grafts
- The cardiac aneurysm application segment dominated the market in 2021 owing to the rising prevalence of cardiovascular diseases across the globe
- Polytetrafluoroethylene raw material segment dominated the market in 2021 majorly due to the rising demand for engineered prosthetics products
- North America dominated the market in 2021 majorly due to the development of novel products, increasing R&D activities, and developed healthcare infrastructure
Table of Contents
Chapter 1. Methodology and Scope
- 1.1 Market Segmentation and Scope
- 1.2 Research Methodology
- 1.2.1 Information Procurement
- 1.3 Information or Data Analysis
- 1.4 Research Scope and Assumptions
- 1.4.1 Methodology
- 1.4.1.1 Analysis Of The Company Market Share
- 1.4.1.2 Analysis Of Commodity Flow Model
- 1.4.1 Methodology
- 1.5 Market Formulation & Validation
- 1.5.1 Global Market: CAGR Calculation
- 1.5.2 Global Segment Share Calculation
- 1.6 List to Data Sources
Chapter 2. Executive Summary
- 2.1 Market Outlook
- 2.2 Segment Outlook
- 2.3 Competitive Insights
Chapter 3. Global vascular grafts market Variables, Trends & Scope
- 3.1 Penetration and Growth Prospect Mapping
- 3.2 Global Vascular Grafts Market Dynamics
- 3.2.1 Market Driver Analysis
- 3.2.2 Market Restraint Analysis
- 3.2.3 Market Opportunity Analysis
- 3.3 Global Vascular Grafts Industry Analysis - Porter's
- 3.3.1 Bargaining Power Of The Suppliers
- 3.3.2 Bargaining Power Of The Buyers
- 3.3.3 Threat Of Substitution
- 3.3.4 Threats From New Entrants
- 3.3.5 Competitive Rivalry
- 3.4 Global Vascular Grafts Industry Analysis - PEST
- 3.4.1 Political Landscape
- 3.4.2 Economic Landscape
- 3.4.3 Social Landscape
- 3.4.4 Technology Landscape
- 3.5 Major Deals & Strategic Alliances Analysis
- 3.6 Impact of COVID-19 Pandemic on global vascular grafts market
Chapter 4. Global vascular grafts market: Competitive Analysis
- 4.1 Recent Developments & Impact Analysis, By Key Market Participants
- 4.2 Company/Competition Categorization (Key Innovators, Market Leaders, Emerging Players)
- 4.3 Vendor Landscape
- 4.3.1 List Of Key Distributors/Channel Partners
- 4.3.2 Key Customers)
- 4.3.3 Company Sales Value, 2016 To 2021 (USD Million)
- 4.3.4 Key Customers List Of Key Emerging Companies/Technology Disruptors/ Innovators
- 4.3.5 Company Market Position Analysis (Geographical Presence, Product Portfolio, Key Alliance, Industry Experience)
Chapter 5. Global vascular grafts market: Product Market Estimates & Trend Analysis
- 5.1 Global Vascular Grafts Market: Product Analysis
- 5.1.1 Hemodialysis Access Grafts
- 5.1.1.1 Global hemodialysis access grafts market value estimates and forecasts, 2016 - 2030 (USD Million)
- 5.1.2 Endovascular Stent Grafts
- 5.1.2.1 Global endovascular stent grafts market value estimates and forecasts, 2016 - 2030 (USD Million)
- 5.1.3 Coronary Artery By-Pass Grafts
- 5.1.3.1 Global coronary artery by-pass grafts market value estimates and forecasts, 2016 - 2030 (USD Million)
- 5.1.4 Vascular Grafts For Aorta Disease
- 5.1.4.1 Global vascular grafts for aorta disease market value estimates and forecasts, 2016 - 2030 (USD Million)
- 5.1.5 Peripheral Vascular Grafts
- 5.1.5.1 Global peripheral vascular grafts market value estimates and forecasts, 2016 - 2030 (USD Million)
- 5.1.1 Hemodialysis Access Grafts
Chapter 6. Global vascular grafts market: Application Estimates & Trend Analysis
- 6.1 Global Vascular Grafts Market: Application Movement Analysis
- 6.1.1 Cardiac Aneurysm
- 6.1.1.1 Global cardiac aneurysm market estimates and forecasts, 2016 - 2030 (USD Million)
- 6.1.1.2 Endovascular Stent Graft
- 6.1.1.2.1 Global endovascular stent graft market estimates and forecasts, 2016 - 2030 (USD Million)
- 6.1.1.3 Vascular Graft In Cardiac Aneurysm
- 6.1.1.3.1 Global vascular graft in cardiac aneurysm market estimates and forecasts, 2016 - 2030 (USD Million)
- 6.1.2 Kidney Failure
- 6.1.2.1 Global kidney failure market estimates and forecasts, 2016 - 2030 (USD Million)
- 6.1.3 Vascular Occlusion
- 6.1.3.1 Global vascular occlusion market estimates and forecasts, 2016 - 2030 (USD Million)
- 6.1.4 Coronary Artery Disease
- 6.1.4.1 Global coronary artery disease market estimates and forecasts, 2016 - 2030 (USD Million)
- 6.1.1 Cardiac Aneurysm
Chapter 7. Global vascular grafts market: Raw Material Estimates & Trend Analysis
- 7.1 Global Vascular Grafts Market: Raw Material Movement Analysis
- 7.1.1 Polyester Vascular Grafts
- 7.1.1.1 Global polyester vascular grafts market estimates and forecasts, 2016 - 2030 (USD Million)
- 7.1.2 Polytetrafluoroethylene Vascular Grafts
- 7.1.2.1 Global polytetrafluoroethylene vascular grafts market estimates and forecasts, 2016 - 2030 (USD Million)
- 7.1.3 Polyurethane Vascular Grafts
- 7.1.3.1 Global polyurethane vascular grafts market estimates and forecasts, 2016 - 2030 (USD Million)
- 7.1.4 Biological Material Based Vascular Grafts
- 7.1.4.1 Global biological material based vascular grafts market estimates and forecasts, 2016 - 2030 (USD Million)
- 7.1.4.2 Human Saphenous and Umbilical Veins
- 7.1.4.2.1 Global human saphenous and umbilical veins market estimates and forecasts, 2016 - 2030 (USD Million)
- 7.1.4.3 Tissue Engineered Materials
- 7.1.4.3.1 Global tissue engineered materials market estimates and forecasts, 2016 - 2030 (USD Million)
- 7.1.1 Polyester Vascular Grafts
Chapter 8. Vascular Grafts Market: Regional Estimates & Trend Analysis
- 8.1 Regional market snapshot (USD Million)
- 8.2 Vascular grafts market: regional movement analysis, USD Million, 2020 & 2030, USD Million
- 8.3 North America
- 8.3.1 North America vascular grafts market estimates and forecasts, 2016 -2030 (USD Million)
- 8.3.2 U.S.
- 8.3.2.1 U.S. vascular grafts market estimates and forecasts, 2016 - 2030 (USD Million)
- 8.3.3 Canada
- 8.3.3.1 Canada vascular grafts market estimates and forecasts, 2016 - 2030 (USD Million)
- 8.4 Europe
- 8.4.1 Europe vascular grafts market estimates and forecasts, 2016 - 2030 (USD Million )
- 8.4.2 Germany
- 8.4.2.1 Germany vascular grafts market estimates and forecasts, 2016 - 2030 (USD Million ))
- 8.4.3 U.K.
- 8.4.3.1 U.K. vascular grafts market estimates and forecasts, 2016 - 2030 (USD Million )
- 8.4.4 France
- 8.4.4.1 France vascular grafts market estimates and forecasts, 2016 - 2030 (USD Million )
- 8.4.5 Italy
- 8.4.5.1 Italy vascular grafts market estimates and forecasts, 2016 - 2030 (USD Million )
- 8.4.6 Spain
- 8.4.6.1 Spain vascular grafts market estimates and forecasts, 2016 - 2030 (USD Million )
- 8.5 Asia Pacific
- 8.5.1 Asia Pacific vascular grafts market estimates and forecasts, 2016 - 2030 (USD Million )
- 8.5.2 Japan
- 8.5.2.1 Japan vascular grafts market estimates and forecasts, 2016 - 2030 (USD Million )
- 8.5.3 China
- 8.5.3.1 China vascular grafts market estimates and forecasts, 2016 - 2030 (USD Million )
- 8.5.4 India
- 8.5.4.1 India vascular grafts market estimates and forecasts, 2016 - 2030 (USD Million )
- 8.5.5 Singapore
- 8.5.5.1 Singapore vascular grafts market estimates and forecasts, 2016 - 2030 (USD Million )
- 8.5.6 South Korea
- 8.5.6.1 South Korea vascular grafts market estimates and forecasts, 2016 - 2030 (USD Million )
- 8.6 Latin America
- 8.6.1 Latin America vascular grafts market estimates and forecasts, 2016 - 2030 (USD Million )
- 8.6.2 Brazil
- 8.6.2.1 Brazil vascular grafts market estimates and forecasts, 2016 - 2030 (USD Million )
- 8.6.3 Mexico
- 8.6.3.1 Mexico vascular grafts market estimates and forecasts, 2016 - 2030 (USD Million )
- 8.6.4 Argentina
- 8.6.4.1 Argentina vascular grafts market estimates and forecasts, 2016 - 2030 (USD Million )
- 8.7 MEA
- 8.7.1 MEA vascular grafts market estimates and forecasts, 2016 - 2030 (USD Million)
- 8.7.2 South Africa
- 8.7.2.1 South Africa vascular grafts market estimates and forecasts, 2016 - 2030 (USD Million)
- 8.7.3 Saudi Arabia
- 8.7.3.1 Saudi Arabia vascular grafts market estimates and forecasts, 2016 - 2030 (USD Million)
- 8.7.4 UAE
- 8.7.4.1 UAE vascular grafts market estimates and forecasts, 2016 - 2030 (USD Million)
Chapter 9. Competitive Landscape
- 9.1 Company Profiles
- 9.1.1 Medtronic plc
- 9.1.1.1 Company Overview
- 9.1.1.2 Financial Performance
- 9.1.1.3 Product Benchmarking
- 9.1.1.4 Strategic initiatives
- 9.1.2 Terumo Corporation
- 9.1.2.1 Company Overview
- 9.1.2.2 Financial Performance
- 9.1.2.3 Product Benchmarking
- 9.1.2.4 Strategic Initiatives
- 9.1.3 LeMaitre Vascular, Inc.
- 9.1.3.1 Company Overview
- 9.1.3.2 Financial Performance
- 9.1.3.3 Product Benchmarking
- 9.1.3.4 Strategic Initiatives
- 9.1.4 C.R. Bard; W.L. Gore and Associates, Inc.
- 9.1.4.1 Company Overview
- 9.1.4.2 Financial Performance
- 9.1.4.3 Product Benchmarking
- 9.1.4.4 Strategic Initiatives
- 9.1.5 Cook
- 9.1.5.1 Company Overview
- 9.1.5.2 Financial Performance
- 9.1.5.3 Product Benchmarking
- 9.1.5.4 Strategic Initiatives
- 9.1.6 Shanghai Suokang Medical Implants Co. Ltd.
- 9.1.6.1 Company Overview
- 9.1.6.2 Financial Performance
- 9.1.6.3 Product Benchmarking
- 9.1.6.4 Strategic Initiatives
- 9.1.7 Getinge AB
- 9.1.7.1 Company Overview
- 9.1.7.2 Financial Performance
- 9.1.7.3 Product Benchmarking
- 9.1.7.4 Strategic Initiatives
- 9.1.1 Medtronic plc