|
|
市場調査レポート
商品コード
1301170
ラボオートメーションの市場規模、シェア、動向分析レポート:プロセス別、オートメーションタイプ別、最終用途別、地域別、セグメント予測、2023年~2030年Lab Automation Market Size, Share & Trends Analysis Report By Process (Continuous Flow, Discrete Processing), By Automation Type (Total Automation Systems, Modular Automation Systems), By End-use, By Region, And Segment Forecasts, 2023 - 2030 |
||||||
|
|
|||||||
|
● お客様のご希望に応じて、既存データの加工や未掲載情報(例:国別セグメント)の追加などの対応が可能です。 詳細はお問い合わせください。 |
|||||||


| ラボオートメーションの市場規模、シェア、動向分析レポート:プロセス別、オートメーションタイプ別、最終用途別、地域別、セグメント予測、2023年~2030年 |
|
出版日: 2023年06月30日
発行: Grand View Research
ページ情報: 英文 200 Pages
納期: 2~10営業日
|
- 全表示
- 概要
- 図表
- 目次
ラボオートメーション市場の成長と動向
GrandView Research, Inc.の最新レポートによると、世界のラボオートメーション市場規模は、予測期間中にCAGR 6.64%を記録し、2030年までに116億米ドルに達すると予測されています。
コスト削減ニーズの高まりと相まって、より高い効率性と生産性への要求が高まっていることなどが成長を促進しています。さらに、技術の進歩とラボのワークフローの複雑化が市場拡大にさらに寄与しています。例えば、先進的で近代的なラボでは、数多くの複雑なプロセスや高スループットのワークフローを扱っているため、そのような複雑なプロセスを簡素化するために、先進的なラボシステムがラボから高い需要を得ています。
ラボプロセスのスピードアップを目的としたラボオートメーションアプリケーションの増加は、市場拡大に寄与する主な要因の1つです。例えば、臨床化学アプリケーションは、固相抽出、粉末投与、重量希釈、サンプル抽出、分析のためのサンプル調製などのタスクのためのラボオートメーションに置き換えられています。同様に、合成生物学のワークフロープロセスでは、DNA断片の構築、宿主生物の培養、コロニー選択、最終データ収集、分析などのタスクが自動化プロセスに置き換えられています。したがって、アプリケーション数の増加が、今後数年間の採用を促進すると予想されます。
さらに、ラボの自動化と高度なデジタル化および接続性の動向との統合の高まりは、今後数年間、市場に大きな成長機会を提供すると思われます。先進的なラボ機器とクラウドベースのプラットフォーム、LIMSプラットフォームの統合により、リアルタイムのデータモニタリングや、より優れた柔軟性と効率性のための便利なデータ交換が可能になります。また、最近のデジタル製品のイントロダクションは、予測期間中に市場をさらに牽引すると予測されています。例えば、2022年12月にLabVantage Solutions, Inc.は新しいLIMSプラットフォームを発表し、ラボのプロセス迅速化とプロセス全体のコスト低減を支援しています。
さらに、市場参入企業による新発売、提携、買収、新施設拡張などの有機的・無機的な様々な開拓は、市場成長にプラスの影響を与えそうです。例えば、QIAGENは2023年1月、診断ラボにおける自動サンプル処理用の新しいEZ2 connect MDXプラットフォームを発表しました。同様に、2023年4月、モルゲンはラボオートメーションシステムのリーダーであるSynchron lab automationを買収しました。この買収により、モルゲンは顧客向けに高度な自動化ソリューションを効率的に構築できるようになっています。
ラボオートメーション市場レポートハイライト
- 連続フロー分野は、2022年に56.93%の最大収益シェアを占めました。これは、産業界における連続フローシステムに対する需要の高まりと、高品質なサービスを提供するためのラボにおける連続フローの採用が急増していること別。
- モジュラーオートメーションシステムセグメントが市場を独占し、2022年には51.69%の最大収益シェアを占めました。
- 臨床化学分析装置の最終用途セグメントは、2022年に最大の収益シェアを占めました。技術の進歩、自動化された検査機器への嗜好の高まり、臨床化学ラボにおけるサンプルハンドリング、保管、ラベリングのための高度なシステムに対する需要の高まりなどの要因が、このセグメントの最大収益シェアに寄与しています。
- 北米は、2022年に35.76%の収益シェアでラボオートメーションの世界市場を独占しました。これは、確立されたヘルスケアフレームワークの存在と、ラボ全体の高度なシステムに対する旺盛な需要に起因します。
目次
第1章 調査手法と範囲
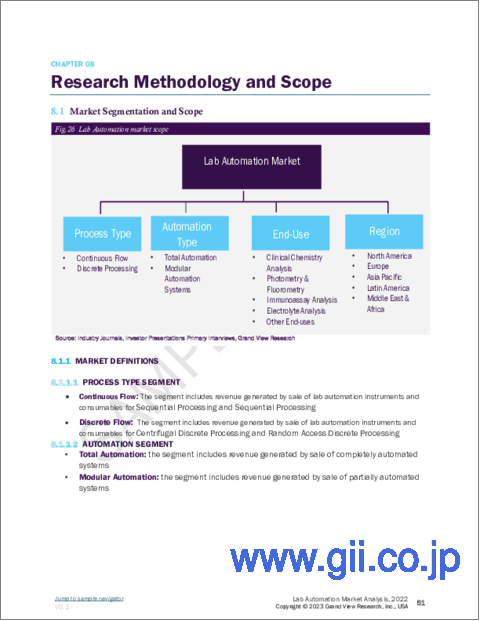
- 市場セグメンテーションと範囲
- 市場の定義
- 調査の仮定
- 情報調達
- 情報またはデータ分析
- 市場の形成と検証
- 市場モデル
- 世界市場:CAGRの計算
- 目的
第2章 エグゼクティブサマリー
- 市場スナップショット
- セグメントのスナップショット
- 競合情勢のスナップショット
第3章 市場変数、動向、および範囲
- 市場系統の見通し
- 親市場の見通し
- 関連/アンシラリー市場見通し
- 市場力学
- 市場促進要因分析
- 市場抑制要因分析
- 業界分析ツール
- ポーターのファイブフォース分析
- PESTEL分析
- COVID-19感染症の影響分析
第4章 プロセスのビジネス分析
- ラボオートメーション市場:プロセスの変動分析
- 連続フロー
- 連続フロー市場、2018~2030年
- ワークフロー別
- コンポーネント別
- ディスクリート処理
- ディスクリート処理市場、2018~2030年
- 方法別
- コンポーネント別
- ワークフロー別
第5章 オートメーションタイプのビジネス分析
- ラボオートメーション市場:オートメーションタイプの変動分析
- トータルオートメーション
- トータルオートメーション市場、2018年~2030年
- ステップ別
- モジュラーオートメーションシステム
- モジュラーオートメーションシステム市場、2018年~2030年
- ステップ別
第6章 最終用途のビジネス分析
- ラボオートメーション市場:最終用途の変動分析
- 臨床化学分析
- 測光と蛍光測定
- 免疫測定分析
- 電解質分析
- その他の最終用途
第7章 地域のビジネス分析
- ラボオートメーション市場シェア、地域別、2022年および2030年
- 北米
- SWOT分析
- 北米ラボオートメーション市場、2018年~2030年
- 米国
- カナダ
- 欧州
- SWOT分析
- 欧州ラボオートメーション市場、2018年~2030年
- 英国
- ドイツ
- フランス
- イタリア
- スペイン
- デンマーク
- スウェーデン
- ノルウェー
- アジア太平洋地域
- SWOT分析
- アジア太平洋ラボオートメーション市場、2018年~2030年
- 日本
- 中国
- インド
- オーストラリア
- タイ
- 韓国
- ラテンアメリカ
- SWOT分析
- ラテンアメリカのラボオートメーション市場、2018年~2030年
- ブラジル
- メキシコ
- アルゼンチン
- MEA
- SWOT分析
- MEAラボオートメーション市場、2018年~2030年
- 南アフリカ
- サウジアラビア
- アラブ首長国連邦
- クウェート
第8章 競合情勢
- 企業の分類
- 戦略マッピング
- 企業の市況分析、2022年
- 企業プロファイル・一覧
- QIAGEN
- PerkinElmer Inc.
- Thermo Fisher Scientific, Inc.
- Siemens Healthcare GmbH
- Danaher
- Agilent Technologies, Inc.
- Eppendorf SE
- Hudson Robotics
- Aurora Biomed Inc.
- BMG LABTECH GmbH
- F. Hoffmann-La Roche Ltd
List of Tables
- TABLE 1 List of Secondary Sources
- TABLE 2 List of Abbreviations
- TABLE 3 Regulatory Framework
- TABLE 4 Global Lab Automation Market, By Process, 2018 - 2030 (USD Million)
- TABLE 5 Global Lab Automation Market, By Automation Type, 2018 - 2030 (USD Million)
- TABLE 6 Global Lab Automation Market, By End-use, 2018 - 2030 (USD Million)
- TABLE 7 Global Lab Automation Market, By Region, 2018 - 2030 (USD Million)
- TABLE 8 North America Lab Automation Market, By Country, 2018 - 2030 (USD Million)
- TABLE 9 North America Lab Automation Market, By Process, 2018 - 2030 (USD Million)
- TABLE 10 North America Lab Automation Market, By Automation Type, 2018 - 2030 (USD Million)
- TABLE 11 North America Lab Automation Market, By End-use, 2018 - 2030 (USD Million)
- TABLE 12 U.S. Lab Automation Market, By Process, 2018 - 2030 (USD Million)
- TABLE 13 U.S. Lab Automation Market, By Automation Type, 2018 - 2030 (USD Million)
- TABLE 14 U.S. Lab Automation Market, By End-use, 2018 - 2030 (USD Million)
- TABLE 15 Canada Lab Automation Market, By Process, 2018 - 2030 (USD Million)
- TABLE 16 Canada Lab Automation Market, By Automation Type, 2018 - 2030 (USD Million)
- TABLE 17 Canada Lab Automation Market, By End-use, 2018 - 2030 (USD Million)
- TABLE 18 Europe Lab Automation Market, By Country, 2018 - 2030 (USD Million)
- TABLE 19 Europe Lab Automation Market, By Automation Type, 2018 - 2030 (USD Million)
- TABLE 20 Europe Lab Automation Market, By Process, 2018 - 2030 (USD Million)
- TABLE 21 Europe Lab Automation Market, By End-use, 2018 - 2030 (USD Million)
- TABLE 22 UK Lab Automation Market, By Process, 2018 - 2030 (USD Million)
- TABLE 23 UK Lab Automation Market, By Automation Type, 2018 - 2030 (USD Million)
- TABLE 24 UK Lab Automation Market, By End-use, 2018 - 2030 (USD Million),
- TABLE 25 Germany Lab Automation Market, By Process, 2018 - 2030 (USD Million)
- TABLE 26 Germany Lab Automation Market, By Automation Type, 2018 - 2030 (USD Million)
- TABLE 27 Germany Lab Automation Market, By End-use, 2018 - 2030 (USD Million)
- TABLE 28 France Lab Automation Market, By Process, 2018 - 2030 (USD Million)
- TABLE 29 France Lab Automation Market, By Automation Type, 2018 - 2030 (USD Million)
- TABLE 30 France Lab Automation Market, By End-use, 2018 - 2030 (USD Million)
- TABLE 31 Spain Lab Automation Market, By Process, 2018 - 2030 (USD Million)
- TABLE 32 Spain Lab Automation Market, By Automation Type, 2018 - 2030 (USD Million)
- TABLE 33 Spain Lab Automation Market, By End-use, 2018 - 2030 (USD Million)
- TABLE 34 Italy Lab Automation Market, By Process, 2018 - 2030 (USD Million)
- TABLE 35 Italy Lab Automation Market, By Automation Type, 2018 - 2030 (USD Million)
- TABLE 36 Italy Lab Automation Market, By End-use, 2018 - 2030 (USD Million)
- TABLE 37 Denmark Lab Automation Market, By Process, 2018 - 2030 (USD Million)
- TABLE 38 Denmark Lab Automation Market, By Automation Type, 2018 - 2030 (USD Million)
- TABLE 39 Denmark Lab Automation Market, By End-use, 2018 - 2030 (USD Million)
- TABLE 40 Norway Lab Automation Market, By Process, 2018 - 2030 (USD Million)
- TABLE 41 Norway Lab Automation Market, By Automation Type, 2018 - 2030 (USD Million)
- TABLE 42 Norway Lab Automation Market, By End-use, 2018 - 2030 (USD Million)
- TABLE 43 Sweden Lab Automation Market, By Process, 2018 - 2030 (USD Million)
- TABLE 44 Sweden Lab Automation Market, By Automation Type, 2018 - 2030 (USD Million)
- TABLE 45 Sweden Lab Automation Market, By End-use, 2018 - 2030 (USD Million)
- TABLE 46 Asia Pacific Lab Automation Market, By Country, 2018 - 2030 (USD Million)
- TABLE 47 Asia Pacific Lab Automation Market, By Process, 2018 - 2030 (USD Million)
- TABLE 48 Asia Pacific Lab Automation Market, By Automation Type, 2018 - 2030 (USD Million)
- TABLE 49 Asia Pacific Lab Automation Market, By End-use, 2018 - 2030 (USD Million)
- TABLE 50 China Lab Automation Market, By Process, 2018 - 2030 (USD Million)
- TABLE 51 China Lab Automation Market, By Automation Type, 2018 - 2030 (USD Million)
- TABLE 52 China Lab Automation Market, By End-use, 2018 - 2030 (USD Million)
- TABLE 53 Japan Lab Automation Market, By Process, 2018 - 2030 (USD Million)
- TABLE 54 Japan Lab Automation Market, By Automation Type, 2018 - 2030 (USD Million)
- TABLE 55 Japan Lab Automation Market, By End-use, 2018 - 2030 (USD Million)
- TABLE 56 India Lab Automation Market, By Process, 2018 - 2030 (USD Million)
- TABLE 57 India Lab Automation Market, By Automation Type, 2018 - 2030 (USD Million)
- TABLE 58 India Lab Automation Market, By End-use, 2018 - 2030 (USD Million)
- TABLE 59 South Korea Lab Automation Market, By Process, 2018 - 2030 (USD Million)
- TABLE 60 South Korea Lab Automation Market, By Automation Type, 2018 - 2030 (USD Million)
- TABLE 61 South Korea Lab Automation Market, By End-use, 2018 - 2030 (USD Million)
- TABLE 62 Australia Lab Automation Market, By Process, 2018 - 2030 (USD Million)
- TABLE 63 Australia Lab Automation Market, By Automation Type, 2018 - 2030 (USD Million)
- TABLE 64 Australia Lab Automation Market, By End-use, 2018 - 2030 (USD Million)
- TABLE 65 Thailand Lab Automation Market, By Process, 2018 - 2030 (USD Million)
- TABLE 66 Thailand Lab Automation Market, By Automation Type, 2018 - 2030 (USD Million)
- TABLE 67 Thailand Lab Automation Market, By End-use, 2018 - 2030 (USD Million)
- TABLE 68 Latin America Lab Automation Market, By Country, 2018 - 2030 (USD Million)
- TABLE 69 Latin America Lab Automation Market, By Process, 2018 - 2030 (USD Million)
- TABLE 70 Latin America Lab Automation Market, By Automation Type, 2018 - 2030 (USD Million)
- TABLE 71 Latin America Lab Automation Market, By End-use, 2018 - 2030 (USD Million),
- TABLE 72 Brazil Lab Automation Market, By Process, 2018 - 2030 (USD Million)
- TABLE 73 Brazil Lab Automation Market, By Automation Type, 2018 - 2030 (USD Million)
- TABLE 74 Brazil Lab Automation Market, By End-use, 2018 - 2030 (USD Million)
- TABLE 75 Mexico Lab Automation Market, By Process, 2018 - 2030 (USD Million)
- TABLE 76 Mexico Lab Automation Market, By Automation Type, 2018 - 2030 (USD Million)
- TABLE 77 Mexico Lab Automation Market, By End-use, 2018 - 2030 (USD Million)
- TABLE 78 Argentina Lab Automation Market, By Process, 2018 - 2030 (USD Million),
- TABLE 79 Argentina Lab Automation Market, By Automation Type, 2018 - 2030 (USD Million)
- TABLE 80 Argentina Lab Automation Market, By End-use, 2018 - 2030 (USD Million)
- TABLE 81 MEA Lab Automation Market, By Country, 2018 - 2030 (USD Million)
- TABLE 82 MEA Lab Automation Market, By Process, 2018 - 2030 (USD Million)
- TABLE 83 MEA Lab Automation Market, By Automation Type, 2018 - 2030 (USD Million)
- TABLE 84 MEA Lab Automation Market, By End-use, 2018 - 2030 (USD Million),
- TABLE 85 South Africa Lab Automation Market, By Process, 2018 - 2030 (USD Million)
- TABLE 86 South Africa Lab Automation Market, By Automation Type, 2018 - 2030 (USD Million)
- TABLE 87 South Africa Lab Automation Market, By End-use, 2018 - 2030 (USD Million)
- TABLE 88 UAE Lab Automation Market, By Process, 2018 - 2030 (USD Million)
- TABLE 89 UAE Lab Automation Market, By Automation Type, 2018 - 2030 (USD Million)
- TABLE 90 UAE Lab Automation Market, By End-use, 2018 - 2030 (USD Million)
- TABLE 91 Saudi Arabia Lab Automation Market, By Process, 2018 - 2030 (USD Million),
- TABLE 92 Saudi Arabia Lab Automation Market, By Automation Type, 2018 - 2030 (USD Million)
- TABLE 93 Saudi Arabia Lab Automation Market, By End-use, 2018 - 2030 (USD Million)
- TABLE 94 Kuwait Lab Automation Market, By Process, 2018 - 2030 (USD Million)
- TABLE 95 Kuwait Lab Automation Market, By Automation Type, 2018 - 2030 (USD Million)
- TABLE 96 Kuwait Lab Automation Market, By End-use, 2018 - 2030 (USD Million)
List of Figures
- FIG. 1 Market research process
- FIG. 2 Information procurement
- FIG. 3 Primary research pattern
- FIG. 4 Market research approaches
- FIG. 5 Value chain-based sizing & forecasting
- FIG. 6 Market formulation & validation
- FIG. 7 Hair growth supplements market segmentation
- FIG. 8 Market snapshot, 2022
- FIG. 9 Market trends & outlook
- FIG. 10 Market driver relevance analysis (current & future impact)
- FIG. 11 Market restraint relevance analysis (current & future impact)
- FIG. 12 PESTEL analysis
- FIG. 13 Porter's five forces analysis
- FIG. 14 Global lab automation market: Process movement analysis
- FIG. 15 Global lab automation market, for continuous flow, 2018 - 2030 (USD Million)
- FIG. 16 Global lab automation market, by workflow, 2018 - 2030 (USD Million)
- FIG. 17 Global lab automation market, for sequential processing, 2018 - 2030 (USD Million)
- FIG. 18 Global lab automation market, for parallel processing, 2018 - 2030 (USD Million)
- FIG. 19 Global lab automation market, by component, 2018 - 2030 (USD Million)
- FIG. 20 Global lab automation market, for consumables, 2018 - 2030 (USD Million)
- FIG. 21 Global lab automation market, for by equipment, 2018 - 2030 (USD Million)
- FIG. 22 Global lab automation market, for discrete processing, 2018 - 2030 (USD Million)
- FIG. 23 Global lab automation market, by method, 2018 - 2030 (USD Million)
- FIG. 24 Global lab automation market, for centrifugal discrete processing, 2018 - 2030 (USD Million)
- FIG. 25 Global lab automation market, for random access discrete processing, 2018 - 2030 (USD Million)
- FIG. 26 Global lab automation market, by component, 2018 - 2030 (USD Million)
- FIG. 27 Global lab automation market, for consumables, 2018 - 2030 (USD Million)
- FIG. 28 Global lab automation market, by equipment, 2018 - 2030 (USD Million)
- FIG. 29 Global lab automation market, by workflow, 2018 - 2030 (USD Million)
- FIG. 30 Global lab automation market, for dependent analysis, 2018 - 2030 (USD Million)
- FIG. 31 Global lab automation market, by independent analysis, 2018 - 2030 (USD Million)
- FIG. 32 Global lab automation market: Automation type movement analysis
- FIG. 33 Global lab automation market, for total automation systems, 2018 - 2030 (USD Million)
- FIG. 34 Global lab automation market, by steps, 2018 - 2030 (USD Million)
- FIG. 35 Global lab automation market, for pre-analysis, 2018 - 2030 (USD Million)
- FIG. 36 Global lab automation market, for centrifugation, 2018 - 2030 (USD Million)
- FIG. 37 Global lab automation market, for sample preparation, 2018 - 2030 (USD Million)
- FIG. 38 Global lab automation market, for sample sorting, 2018 - 2030 (USD Million)
- FIG. 39 Global lab automation market, for transport mechanisms, 2018 - 2030 (USD Million)
- FIG. 40 Global lab automation market, for liquid handling, 2018 - 2030 (USD Million)
- FIG. 41 Global lab automation market, for sample storage, 2018 - 2030 (USD Million)
- FIG. 42 Global lab automation market, for sample analysis, 2018 - 2030 (USD Million)
- FIG. 43 Global lab automation market, for modular automation systems, 2018 - 2030 (USD Million)
- FIG. 44 Global lab automation market, by steps, 2018 - 2030 (USD Million)
- FIG. 45 Global lab automation market, for specimen acquisition & identification & labeling, 2018 - 2030 (USD Million)
- FIG. 46 Global lab automation market, for transport mechanisms, 2018 - 2030 (USD Million)
- FIG. 47 Global lab automation market, for sample preparation, 2018 - 2030 (USD Million)
- FIG. 48 Global lab automation market, for sample loading & aspiration, 2018 - 2030 (USD Million)
- FIG. 49 Global lab automation market, for reagent handling & storage, 2018 - 2030 (USD Million)
- FIG. 50 Global lab automation market, for sample analysis & measurements, 2018 - 2030 (USD Million)
- FIG. 51 Global lab automation market: End-use movement analysis
- FIG. 52 Global lab automation market, for clinical chemistry analysis, 2018 - 2030 (USD Million)
- FIG. 53 Global lab automation market, for photometry & fluorometry, 2018 - 2030 (USD Million)
- FIG. 54 Global lab automation market, for immunoassay analysis, 2018 - 2030 (USD Million)
- FIG. 55 Global lab automation market, for electrolyte analysis, 2018 - 2030 (USD Million)
- FIG. 56 Global lab automation market, for other end-uses, 2018 - 2030 (USD Million)
- FIG. 57 Regional marketplace: Key takeaways
- FIG. 58 Regional outlook, 2022 & 2030
- FIG. 59 Global lab automation market: Region movement analysis
- FIG. 60 North America lab automation market, 2018 - 2030 (USD Million)
- FIG. 61 US lab automation market, 2018 - 2030 (USD Million)
- FIG. 62 Canada lab automation market, 2018 - 2030 (USD Million)
- FIG. 63 Europe lab automation market, 2018 - 2030 (USD Million)
- FIG. 64 Germany lab automation market, 2018 - 2030 (USD Million)
- FIG. 65 UK lab automation market, 2018 - 2030 (USD Million)
- FIG. 66 France lab automation market, 2018 - 2030 (USD Million)
- FIG. 67 Italy lab automation market, 2018 - 2030 (USD Million)
- FIG. 68 Spain lab automation market, 2018 - 2030 (USD Million)
- FIG. 69 Denmark lab automation market, 2018 - 2030 (USD Million)
- FIG. 70 Sweden lab automation market, 2018 - 2030 (USD Million)
- FIG. 71 Norway lab automation market, 2018 - 2030 (USD Million)
- FIG. 72 Asia Pacific lab automation market, 2018 - 2030 (USD Million)
- FIG. 73 Japan lab automation market, 2018 - 2030 (USD Million)
- FIG. 74 China lab automation market, 2018 - 2030 (USD Million)
- FIG. 75 India lab automation market, 2018 - 2030 (USD Million)
- FIG. 76 Australia lab automation market, 2018 - 2030 (USD Million)
- FIG. 77 South Korea lab automation market, 2018 - 2030 (USD Million)
- FIG. 78 Thailand lab automation market, 2018 - 2030 (USD Million)
- FIG. 79 Latin America lab automation market, 2018 - 2030 (USD Million)
- FIG. 80 Brazil lab automation market, 2018 - 2030 (USD Million)
- FIG. 81 Mexico lab automation market, 2018 - 2030 (USD Million)
- FIG. 82 Argentina lab automation market, 2018 - 2030 (USD Million)
- FIG. 83 Middle East and Africa lab automation market, 2018 - 2030 (USD Million)
- FIG. 84 South Africa lab automation market, 2018 - 2030 (USD Million)
- FIG. 85 Saudi Arabia lab automation market, 2018 - 2030 (USD Million)
- FIG. 86 UAE lab automation market, 2018 - 2030 (USD Million)
- FIG. 87 Kuwait lab automation market, 2018 - 2030 (USD Million)
Lab Automation Market Growth & Trends
The global lab automation market size is expected to reach USD 11.60 billion by 2030, registering a CAGR of 6.64% during the forecast period, according to a new report by Grand View Research, Inc. Factors such as increasing demand for higher efficiency & productivity coupled with the rising need for cost reduction are driving the growth. Moreover, technological advancements and the growing complexity of laboratory workflows are further contributing to the market expansion. For instance, advanced and modern labs deal with numerous complex processes and high throughput workflows, thus, to simplify such complex processes advanced lab systems are in high demand from laboratories.
The rising application of lab automation for speeding up laboratory processes is one of the major factors contributing to market expansion. For instance, Clinical chemistry applications have been replaced by lab automation for tasks such as solid-phase extraction, powder dosing, dilution to weight, sample extraction, and sample preparation for analysis. Similarly, for synthetic biology workflow processes, tasks such as DNA fragment construction, the culture of the host organism, colony selection, final data collection, and analysis have been replaced by automated processes. Therefore, an increase in the number of applications is expected to fuel their adoption in the coming years.
Moreover, the rising integration of lab automation with advanced digitalization and connectivity trends is likely to offer significant growth opportunities for the market in the coming years. Integration of advanced laboratory equipment with cloud-based platforms, and LIMS platforms allow real-time data monitoring, and convenient data exchange for better flexibility and efficiency. Also, recent digital product introductions are anticipated to offer more traction for the market over the forecast period. For instance, in December 2022 LabVantage Solutions, Inc. launched its new LIMS platform to help labs process faster and lower the overall cost of the process.
Furthermore, various organic and inorganic developments done by market players in term of new launches, collaborations, acquisitions, and new facility expansions are likely to have a positive impact on market growth. For instance, in January 2023 QIAGEN launched its new EZ2 connect MDX platform for automatic sample processing in diagnostic laboratories. Similarly, in April 2023 Molgen acquired Synchron lab automation, a leader in lab automated systems. This acquisition helped Molgen to efficiently build advanced automated solutions for its customers.
Lab Automation Market Report Highlights
- The continuous flow segment held the largest revenue share of 56.93% in 2022, owing to the higher demand for continuous flow systems in industries and the surging adoption of continuous flow in laboratories for offering high-quality services
- The modular automation systems segment dominated the market and accounted for the largest revenue share of 51.69% in 2022, attributed to the mix-and-match capabilities and flexibility capabilities offered by modular systems
- Clinical chemistry analyzers end-use segment held the largest revenue share in 2022. Factors such as technological advancements, rising preference for automated laboratory instruments, and higher demand for advanced systems in clinical chemistry labs for sample handling, storage, and labeling are contributing to the largest revenue share of the segment
- North America dominated the global market for lab automation with a revenue share of 35.76% in 2022, attributed to the presence of a well-established healthcare framework, and robust demand for advanced systems across laboratories
Table of Contents
Chapter 1. Methodology and Scope
- 1.1. Market Segmentation and Scope
- 1.2. Market Definitions
- 1.2.1. Information Analysis
- 1.2.2. Market Formulation & Data Visualization
- 1.2.3. Data Validation & Publishing
- 1.3. Research Assumptions
- 1.4. Information Procurement
- 1.4.1. Primary Research
- 1.5. Information or Data Analysis
- 1.6. Market Formulation & Validation
- 1.7. Market Model
- 1.8. Global Market: CAGR Calculation
- 1.9. Objective
- 1.9.1. Objective 1
- 1.9.2. Objective2
Chapter 2. Executive Summary
- 2.1. Market Snapshot
- 2.2. Segment Snapshot
- 2.3. Competitive Landscape Snapshot
Chapter 3. Market Variables, Trends, & Scope
- 3.1. Market Lineage Outlook
- 3.1.1. Parent Market Outlook
- 3.1.2. Related/Ancillary Market Outlook
- 3.2. Market Dynamics
- 3.2.1. Market Driver Analysis
- 3.2.1.1. Advantages offered by lab automation
- 3.2.1.2. Increasing demand for miniaturization
- 3.2.1.3. Rising applications of lab automation
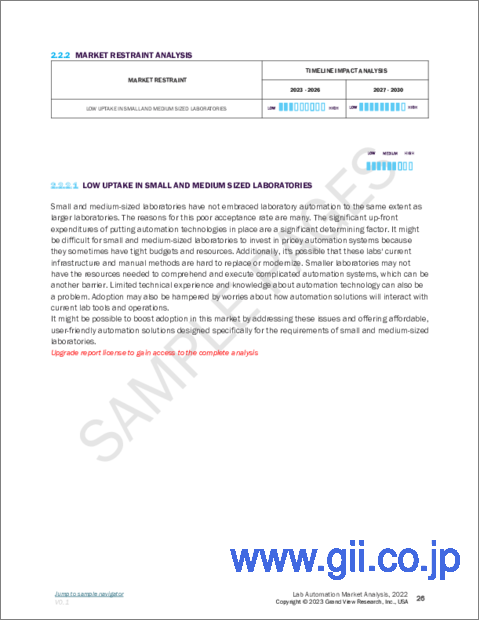
- 3.2.2. Market Restraint Analysis
- 3.2.2.1. Low uptake in small and medium-sized laboratories
- 3.2.1. Market Driver Analysis
- 3.3. Industry Analysis Tools
- 3.3.1. Porter's Five Forces Analysis
- 3.3.2. PESTEL Analysis
- 3.3.3. COVID-19 Impact Analysis
Chapter 4. Process Business Analysis
- 4.1. Lab Automation Market: Process Movement Analysis
- 4.2. Continuous Flow
- 4.2.1. Continuous Flow Market, 2018 - 2030 (USD Million)
- 4.2.2. By Workflow
- 4.2.2.1. Workflow Market, 2018 - 2030 (USD Million)
- 4.2.2.1.1. Sequential Processing
- 4.2.2.1.1.1. Sequential Processing Market, 2018 - 2030 (USD Million)
- 4.2.2.1.2. Parallel Processing
- 4.2.2.1.2.1. Parallel Processing Market, 2018 - 2030 (USD Million)
- 4.2.3. By Components
- 4.2.3.1. Components Market, 2018 - 2030 (USD Million)
- 4.2.3.1.1. Consumables
- 4.2.3.1.1.1. Consumables Market, 2018 - 2030 (USD Million)
- 4.2.3.1.2. Equipment
- 4.2.3.1.2.1. Equipment Market, 2018 - 2030 (USD Million)
- 4.3. Discrete Processing
- 4.3.1. Discrete Processing Market, 2018 - 2030 (USD Million)
- 4.3.2. By Method
- 4.3.2.1. Method Market, 2018 - 2030 (USD Million)
- 4.3.2.1.1. Centrifugal Discrete Processing
- 4.3.2.1.1.1. Centrifugal Discrete Processing Market, 2018 - 2030 (USD Million)
- 4.3.2.1.2. Random Access Discrete Processing
- 4.3.2.1.2.1. Random Access Discrete Processing Market, 2018 - 2030 (USD Million)
- 4.3.3. By Components
- 4.3.3.1. Components Market, 2018 - 2030 (USD Million)
- 4.3.3.1.1. Consumables
- 4.3.3.1.1.1. Consumables Market, 2018 - 2030 (USD Million)
- 4.3.3.1.2. Equipment
- 4.3.3.1.2.1. Equipment Market, 2018 - 2030 (USD Million)
- 4.3.4. By Workflow
- 4.3.4.1. Workflow Market, 2018 - 2030 (USD Million)
- 4.3.4.1.1. Dependent Analysis
- 4.3.4.1.1.1. Dependent Analysis Market, 2018 - 2030 (USD Million)
- 4.3.4.1.2. Independent Analysis
- 4.3.4.1.2.1. Independent Analysis Market, 2018 - 2030 (USD Million)
Chapter 5. Automation Type Business Analysis
- 5.1. Lab Automation Market: Automation Type Movement Analysis
- 5.2. Total Automation
- 5.2.1. Total Automation Market, 2018 - 2030 (USD Million)
- 5.2.2. By Steps
- 5.2.2.1. Steps Market, 2018 - 2030 (USD Million)
- 5.2.2.1.1. Pre-analysis
- 5.2.2.1.1.1. Pre-analysis Market, 2018 - 2030 (USD Million)
- 5.2.2.1.1.1.1. Centrifugation
- 5.2.2.1.1.1.1.1. Centrifugation Market, 2018 - 2030 (USD Million)
- 5.2.2.1.1.1.2. Sample Preparation
- 5.2.2.1.1.1.2.1. Sample Preparation Market, 2018 - 2030 (USD Million)
- 5.2.2.1.1.1.3. Sample Sorting
- 5.2.2.1.1.1.3.1. Sample Sorting Market, 2018 - 2030 (USD Million)
- 5.2.2.1.2. Transport Mechanisms
- 5.2.2.1.2.1. Transport Mechanisms Market, 2018 - 2030 (USD Million)
- 5.2.2.1.3. Liquid Handling
- 5.2.2.1.3.1. Liquid Handling Market, 2018 - 2030 (USD Million)
- 5.2.2.1.4. Sample Storage
- 5.2.2.1.4.1. Sample Storage Market, 2018 - 2030 (USD Million)
- 5.2.2.1.5. Sample Analysis
- 5.2.2.1.5.1. Sample Analysis Market, 2018 - 2030 (USD Million)
- 5.3. Modular Automation System
- 5.3.1. Modular Automation System Market, 2018 - 2030 (USD Million)
- 5.3.2. By Steps
- 5.3.2.1. Steps Market, 2018 - 2030 (USD Million)
- 5.3.2.1.1. Specimen Acquisition & Identification & Labelling
- 5.3.2.1.1.1. Specimen Acquisition & Identification & Labelling Market, 2018 - 2030 (USD Million)
- 5.3.2.1.2. Transport Mechanisms
- 5.3.2.1.2.1. Transport Mechanisms Market, 2018 - 2030 (USD Million)
- 5.3.2.1.3. Sample Preparation
- 5.3.2.1.3.1. Sample Preparation Market, 2018 - 2030 (USD Million)
- 5.3.2.1.4. Sample Loading & Aspiration
- 5.3.2.1.4.1. Sample Loading & Aspiration Market, 2018 - 2030 (USD Million)
- 5.3.2.1.5. Reagent Handling & Storage
- 5.3.2.1.5.1. Reagent Handling & Storage Market, 2018 - 2030 (USD Million)
- 5.3.2.1.6. Sample Analysis & Measurements
- 5.3.2.1.6.1. Sample Analysis & Measurements Market, 2018 - 2030 (USD Million)
Chapter 6. End-use Business Analysis
- 6.1. Lab Automation Market: End-use Movement Analysis
- 6.2. Clinical Chemistry Analysis
- 6.2.1. Clinical Chemistry Analysis Market, 2018 - 2030 (USD Million)
- 6.3. Photometry & Fluorometry
- 6.3.1. Photometry & Fluorometry Market, 2018 - 2030 (USD Million)
- 6.4. Immunoassay Analysis
- 6.4.1. Immunoassay Analysis Market, 2018 - 2030 (USD Million)
- 6.5. Electrolyte Analysis
- 6.5.1. Electrolyte Analysis Market, 2018 - 2030 (USD Million)
- 6.6. Other End-uses
- 6.6.1. Other End-uses Market, 2018 - 2030 (USD Million)
Chapter 7. Regional Business Analysis
- 7.1. Lab Automation Market Share, By Region, 2022 & 2030
- 7.2. North America
- 7.2.1. SWOT Analysis
- 7.2.2. North America Lab Automation Market, 2018 - 2030 (USD Million)
- 7.2.3. U.S.
- 7.2.3.1. Key Country Dynamics
- 7.2.3.2. Competitive Scenario
- 7.2.3.3. U.S. Lab Automation Market, 2018 - 2030 (USD Million)
- 7.2.4. Canada
- 7.2.4.1. Key Country Dynamics
- 7.2.4.2. Competitive Scenario
- 7.2.4.3. Canada Lab Automation Market, 2018 - 2030 (USD Million)
- 7.3. Europe
- 7.3.1. SWOT Analysis
- 7.3.2. Europe Lab Automation Market, 2018 - 2030 (USD Million)
- 7.3.3. UK
- 7.3.3.1. Key Country Dynamics
- 7.3.3.2. Competitive Scenario
- 7.3.3.3. UK Lab Automation Market, 2018 - 2030 (USD Million)
- 7.3.4. Germany
- 7.3.4.1. Key Country Dynamics
- 7.3.4.2. Competitive Scenario
- 7.3.4.3. Germany Lab Automation Market, 2018 - 2030 (USD Million)
- 7.3.5. France
- 7.3.5.1. Key Country Dynamics
- 7.3.5.2. Competitive Scenario
- 7.3.5.3. France Lab Automation Market, 2018 - 2030 (USD Million)
- 7.3.6. Italy
- 7.3.6.1. Key Country Dynamics
- 7.3.6.2. Competitive Scenario
- 7.3.6.3. Italy Lab Automation Market, 2018 - 2030 (USD Million)
- 7.3.7. Spain
- 7.3.7.1. Key Country Dynamics
- 7.3.7.2. Competitive Scenario
- 7.3.7.3. Spain Lab Automation Market, 2018 - 2030 (USD Million)
- 7.3.8. Denmark
- 7.3.8.1. Key Country Dynamics
- 7.3.8.2. Competitive Scenario
- 7.3.8.3. Denmark Lab Automation Market, 2018 - 2030 (USD Million)
- 7.3.9. Sweden
- 7.3.9.1. Key Country Dynamics
- 7.3.9.2. Competitive Scenario
- 7.3.9.3. Sweden Lab Automation Market, 2018 - 2030 (USD Million)
- 7.3.10. Norway
- 7.3.10.1. Key Country Dynamics
- 7.3.10.2. Competitive Scenario
- 7.3.10.3. Norway Lab Automation Market, 2018 - 2030 (USD Million)
- 7.4. Asia Pacific
- 7.4.1. SWOT Analysis
- 7.4.2. Asia Pacific Lab Automation Market, 2018 - 2030 (USD Million)
- 7.4.3. Japan
- 7.4.3.1. Key Country Dynamics
- 7.4.3.2. Competitive Scenario
- 7.4.3.3. Japan Lab Automation Market, 2018 - 2030 (USD Million)
- 7.4.4. China
- 7.4.4.1. Key Country Dynamics
- 7.4.4.2. Competitive Scenario
- 7.4.4.3. China Lab Automation Market, 2018 - 2030 (USD Million)
- 7.4.5. India
- 7.4.5.1. Key Country Dynamics
- 7.4.5.2. Competitive Scenario
- 7.4.5.3. India Lab Automation Market, 2018 - 2030 (USD Million)
- 7.4.6. Australia
- 7.4.6.1. Key Country Dynamics
- 7.4.6.2. Competitive Scenario
- 7.4.6.3. Australia Lab Automation Market, 2018 - 2030 (USD Million)
- 7.4.7. Thailand
- 7.4.7.1. Key Country Dynamics
- 7.4.7.2. Competitive Scenario
- 7.4.7.3. Thailand Lab Automation Market, 2018 - 2030 (USD Million)
- 7.4.8. South Korea
- 7.4.8.1. Key Country Dynamics
- 7.4.8.2. Competitive Scenario
- 7.4.8.3. South Korea Lab Automation Market, 2018 - 2030 (USD Million)
- 7.5. Latin America
- 7.5.1. SWOT Analysis
- 7.5.2. Latin America Lab Automation Market, 2018 - 2030 (USD Million)
- 7.5.3. Brazil
- 7.5.3.1. Key Country Dynamics
- 7.5.3.2. Competitive Scenario
- 7.5.3.3. Brazil Lab Automation Market, 2018 - 2030 (USD Million)
- 7.5.4. Mexico
- 7.5.4.1. Key Country Dynamics
- 7.5.4.2. Competitive Scenario
- 7.5.4.3. Mexico Lab Automation Market, 2018 - 2030 (USD Million)
- 7.5.5. Argentina
- 7.5.5.1. Key Country Dynamics
- 7.5.5.2. Competitive Scenario
- 7.5.5.3. Argentina Lab Automation Market, 2018 - 2030 (USD Million)
- 7.6. MEA
- 7.6.1. SWOT Analysis
- 7.6.2. MEA Lab Automation Market, 2018 - 2030 (USD Million)
- 7.6.3. South Africa
- 7.6.3.1. Key Country Dynamics
- 7.6.3.2. Competitive Scenario
- 7.6.3.3. South Africa Lab Automation Market, 2018 - 2030 (USD Million)
- 7.6.4. Saudi Arabia
- 7.6.4.1. Key Country Dynamics
- 7.6.4.2. Competitive Scenario
- 7.6.4.3. Saudi Arabia Lab Automation Market, 2018 - 2030 (USD Million)
- 7.6.5. UAE
- 7.6.5.1. Key Country Dynamics
- 7.6.5.2. Competitive Scenario
- 7.6.5.3. UAE Lab Automation Market, 2018 - 2030 (USD Million)
- 7.6.6. Kuwait
- 7.6.6.1. Key Country Dynamics
- 7.6.6.2. Competitive Scenario
- 7.6.6.3. Kuwait Lab Automation Market, 2018 - 2030 (USD Million)
Chapter 8. Competitive Landscape
- 8.1. Company Categorization
- 8.2. Strategy Mapping
- 8.3. Company Market Position Analysis, 2022
- 8.4. Company Profiles/Listing
- 8.4.1. QIAGEN
- 8.4.1.1. Overview
- 8.4.1.2. Financial Performance (Net Revenue/Sales/EBITDA/Gross Profit)
- 8.4.1.3. Product Benchmarking
- 8.4.1.4. Strategic Initiatives
- 8.4.2. PerkinElmer Inc.
- 8.4.2.1. Overview
- 8.4.2.2. Financial Performance (Net Revenue/Sales/EBITDA/Gross Profit)
- 8.4.2.3. Product Benchmarking
- 8.4.2.4. Strategic Initiatives
- 8.4.3. Thermo Fisher Scientific, Inc.
- 8.4.3.1. Overview
- 8.4.3.2. Financial Performance (Net Revenue/Sales/EBITDA/Gross Profit)
- 8.4.3.3. Product Benchmarking
- 8.4.3.4. Strategic Initiatives
- 8.4.4. Siemens Healthcare GmbH
- 8.4.4.1. Overview
- 8.4.4.2. Financial Performance (Net Revenue/Sales/EBITDA/Gross Profit)
- 8.4.4.3. Product Benchmarking
- 8.4.4.4. Strategic Initiatives
- 8.4.5. Danaher
- 8.4.5.1. Overview
- 8.4.5.2. Financial Performance (Net Revenue/Sales/EBITDA/Gross Profit)
- 8.4.5.3. Product Benchmarking
- 8.4.5.4. Strategic Initiatives
- 8.4.6. Agilent Technologies, Inc.
- 8.4.6.1. Overview
- 8.4.6.2. Financial Performance (Net Revenue/Sales/EBITDA/Gross Profit)
- 8.4.6.3. Product Benchmarking
- 8.4.6.4. Strategic Initiatives
- 8.4.7. Eppendorf SE
- 8.4.7.1. Overview
- 8.4.7.2. Financial Performance (Net Revenue/Sales/EBITDA/Gross Profit)
- 8.4.7.3. Product Benchmarking
- 8.4.7.4. Strategic Initiatives
- 8.4.8. Hudson Robotics
- 8.4.8.1. Overview
- 8.4.8.2. Financial Performance (Net Revenue/Sales/EBITDA/Gross Profit)
- 8.4.8.3. Product Benchmarking
- 8.4.8.4. Strategic Initiatives
- 8.4.9. Aurora Biomed Inc.
- 8.4.9.1. Overview
- 8.4.9.2. Financial Performance (Net Revenue/Sales/EBITDA/Gross Profit)
- 8.4.9.3. Product Benchmarking
- 8.4.9.4. Strategic Initiatives
- 8.4.10. BMG LABTECH GmbH
- 8.4.10.1. Overview
- 8.4.10.2. Financial Performance (Net Revenue/Sales/EBITDA/Gross Profit)
- 8.4.10.3. Product Benchmarking
- 8.4.10.4. Strategic Initiatives
- 8.4.11. F. Hoffmann-La Roche Ltd
- 8.4.11.1. Overview
- 8.4.11.2. Financial Performance (Net Revenue/Sales/EBITDA/Gross Profit)
- 8.4.11.3. Product Benchmarking
- 8.4.11.4. Strategic Initiatives
- 8.4.1. QIAGEN