|
|
市場調査レポート
商品コード
1092595
液浸冷却市場の規模、シェア、動向分析レポート:製品別、用途別、冷却液別、地域別、セグメント別予測、2022年~2030年Immersion Cooling Market Size, Share & Trends Analysis Report By Product (Single-phase, Two-phase), By Application (Edge Computing, Artificial Intelligence), By Cooling Liquid, By Region, And Segment Forecasts, 2022 - 2030 |
||||||
|
|
|||||||
|
● お客様のご希望に応じて、既存データの加工や未掲載情報(例:国別セグメント)の追加などの対応が可能です。 詳細はお問い合わせください。 |
|||||||


| 液浸冷却市場の規模、シェア、動向分析レポート:製品別、用途別、冷却液別、地域別、セグメント別予測、2022年~2030年 |
|
出版日: 2022年05月13日
発行: Grand View Research
ページ情報: 英文 110 Pages
納期: 2~10営業日
|
- 全表示
- 概要
- 図表
- 目次
世界の液浸冷却の市場規模は、2022年~2030年にかけて22.6%のCAGRで拡大し、2030年までに10億1,000万米ドルに達すると予測されています。
この成長の主な要因は、データセンターインフラの需要増と、他の冷却システムによる電力消費量の増加です。
当レポートでは、世界の液浸冷却市場について調査し、市場の現状とともに、製品別、用途別、冷却液別、地域別動向、および市場に参入する企業のプロファイルなどを提供しています。
目次
第1章 調査手法と範囲
第2章 エグゼクティブサマリー
第3章 液浸冷却市場の変数、動向、および範囲
- 市場セグメンテーションと範囲
- 浸透と成長見通しマッピング
- 業界のバリューチェーン分析
- 規制の枠組み
- 液浸冷却市場-市場力学
- ビジネス環境分析:液浸冷却市場
- COVID-19影響分析
第4章 液浸冷却市場:製品別推定と動向分析
- 液浸冷却市場:製品別動向分析、2021年および2030年
- 単相
- 二相
第5章 液浸冷却市場:用途別推定と動向分析
- 液浸冷却市場:用途別動向分析、2021年および2030年
- ハイパフォーマンスコンピューティング
- エッジコンピューティング
- 暗号通貨マイニング
- 人工知能
- その他
第6章 液浸冷却市場:冷却液別推定と動向分析
- 液浸冷却市場:冷却液別動向分析、2021年および2030年
- 鉱油
- フルオロカーボンベースの液体
- 脱イオン水
- その他
第7章 液浸冷却市場:地域別推定と動向分析
- 地域別動向分析と市場シェア、2021年および2030年
- 北米
- 欧州
- アジア太平洋
- 中南米
- 中東・アフリカ
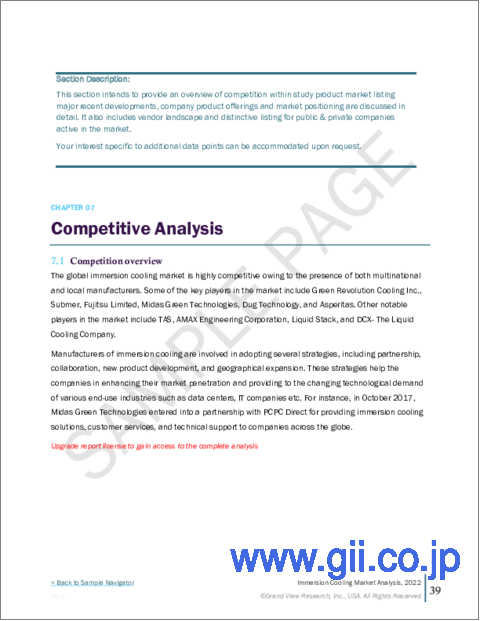
第8章 液浸冷却市場:競争力分析
第9章 企業プロファイル
- Green Revolution Cooling Inc.
- Submer
- Fujitsu
- Liquid Stack
- Midas Green Technologies
- Asperitas
- DCX The Liquid Cooling Company
- LiquidCool Solutions
- DUG Technology
- ExaScaler Inc.
- Iceotope Technologies Ltd.
- TAS
- AMAX
List of Tables
- Table 1 Single-phase immersion cooling market estimates and forecasts, 2017 - 2030 (USD Million)
- Table 2 Two-phase immersion cooling market estimates and forecasts, 2017 - 2030 (USD Million)
- Table 3 Immersion cooling market estimates and forecasts, in high performance computing, 2017 - 2030 (USD Million)
- Table 4 Immersion cooling market estimates and forecasts, in edge computing, 2017 - 2030 (USD Million)
- Table 5 Immersion cooling market estimates and forecasts, in cryptocurrency mining, 2017 - 2030 (USD Million)
- Table 6 Immersion cooling market estimates and forecasts, in artificial intelligence, 2017 - 2030 (USD Million)
- Table 7 Immersion cooling market estimates and forecasts, in others, 2017 - 2030 (USD Million)
- Table 8 Immersion cooling market estimates and forecasts, by mineral oil, 2017 - 2030 (USD Million)
- Table 9 Immersion cooling market estimates and forecasts, by fluorocarbon-based fluids, 2017 - 2030 (USD Million)
- Table 10 Immersion cooling market estimates and forecasts, by deionized water, 2017 - 2030 (USD Million)
- Table 11 Immersion cooling market estimates and forecasts, by others, 2017 - 2030 (USD Million)
- Table 12 North America immersion cooling market estimates and forecasts, 2017 - 2030 (USD Million)
- Table 13 North America immersion cooling market estimates and forecasts, by product, 2017 - 2030 (USD Million)
- Table 14 North America immersion cooling market estimates and forecasts, by application, 2017 - 2030 (USD Million)
- Table 15 North America immersion cooling market estimates and forecasts, by cooling liquid, 2017 - 2030 (USD Million)
- Table 16 U.S. immersion cooling market estimates and forecasts, 2017 - 2030 (USD Million)
- Table 17 U.S. immersion cooling market estimates and forecasts, by product, 2017 - 2030 (USD Million)
- Table 18 U.S. immersion cooling market estimates and forecasts, by application, 2017 - 2030 (USD Million)
- Table 19 U.S. immersion cooling market estimates and forecasts, by cooling liquid, 2017 - 2030 (USD Million)
- Table 20 Canada immersion cooling market estimates and forecasts, 2017 - 2030 (USD Million)
- Table 21 Canada immersion cooling market estimates and forecasts, by product, 2017 - 2030 (USD Million)
- Table 22 Canada immersion cooling market estimates and forecasts, by application, 2017 - 2030 (USD Million)
- Table 23 Canada immersion cooling market estimates and forecasts, by cooling liquid, 2017 - 2030 (USD Million)
- Table 24 Europe immersion cooling market estimates and forecasts, 2017 - 2030 (USD Million)
- Table 25 Europe immersion cooling market estimates and forecasts, by product, 2017 - 2030 (USD Million)
- Table 26 Europe immersion cooling market estimates and forecasts, by application, 2017 - 2030 (USD Million)
- Table 27 Europe immersion cooling market estimates and forecasts, by cooling liquid, 2017 - 2030 (USD Million)
- Table 28 Italy immersion cooling market estimates and forecasts, 2017 - 2030 (USD Million)
- Table 29 Italy immersion cooling market estimates and forecasts, by product, 2017 - 2030 (USD Million)
- Table 30 Italy immersion cooling market estimates and forecasts, by application, 2017 - 2030 (USD Million)
- Table 31 Italy immersion cooling market estimates and forecasts, by cooling liquid, 2017 - 2030 (USD Million)
- Table 32 Germany immersion cooling market estimates and forecasts, 2017 - 2030 (USD Million)
- Table 33 Germany immersion cooling market estimates and forecasts, by product, 2017 - 2030 (USD Million)
- Table 34 Germany immersion cooling market estimates and forecasts, by application, 2017 - 2030 (USD Million)
- Table 35 Germany immersion cooling market estimates and forecasts, by cooling liquid, 2017 - 2030 (USD Million)
- Table 36 France immersion cooling market estimates and forecasts, 2017 - 2030 (USD Million)
- Table 37 France immersion cooling market estimates and forecasts, by product, 2017 - 2030 (USD Million)
- Table 38 France immersion cooling market estimates and forecasts, by application, 2017 - 2030 (USD Million)
- Table 39 France immersion cooling market estimates and forecasts, by cooling liquid, 2017 - 2030 (USD Million)
- Table 40 Netherlands immersion cooling market estimates and forecasts, 2017 - 2030 (USD Million)
- Table 41 Netherlands immersion cooling market estimates and forecasts, by product, 2017 - 2030 (USD Million)
- Table 42 Netherlands immersion cooling market estimates and forecasts, by application, 2017 - 2030 (USD Million)
- Table 43 Netherlands immersion cooling market estimates and forecasts, by cooling liquid, 2017 - 2030 (USD Million)
- Table 44 Russia immersion cooling market estimates and forecasts, 2017 - 2030 (USD Million)
- Table 45 Russia immersion cooling market estimates and forecasts, by product, 2017 - 2030 (USD Million)
- Table 46 Russia immersion cooling market estimates and forecasts, by application, 2017 - 2030 (USD Million)
- Table 47 Russia immersion cooling market estimates and forecasts, by cooling liquid, 2017 - 2030 (USD Million)
- Table 48 U.K. immersion cooling market estimates and forecasts, 2017 - 2030 (USD Million)
- Table 49 U.K. immersion cooling market estimates and forecasts, by product, 2017 - 2030 (USD Million)
- Table 50 U.K. immersion cooling market estimates and forecasts, by application, 2017 - 2030 (USD Million)
- Table 51 U.K. immersion cooling market estimates and forecasts, by cooling liquid, 2017 - 2030 (USD Million)
- Table 52 Asia Pacific immersion cooling market estimates and forecasts, 2017 - 2030 (USD Million)
- Table 53 Asia Pacific immersion cooling market estimates and forecasts, by product, 2017 - 2030 (USD Million)
- Table 54 Asia Pacific immersion cooling market estimates and forecasts, by application, 2017 - 2030 (USD Million)
- Table 55 Asia Pacific immersion cooling market estimates and forecasts, by cooling liquid, 2017 - 2030 (USD Million)
- Table 56 China immersion cooling market estimates and forecasts, 2017 - 2030 (USD Million)
- Table 57 China immersion cooling market estimates and forecasts, by product, 2017 - 2030 (USD Million)
- Table 58 China immersion cooling market estimates and forecasts, by application, 2017 - 2030 (USD Million)
- Table 59 China immersion cooling market estimates and forecasts, by cooling liquid, 2017 - 2030 (USD Million)
- Table 60 India immersion cooling market estimates and forecasts, 2017 - 2030 (USD Million)
- Table 61 India immersion cooling market estimates and forecasts, by product, 2017 - 2030 (USD Million)
- Table 62 India immersion cooling market estimates and forecasts, by application, 2017 - 2030 (USD Million)
- Table 63 India immersion cooling market estimates and forecasts, by cooling liquid, 2017 - 2030 (USD Million)
- Table 64 Japan immersion cooling market estimates and forecasts, 2017 - 2030 (USD Million)
- Table 65 Japan immersion cooling market estimates and forecasts, by product, 2017 - 2030 (USD Million)
- Table 66 Japan immersion cooling market estimates and forecasts, by application, 2017 - 2030 (USD Million)
- Table 67 Japan immersion cooling market estimates and forecasts, by cooling liquid, 2017 - 2030 (USD Million)
- Table 68 Australia immersion cooling market estimates and forecasts, 2017 - 2030 (USD Million)
- Table 69 Australia immersion cooling market estimates and forecasts, by product, 2017 - 2030 (USD Million)
- Table 70 Australia immersion cooling market estimates and forecasts, by application, 2017 - 2030 (USD Million)
- Table 71 Australia immersion cooling market estimates and forecasts, by cooling liquid, 2017 - 2030 (USD Million)
- Table 72 Central & South America immersion cooling market estimates and forecasts, 2017 - 2030 (USD Million)
- Table 73 Central & South America immersion cooling market estimates and forecasts, by product, 2017 - 2030 (USD Million)
- Table 74 Central & South America immersion cooling market estimates and forecasts, by application, 2017 - 2030 (USD Million)
- Table 75 Central & South America immersion cooling market estimates and forecasts, by cooling liquid, 2017 - 2030 (USD Million)
- Table 76 Brazil immersion cooling market estimates and forecasts, 2017 - 2030 (USD Million)
- Table 77 Brazil immersion cooling market estimates and forecasts, by product, 2017 - 2030 (USD Million)
- Table 78 Brazil immersion cooling market estimates and forecasts, by application, 2017 - 2030 (USD Million)
- Table 79 Brazil immersion cooling market estimates and forecasts, by cooling liquid, 2017 - 2030 (USD Million)
- Table 80 Argentina immersion cooling market estimates and forecasts, 2017 - 2030 (USD Million)
- Table 81 Argentina immersion cooling market estimates and forecasts, by product, 2017 - 2030 (USD Million)
- Table 82 Argentina immersion cooling market estimates and forecasts, by application, 2017 - 2030 (USD Million)
- Table 83 Argentina immersion cooling market estimates and forecasts, by cooling liquid, 2017 - 2030 (USD Million)
- Table 84 Middle East & Africa immersion cooling market estimates and forecasts, 2017 - 2030 (USD Million)
- Table 85 Middle East & Africa immersion cooling market estimates and forecasts, by product, 2017 - 2030 (USD Million)
- Table 86 Middle East & Africa immersion cooling market estimates and forecasts, by application, 2017 - 2030 (USD Million)
- Table 87 Middle East & Africa immersion cooling market estimates and forecasts, by application, 2017 - 2030 (USD Million)
- Table 88 South Africa immersion cooling market estimates and forecasts, 2017 - 2030 (USD Million)
- Table 89 South Africa immersion cooling market estimates and forecasts, by product, 2017 - 2030 (USD Million)
- Table 90 South Africa immersion cooling market estimates and forecasts, by application, 2017 - 2030 (USD Million)
- Table 91 South Africa immersion cooling market estimates and forecasts, by application, 2017 - 2030 (USD Million)
- Table 92 Saudi Arabia immersion cooling market estimates and forecasts, 2017 - 2030 (USD Million)
- Table 93 Saudi Arabia immersion cooling market estimates and forecasts, by product, 2017 - 2030 (USD Million)
- Table 94 Saudi Arabia immersion cooling market estimates and forecasts, by application, 2017 - 2030 (USD Million)
- Table 95 Saudi Arabia immersion cooling market estimates and forecasts, by cooling liquid, 2017 - 2030 (USD Million)
List of Figures
- Fig. 1 Information Procurement
- Fig. 2 Primary Research Pattern
- Fig. 3 Primary Research Process
- Fig. 4 Market Research Approaches - Bottom-up Approach
- Fig. 5 Market Research Approaches - Top-down Approach
- Fig. 6 Market Research Approaches - Combined Approach
- Fig. 7 Market Outlook
- Fig. 8 Segment Outlook
- Fig. 9 Competitive Insights
- Fig. 10 Penetration & Growth Prospect Mapping
- Fig. 11 Industry Value Chain Analysis
- Fig. 12 Market Driver Analysis
- Fig. 13 Number of internet users, 2010 to 2019 (Billions)
- Fig. 14 Datacenter workloads, 2010 & 2015 to 2019 (Index 2010 = 1)
- Fig. 15 Market Restraint Analysis
- Fig. 16 Immersion Cooling Costs
- Fig. 17 Immersion Cooling Market: Product Movement Analysis, 2021 & 2030
- Fig. 18 Immersion Cooling Market: Application Movement Analysis, 2021 & 2030
- Fig. 19 Immersion Cooling Market: Cooling Liquid Movement Analysis, 2021 & 2030
- Fig. 20 Immersion Cooling Market: Regional Movement Analysis, 2021 & 2030
- Fig. 21 Company Dashboard Analysis
Immersion Cooling Market Growth & Trends:
The global immersion cooling market size is anticipated to reach USD 1.01 billion by 2030, according to a new report by Grand View Research, Inc. The market is expected to register a CAGR of 22.6% from 2022 to 2030. The growth is primarily driven by the rising demand for data center infrastructure as well as the increased power consumption by other cooling systems.
The cooling infrastructure in data center buildings consumes over half of the total energy. The need for data infrastructure is rapidly increasing, causing servers to store more data and approach their heat rejection levels faster. These systems are being used in data centers to cut energy usage and overhead expenses.
By removing active cooling components such as fans and heat sinks, immersion cooling enables a significantly higher density of processing capabilities. Smaller data centers can provide the same performance as larger data centers and can be easily fitted into metropolitan areas with limited space.
Due to the COVID-19 pandemic, the demand for web-enabled services has increased tremendously as people across the globe stayed at home. For instance, Netflix gained 15.77 million new paid subscribers worldwide, from February to March 2020; above its projected 7 million which has created demand.
To reduce the environmental impact, data centers are focused on immersion cooling methods. Microsoft, for example, began burying its servers in liquid in April 2021 to increase energy efficiency and performance. This system saves money because no energy is required to transport the liquid around the tank, and no chiller is required for the condenser.
Immersion Cooling Market Report Highlights:
- Artificial intelligence is expected to grow at a CAGR of 26.3% from 2022 to 2030. Development and mass deployment of deep learning by Facebook, Microsoft, Google Amazon, and others are expected to boost market demand
- The demand for fluorocarbon-based fluids is anticipated to witness growth at a CAGR of 24.4%, owing to its high chemical & thermal stability, high dielectric strength, and relatively high vapor pressure aid the easy adoption for maintaining temperatures of equipment
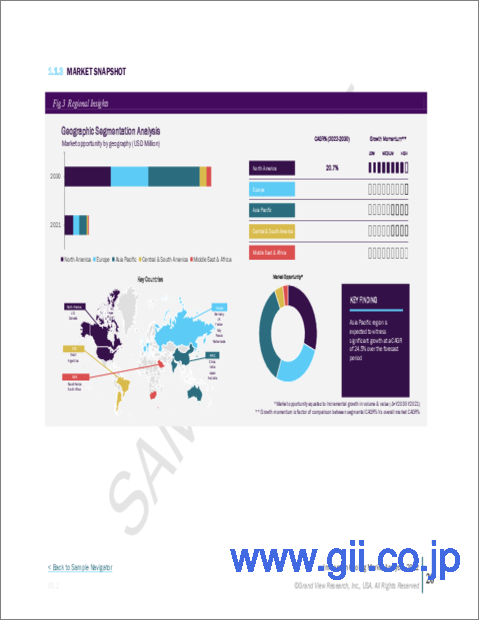
- North America accounted for 35.9% of the global revenue share in 2021 owing to the presence of large-scale data centers, 5G network adoption, intelligent building, and building automation vendors in the region
- In January 2022, Intel has collaborated with Green Revolution Cooling (GRC) to develop and execute improved systems for future data centers in collaboration with data center clients
- Companies that provide immersion cooling are working on growing their global business footprints. For example, Submer announced a relationship with SYNNEX Corporation in March 2021 to increase its presence in the U.S.
Table of Contents
Chapter 1. Methodology and Scope
- 1.1. Research Methodology
- 1.2. Research Scope and Assumptions
- 1.3. Information Procurement
- 1.3.1. Purchased Database
- 1.3.2. GVR's Internal Database
- 1.3.3. Secondary Sources & Third-Party Perspectives
- 1.3.4. Primary Research
- 1.4. Information Analysis
- 1.4.1. Data Analysis Models
- 1.5. Market Formulation & Data Visualization
- 1.6. Data Validation & Publishing
Chapter 2. Executive Summary
- 2.1. Market Outlook
- 2.2. Segmental Outlook
- 2.3. Competitive Insights
Chapter 3. Immersion Cooling Market Variables, Trends, & Scope
- 3.1. Market Segmentation & Scope
- 3.2. Penetration & Growth Prospect Mapping
- 3.3. Industry Value Chain Analysis
- 3.4. Regulatory Framework
- 3.5. Immersion Cooling Market - Market dynamics
- 3.5.1. Market Driver Analysis
- 3.5.2. Market Restraint Analysis
- 3.5.3. Industry Challenges
- 3.6. Business Environment Analysis: Immersion Cooling Market
- 3.6.1. Industry Analysis - Porter's
- 3.6.1.1. Supplier Power
- 3.6.1.2. Buyer Power
- 3.6.1.3. Substitution Threat
- 3.6.1.4. Threat from New Entrants
- 3.6.1.5. Competitive Rivalry
- 3.6.2. PESTEL Analysis
- 3.6.2.1. Political Landscape
- 3.6.2.2. Environmental Landscape
- 3.6.2.3. Social Landscape
- 3.6.2.4. Technology Landscape
- 3.6.2.5. Economic Landscape
- 3.6.2.6. Legal Landscape
- 3.6.1. Industry Analysis - Porter's
- 3.7. COVID-19 Impact Analysis
Chapter 4. Immersion Cooling Market: Product Estimates & Trend Analysis
- 4.1. Immersion Cooling Market: Product Movement Analysis, 2021 & 2030
- 4.2. Single-Phase
- 4.2.1. Market estimates and forecasts, 2017 - 2030 (USD Million)
- 4.3. Two-Phase
- 4.3.1. Market estimates and forecasts, 2017 - 2030 (USD Million)
Chapter 5. Immersion Cooling Market: Application Estimates & Trend Analysis
- 5.1. Immersion Cooling Market: Application Movement Analysis, 2021 & 2030
- 5.2. High Performance Computing
- 5.2.1. Market estimates and forecasts, 2017 - 2030 (USD Million)
- 5.3. Edge Computing
- 5.3.1. Market estimates and forecasts, 2017 - 2030 (USD Million)
- 5.4. Cryptocurrency Mining
- 5.4.1. Market estimates and forecasts, 2017 - 2030 (USD Million)
- 5.5. Artificial Intelligence
- 5.5.1. Market estimates and forecasts, 2017 - 2030 (USD Million)
- 5.6. Others
- 5.6.1. Market estimates and forecasts, 2017 - 2030 (USD Million)
Chapter 6. Immersion Cooling Market: Cooling Liquid Estimates & Trend Analysis
- 6.1. Immersion Cooling Market: Cooling Liquid Movement Analysis, 2021 & 2030
- 6.2. Mineral Oil
- 6.2.1. Market estimates and forecasts, 2017 - 2030 (USD Million)
- 6.3. Fluorocarbon-based Fluids
- 6.3.1. Market estimates and forecasts, 2017 - 2030 (USD Million)
- 6.4. Deionized Water
- 6.4.1. Market estimates and forecasts, 2017 - 2030 (USD Million)
- 6.5. Others
- 6.5.1. Market estimates and forecasts, 2017 - 2030 (USD Million)
Chapter 7. Immersion Cooling Market: Regional Estimates & Trend Analysis
- 7.1. Regional Movement Analysis & Market Share, 2021 & 2030
- 7.2. North America
- 7.2.1. Market estimates and forecasts, 2017 - 2030 (USD Million)
- 7.2.2. Market estimates and forecasts, by product, 2017 - 2030 (USD Million)
- 7.2.3. Market estimates and forecasts, by application, 2017 - 2030 (USD Million)
- 7.2.4. Market estimates and forecasts, by cooling liquid, 2017 - 2030 (USD Million)
- 7.2.5. U.S.
- 7.2.5.1. Market estimates and forecasts, 2017 - 2030 (USD Million)
- 7.2.5.2. Market estimates and forecasts, by product, 2017 - 2030 (USD Million)
- 7.2.5.3. Market estimates and forecasts, by application, 2017 - 2030 (USD Million)
- 7.2.5.4. Market estimates and forecasts, by cooling liquid, 2017 - 2030 (USD Million)
- 7.2.6. Canada
- 7.2.6.1. Market estimates and forecasts, 2017 - 2030 (USD Million)
- 7.2.6.2. Market estimates and forecasts, by product, 2017 - 2030 (USD Million)
- 7.2.6.3. Market estimates and forecasts, by application, 2017 - 2030 (USD Million)
- 7.2.6.4. Market estimates and forecasts, by cooling liquid, 2017 - 2030 (USD Million)
- 7.3. Europe
- 7.3.1. Market estimates and forecasts, 2017 - 2030 (USD Million)
- 7.3.2. Market estimates and forecasts, by product, 2017 - 2030 (USD Million)
- 7.3.3. Market estimates and forecasts, by application, 2017 - 2030 (USD Million)
- 7.3.4. Market estimates and forecasts, by cooling liquid, 2017 - 2030 (USD Million)
- 7.3.5. Italy
- 7.3.5.1. Market estimates and forecasts, 2017 - 2030 (USD Million)
- 7.3.5.2. Market estimates and forecasts, by product, 2017 - 2030 (USD Million)
- 7.3.5.3. Market estimates and forecasts, by application, 2017 - 2030 (USD Million)
- 7.3.5.4. Market estimates and forecasts, by cooling liquid, 2017 - 2030 (USD Million)
- 7.3.6. Germany
- 7.3.6.1. Market estimates and forecasts, 2017 - 2030 (USD Million)
- 7.3.6.2. Market estimates and forecasts, by product, 2017 - 2030 (USD Million)
- 7.3.6.3. Market estimates and forecasts, by application, 2017 - 2030 (USD Million)
- 7.3.6.4. Market estimates and forecasts, by cooling liquid, 2017 - 2030 (USD Million)
- 7.3.7. France
- 7.3.7.1. Market estimates and forecasts, 2017 - 2030 (USD Million)
- 7.3.7.2. Market estimates and forecasts, by product, 2017 - 2030 (USD Million)
- 7.3.7.3. Market estimates and forecasts, by application, 2017 - 2030 (USD Million)
- 7.3.7.4. Market estimates and forecasts, by cooling liquid, 2017 - 2030 (USD Million)
- 7.3.8. Netherlands
- 7.3.8.1. Market estimates and forecasts, 2017 - 2030 (USD Million)
- 7.3.8.2. Market estimates and forecasts, by product, 2017 - 2030 (USD Million)
- 7.3.8.3. Market estimates and forecasts, by application, 2017 - 2030 (USD Million)
- 7.3.8.4. Market estimates and forecasts, by cooling liquid, 2017 - 2030 (USD Million)
- 7.3.9. Russia
- 7.3.9.1. Market estimates and forecasts, 2017 - 2030 (USD Million)
- 7.3.9.2. Market estimates and forecasts, by product, 2017 - 2030 (USD Million)
- 7.3.9.3. Market estimates and forecasts, by application, 2017 - 2030 (USD Million)
- 7.3.9.4. Market estimates and forecasts, by cooling liquid, 2017 - 2030 (USD Million)
- 7.3.10. U.K.
- 7.3.10.1. Market estimates and forecasts, 2017 - 2030 (USD Million)
- 7.3.10.2. Market estimates and forecasts, by product, 2017 - 2030 (USD Million)
- 7.3.10.3. Market estimates and forecasts, by application, 2017 - 2030 (USD Million)
- 7.3.10.4. Market estimates and forecasts, by cooling liquid, 2017 - 2030 (USD Million)
- 7.4. Asia Pacific
- 7.4.1. Market estimates and forecasts, 2017 - 2030 (USD Million)
- 7.4.2. Market estimates and forecasts, by product, 2017 - 2030 (USD Million)
- 7.4.3. Market estimates and forecasts, by application, 2017 - 2030 (USD Million)
- 7.4.4. Market estimates and forecasts, by cooling liquid, 2017 - 2030 (USD Million)
- 7.4.5. China
- 7.4.5.1. Market estimates and forecasts, 2017 - 2030 (USD Million)
- 7.4.5.2. Market estimates and forecasts, by product, 2017 - 2030 (USD Million)
- 7.4.5.3. Market estimates and forecasts, by application, 2017 - 2030 (USD Million)
- 7.4.5.4. Market estimates and forecasts, by cooling liquid, 2017 - 2030 (USD Million)
- 7.4.6. India
- 7.4.6.1. Market estimates and forecasts, 2017 - 2030 (USD Million)
- 7.4.6.2. Market estimates and forecasts, by product, 2017 - 2030 (USD Million)
- 7.4.6.3. Market estimates and forecasts, by application, 2017 - 2030 (USD Million)
- 7.4.6.4. Market estimates and forecasts, by cooling liquid, 2017 - 2030 (USD Million)
- 7.4.7. Japan
- 7.4.7.1. Market estimates and forecasts, 2017 - 2030 (USD Million)
- 7.4.7.2. Market estimates and forecasts, by product, 2017 - 2030 (USD Million)
- 7.4.7.3. Market estimates and forecasts, by application, 2017 - 2030 (USD Million)
- 7.4.7.4. Market estimates and forecasts, by cooling liquid, 2017 - 2030 (USD Million)
- 7.4.8. Australia
- 7.4.8.1. Market estimates and forecasts, 2017 - 2030 (USD Million)
- 7.4.8.2. Market estimates and forecasts, by product, 2017 - 2030 (USD Million)
- 7.4.8.3. Market estimates and forecasts, by application, 2017 - 2030 (USD Million)
- 7.4.8.4. Market estimates and forecasts, by cooling liquid, 2017 - 2030 (USD Million)
- 7.5. Central & South America
- 7.5.1. Market estimates and forecasts, 2017 - 2030 (USD Million)
- 7.5.2. Market estimates and forecasts, by product, 2017 - 2030 (USD Million)
- 7.5.3. Market estimates and forecasts, by application, 2017 - 2030 (USD Million)
- 7.5.4. Market estimates and forecasts, by cooling liquid, 2017 - 2030 (USD Million)
- 7.5.5. Brazil
- 7.5.5.1. Market estimates and forecasts, 2017 - 2030 (USD Million)
- 7.5.5.2. Market estimates and forecasts, by product, 2017 - 2030 (USD Million)
- 7.5.5.3. Market estimates and forecasts, by application, 2017 - 2030 (USD Million)
- 7.5.5.4. Market estimates and forecasts, by cooling liquid, 2017 - 2030 (USD Million)
- 7.5.6. Argentina
- 7.5.6.1. Market estimates and forecasts, 2017 - 2030 (USD Million)
- 7.5.6.2. Market estimates and forecasts, by product, 2017 - 2030 (USD Million)
- 7.5.6.3. Market estimates and forecasts, by application, 2017 - 2030 (USD Million)
- 7.5.6.4. Market estimates and forecasts, by cooling liquid, 2017 - 2030 (USD Million)
- 7.6. Middle East & Africa
- 7.6.1. Market estimates and forecasts, 2017 - 2030 (USD Million)
- 7.6.2. Market estimates and forecasts, by product, 2017 - 2030 (USD Million)
- 7.6.3. Market estimates and forecasts, by application, 2017 - 2030 (USD Million)
- 7.6.4. Market estimates and forecasts, by cooling liquid, 2017 - 2030 (USD Million)
- 7.6.5. Saudi Arabia
- 7.6.5.1. Market estimates and forecasts, 2017 - 2030 (USD Million)
- 7.6.5.2. Market estimates and forecasts, by product, 2017 - 2030 (USD Million)
- 7.6.5.3. Market estimates and forecasts, by application, 2017 - 2030 (USD Million)
- 7.6.5.4. Market estimates and forecasts, by cooling liquid, 2017 - 2030 (USD Million)
- 7.6.6. South Africa
- 7.6.6.1. Market estimates and forecasts, 2017 - 2030 (USD Million)
- 7.6.6.2. Market estimates and forecasts, by product, 2017 - 2030 (USD Million)
- 7.6.6.3. Market estimates and forecasts, by application, 2017 - 2030 (USD Million)
- 7.6.6.4. Market estimates and forecasts, by cooling liquid, 2017 - 2030 (USD Million)
Chapter 8. Immersion Cooling Market: Competitive Analysis
- 8.1. Key Players, Recent Developments & Their Impact on the Industry
- 8.2. Key Company/Competition Categorization
- 8.3. Vendor Landscape
- 8.4. Competitive Dashboard Analysis
- 8.5. Public Companies
- 8.5.1. Company Market Position Analysis
- 8.6. Private Companies
- 8.6.1. List of Key Emerging Companies and Their Geographical Presence
Chapter 9. Company Profiles
- 9.1. Green Revolution Cooling Inc.
- 9.1.1. Company Overview
- 9.1.2. Financial Performance
- 9.1.3. Product Benchmarking
- 9.1.4. Strategic Initiatives
- 9.2. Submer
- 9.2.1. Company Overview
- 9.2.2. Financial Performance
- 9.2.3. Product Benchmarking
- 9.2.4. Strategic Initiatives
- 9.3. Fujitsu
- 9.3.1. Company Overview
- 9.3.2. Financial Performance
- 9.3.3. Product Benchmarking
- 9.3.4. Strategic Initiatives
- 9.4. Liquid Stack
- 9.4.1. Company Overview
- 9.4.2. Financial Performance
- 9.4.3. Product Benchmarking
- 9.4.4. Strategic Initiatives
- 9.5. Midas Green Technologies
- 9.5.1. Company Overview
- 9.5.2. Financial Performance
- 9.5.3. Product Benchmarking
- 9.5.4. Strategic Initiatives
- 9.6. Asperitas
- 9.6.1. Company Overview
- 9.6.2. Financial Performance
- 9.6.3. Product Benchmarking
- 9.6.4. Strategic Initiatives
- 9.7. DCX The Liquid Cooling Company
- 9.7.1. Company Overview
- 9.7.2. Financial Performance
- 9.7.3. Product Benchmarking
- 9.7.4. Strategic Initiatives
- 9.8. LiquidCool Solutions
- 9.8.1. Company Overview
- 9.8.2. Financial Performance
- 9.8.3. Product Benchmarking
- 9.8.4. Strategic Initiatives
- 9.9. DUG Technology
- 9.9.1. Company Overview
- 9.9.2. Financial Performance
- 9.9.3. Product Benchmarking
- 9.9.4. Strategic Initiatives
- 9.10. ExaScaler Inc.
- 9.10.1. Company Overview
- 9.10.2. Financial Performance
- 9.10.3. Product Benchmarking
- 9.10.4. Strategic Initiatives
- 9.11. Iceotope Technologies Ltd.
- 9.11.1. Company Overview
- 9.11.2. Financial Performance
- 9.11.3. Product Benchmarking
- 9.11.4. Strategic Initiatives
- 9.12. TAS
- 9.12.1. Company Overview
- 9.12.2. Financial Performance
- 9.12.3. Product Benchmarking
- 9.12.4. Strategic Initiatives
- 9.13. AMAX
- 9.13.1. Company Overview
- 9.13.2. Financial Performance
- 9.13.3. Product Benchmarking
- 9.13.4. Strategic Initiatives