|
|
市場調査レポート
商品コード
1268895
使い捨て内視鏡の市場規模、シェア、動向分析レポート:タイプ別(腹腔鏡、関節鏡、尿管鏡、膀胱鏡、気管支鏡)、最終用途別、地域別、セグメント別予測、2023年~2030年Disposable Endoscopes Market Size, Share & Trends Analysis Report By Type (Laparoscopes, Arthroscopes, Ureteroscopes, Cystoscopes, Bronchoscopes), By End-use, By Region, And Segment Forecasts, 2023 - 2030 |
||||||
|
|
|||||||
|
● お客様のご希望に応じて、既存データの加工や未掲載情報(例:国別セグメント)の追加などの対応が可能です。 詳細はお問い合わせください。 |
|||||||


| 使い捨て内視鏡の市場規模、シェア、動向分析レポート:タイプ別(腹腔鏡、関節鏡、尿管鏡、膀胱鏡、気管支鏡)、最終用途別、地域別、セグメント別予測、2023年~2030年 |
|
出版日: 2023年04月27日
発行: Grand View Research
ページ情報: 英文 150 Pages
納期: 2~10営業日
|
- 全表示
- 概要
- 図表
- 目次
使い捨て内視鏡市場の成長と動向:
Grand View Research, Inc.の最新レポートによると、世界の使い捨て内視鏡の市場規模は2030年までに73億2,000万米ドルに達すると予測されています。
2023年から2030年までのCAGRは16.9%で拡大すると予想されています。診断のために内視鏡的処置を必要とする消化性潰瘍、泌尿器、胃腸、呼吸器、その他の疾患の発生率の著しい上昇が、使い捨て内視鏡市場を牽引する主要因となっています。さらに、いくつかの技術的進歩、ヘルスケア環境における使い捨て内視鏡と可視化システムの採用増加も、世界市場を支える要因となっています。
さらに、再利用可能な内視鏡は、時間の経過とともに漏出や汚染のリスクがあり、その結果、交差汚染のリスクが低いことから、使い捨てデバイスの需要を促進しています。また、使い捨て内視鏡は、再利用可能な製品に比べ、費用対効果が高いです。例えば、Single Use Endoscopyによると、再利用可能な内視鏡による処置は約1400~1900米ドルかかるのに対し、使い捨て内視鏡による処置は約400米ドル~1700米ドルかかるとされています。このように、シングルユース内視鏡にはいくつかの利点があり、予測期間中の普及を促進するものと思われます。
また、低侵襲手術に対する需要の高まりや、費用対効果の高い製品が、シングルユース内視鏡の需要を加速しています。また、複数のエンドユーザーからの旺盛な需要により、メーカーは生産能力だけでなく、サプライチェーンネットワークの拡大も進めています。例えば、2022年11月、Fujifilm Europe B.V.とScivita Medical Technologyは、Scivitaの気管支内視鏡を欧州の主要国で販売するために協業しました。
さらに、高齢者人口の増加と相まって、対象疾患の負担が増加していることも、世界市場を支える要因となっています。パンデミック時の外科手術全体の減少が、2020年の内視鏡産業全体の成長に部分的に影響を及ぼしています。一方、内視鏡検査を行うヘルスケア従事者への感染や汚染の可能性を低減することで、予測期間中にシングルユース内視鏡デバイスの採用が促進されると予想されます。
使い捨て内視鏡市場レポートハイライト
- 気管支鏡は、呼吸器系疾患の負担が大きいことと、疾患診断のための内視鏡検査の採用が多いことから、最大のシェアを占めています。
- 膀胱鏡は、イメージング技術の進歩や尿路結石の増加により、最も速い成長率を記録すると予想されます。
- 外来施設セグメントは、ヘルスケアインフラの開拓と低侵襲処置の採用増加により、2022年に最大の市場を占めました。
- アジア太平洋は、疾病負担が大きい中、エンドユーザーからの需要が高く、市場関係者の様々な戦略的合意により、予測期間中に最も速い成長を示すと予想されます。
目次
第1章 調査手法と範囲
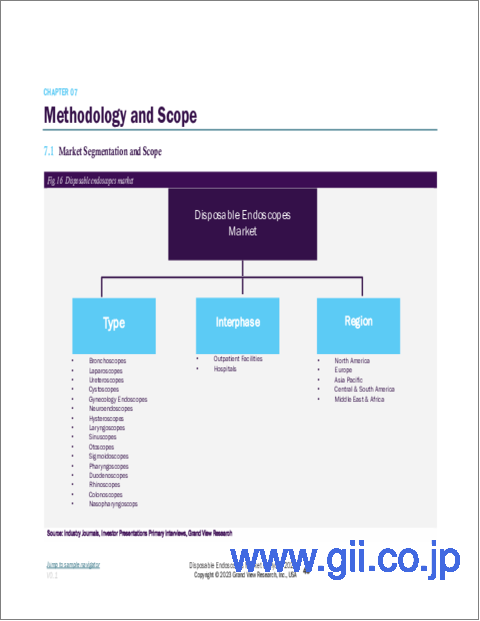
- 市場セグメンテーションと範囲
- セグメント範囲
- 地域範囲
- 推定・予測のタイムライン
- 調査手法
- 情報調達
- 購入したデータベース:
- GVRの内部データベース
- 二次情報
- 1次調査
- 1次調査の詳細
- 情報またはデータ分析
- データ分析モデル
- 市場の形成と検証
- モデル詳細
- 商品フロー分析
- アプローチ:コモディティフローアプローチ
- 商品フロー分析
- 調査の仮定
- 二次情報のリスト
- 略語のリスト
- 目的
第2章 エグゼクティブサマリー
- 市場の見通し
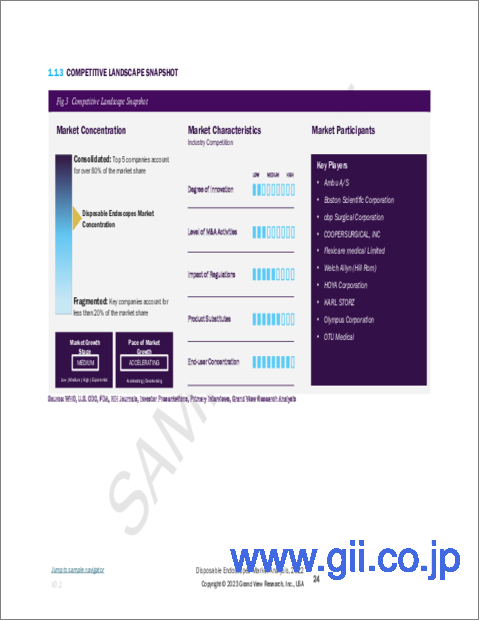
- 競合考察
第3章 使い捨て内視鏡市場の変数、動向、および範囲
- 市場系統の見通し
- 親市場
- 市場力学
- 市場促進要因の分析
- 対象疾患の発生率の増加
- 技術の進歩
- 使い捨て内視鏡の使用が増加
- 低侵襲手術の増加傾向
- 市場抑制要因分析
- 熟練した専門家の不足
- 製品のリコールと故障
- 市場促進要因の分析
- 普及と成長の見通しマッピング
- 人工呼吸器:市場分析ツール
- 業界分析- ポーターズ
- PESTLE分析
- 規制の枠組み
第4章 使い捨て内視鏡市場セグメント分析、タイプ別、2016~2030年
- 定義と範囲
- タイプ市場シェア分析、2022年および2030年
- セグメントダッシュボード
- 世界の使い捨て内視鏡市場、タイプ別、2016~2030年
- 2016年から2030年の市場規模、予測、傾向分析
- 腹腔鏡
- 関節鏡
- 尿管鏡
- 膀胱鏡
- 婦人科内視鏡
- 神経内視鏡
- 気管支鏡
- 子宮鏡
- 喉頭鏡
- 耳鏡
- S状結腸内視鏡
- 十二指腸鏡
- 鼻咽頭鏡
- 鼻鏡
- 大腸内視鏡
第5章 使い捨て内視鏡市場セグメント分析、最終用途別、2016~2030年
- 定義と範囲
- 市場シェア分析、2022年および2030年
- セグメントダッシュボード
- 世界の使い捨て内視鏡市場、最終用途別、2016年から2030年
- 2016年から2030年の市場規模、予測、傾向分析
- 外来施設
- 病院
第6章 使い捨て内視鏡市場セグメント分析、地域別、2016~2030年
- 定義と範囲
- 地域市場シェア分析、2022年および2030年
- 地域市場ダッシュボード
- 地域市場のスナップショット
- SWOT分析
- 北米
- 欧州
- アジア太平洋地域
- ラテンアメリカ
- 中東とアフリカ
- 市場規模、予測、収益および傾向分析、2022年から2030年まで
- 北米
- 米国
- 主要な国の動向
- 競合シナリオ
- 規制の枠組み
- 償還シナリオ
- カナダ
- 主要な国の動向
- 競合シナリオ
- 規制の枠組み
- 償還シナリオ
- 欧州
- 英国
- 主要な国の動向
- 競合シナリオ
- 規制の枠組み
- 償還シナリオ
- ドイツ
- 主要な国の動向
- 競合シナリオ
- 規制の枠組み
- 償還シナリオ
- スペイン
- 主要な国の動向
- 競合シナリオ
- 規制の枠組み
- 償還シナリオ
- フランス
- 主要な国の動向
- 競合シナリオ
- 規制の枠組み
- 償還シナリオ
- イタリア
- 主要な国の動向
- 競合シナリオ
- 規制の枠組み
- 償還シナリオ
- デンマーク
- 主要な国の動向
- 競合シナリオ
- 規制の枠組み
- 償還シナリオ
- ノルウェー
- 主要な国の動向
- 競合シナリオ
- 規制の枠組み
- 償還シナリオ
- スウェーデン
- 主要な国の動向
- 競合シナリオ
- 規制の枠組み
- 償還シナリオ
- アジア太平洋地域
- 日本
- 主要な国の動向
- 競合シナリオ
- 規制の枠組み
- 償還シナリオ
- 中国
- 主要な国の動向
- 競合シナリオ
- 規制の枠組み
- 償還シナリオ
- インド
- 主要な国の動向
- 競合シナリオ
- 規制の枠組み
- 償還シナリオ
- 韓国
- 主要な国の動向
- 競合シナリオ
- 規制の枠組み
- 償還シナリオ
- オーストラリア
- 主要な国の動向
- 競合シナリオ
- 規制の枠組み
- 償還シナリオ
- タイ
- 主要な国の動向
- 競合シナリオ
- 規制の枠組み
- 償還シナリオ
- ラテンアメリカ
- ブラジル
- 主要な国の動向
- 競合シナリオ
- 規制の枠組み
- 償還シナリオ
- メキシコ
- 主要な国の動向
- 競合シナリオ
- 規制の枠組み
- 償還シナリオ
- アルゼンチン
- 主要な国の動向
- 競合シナリオ
- 規制の枠組み
- 償還シナリオ
- MEA
- 南アフリカ
- 主要な国の動向
- 競合シナリオ
- 規制の枠組み
- 償還シナリオ
- サウジアラビア
- 主要な国の動向
- 競合シナリオ
- 規制の枠組み
- 償還シナリオ
- アラブ首長国連邦
- 主要な国の動向
- 競合シナリオ
- 規制の枠組み
- 償還シナリオ
- 北米
第7章 使い捨て内視鏡市場- 競合分析
- 主要市場参入企業別最近の動向と影響分析
- Heat map analysis
- Major Deals and Strategic Alliances Analysis
- 会社の分類
- イノベーター
- マーケットリーダー
- ベンダー情勢
- List of key distributors and channel partners
- Key customers
- 公開会社
- 競合ダッシュボード分析
- 非公開会社
- 主要な新興企業のリスト
- 企業プロファイル
- Ambu A/S
- Boston Scientific Corporation
- obp Surgical Corporation
- COOPERSURGICAL, INC.
- Flexicare medical Limited
- Welch Allyn(Hill Rom)
- HOYA Corporation
- KARL STORZ
- Olympus Corporation
- OTU Medical
List of Tables
- Table 1 List of Secondary Sources
- Table 2 List of Abbreviations
- Table 3 Leading Market Players Anticipated to Witness Highest Growth
- Table 4 Global Disposable Endoscopes Market, By Region, 2016 - 2030 (USD Million)
- Table 5 Global Disposable Endoscopes Market, By Type, 2016 - 2030 (USD Million)
- Table 6 Global Disposable Endoscopes Market, By End Use, 2016 - 2030 (USD Million)
- Table 7 North America Disposable Endoscopes Market, By Country, 2016 - 2030 (USD Million)
- Table 8 North America Disposable Endoscopes Market, By Type, 2016 - 2030 (USD Million)
- Table 9 North America Disposable Endoscopes Market, By End Use, 2016 - 2030 (USD Million)
- Table 10 U.S. Disposable Endoscopes Market, By Type, 2016 - 2030 (USD Million)
- Table 11 U.S. Disposable Endoscopes Market, By End Use, 2016 - 2030 (USD Million)
- Table 12 Canada Disposable Endoscopes Market, By Type, 2016 - 2030 (USD Million)
- Table 13 Canada Disposable Endoscopes Market, By End Use, 2016 - 2030 (USD Million)
- Table 14 Europe Disposable Endoscopes Market, By Country, 2016 - 2030 (USD Million)
- Table 15 Europe Disposable Endoscopes Market, By Type, 2016 - 2030 (USD Million)
- Table 16 Europe Disposable Endoscopes Market, By End Use, 2016 - 2030 (USD Million)
- Table 17 UK Disposable Endoscopes Market, By Type, 2016 - 2030 (USD Million)
- Table 18 UK Disposable Endoscopes Market, By End Use, 2016 - 2030 (USD Million)
- Table 19 Germany Disposable Endoscopes Market, By Type, 2016 - 2030 (USD Million)
- Table 20 Germany Disposable Endoscopes Market, By End Use, 2016 - 2030 (USD Million)
- Table 21 France Disposable Endoscopes Market, By Type, 2016 - 2030 (USD Million)
- Table 22 France Disposable Endoscopes Market, By End Use, 2016 - 2030 (USD Million)
- Table 23 Italy Disposable Endoscopes Market, By Type, 2016 - 2030 (USD Million)
- Table 24 Italy Disposable Endoscopes Market, By End Use, 2016 - 2030 (USD Million)
- Table 25 Spain Disposable Endoscopes Market, By Type, 2016 - 2030 (USD Million)
- Table 26 Spain Disposable Endoscopes Market, By End Use, 2016 - 2030 (USD Million)
- Table 27 Denmark Disposable Endoscopes Market, By Type, 2016 - 2030 (USD Million)
- Table 28 Denmark Disposable Endoscopes Market, By End Use, 2016 - 2030 (USD Million)
- Table 29 Norway Disposable Endoscopes Market, By Type, 2016 - 2030 (USD Million)
- Table 30 Norway Disposable Endoscopes Market, By End Use, 2016 - 2030 (USD Million)
- Table 31 Sweden Disposable Endoscopes Market, By Type, 2016 - 2030 (USD Million)
- Table 32 Sweden Disposable Endoscopes Market, By End Use, 2016 - 2030 (USD Million)
- Table 33 Asia Pacific Disposable Endoscopes Market, By Country, 2016 - 2030 (USD Million)
- Table 34 Asia Pacific Disposable Endoscopes Market, By Type, 2016 - 2030 (USD Million)
- Table 35 Asia Pacific Disposable Endoscopes Market, By End Use, 2016 - 2030 (USD Million)
- Table 36 Japan Disposable Endoscopes Market, By Type, 2016 - 2030 (USD Million)
- Table 37 Japan Disposable Endoscopes Market, By End Use, 2016 - 2030 (USD Million)
- Table 38 China Disposable Endoscopes Market, By Type, 2016 - 2030 (USD Million)
- Table 39 China Disposable Endoscopes Market, By End Use, 2016 - 2030 (USD Million)
- Table 40 India Disposable Endoscopes Market, By Type, 2016 - 2030 (USD Million)
- Table 41 India Disposable Endoscopes Market, By End Use, 2016 - 2030 (USD Million)
- Table 42 South Korea Disposable Endoscopes Market, By Type, 2016 - 2030 (USD Million)
- Table 43 South Korea Disposable Endoscopes Market, By End Use, 2016 - 2030 (USD Million)
- Table 44 Thailand Disposable Endoscopes Market, By Type, 2016 - 2030 (USD Million)
- Table 45 Thailand Disposable Endoscopes Market, By End Use, 2016 - 2030 (USD Million)
- Table 46 Australia Disposable Endoscopes Market, By Type, 2016 - 2030 (USD Million)
- Table 47 Australia Disposable Endoscopes Market, By End Use, 2016 - 2030 (USD Million)
- Table 48 Latin America Disposable Endoscopes Market, By Country, 2016 - 2030 (USD Million)
- Table 49 Latin America Disposable Endoscopes Market, By Type, 2016 - 2030 (USD Million)
- Table 50 Latin America Disposable Endoscopes Market, By End Use, 2016 - 2030 (USD Million)
- Table 51 Brazil Disposable Endoscopes Market, By Type, 2016 - 2030 (USD Million)
- Table 52 Brazil Disposable Endoscopes Market, By End Use, 2016 - 2030 (USD Million)
- Table 53 Argentina Disposable Endoscopes Market, By Type, 2016 - 2030 (USD Million)
- Table 54 Argentina Disposable Endoscopes Market, By End Use, 2016 - 2030 (USD Million)
- Table 55 Mexico Disposable Endoscopes Market, By Type, 2016 - 2030 (USD Million)
- Table 56 Mexico Disposable Endoscopes Market, By End Use, 2016 - 2030 (USD Million)
- Table 57 Middle East and Africa Disposable Endoscopes Market, By Country, 2016 - 2030 (USD Million)
- Table 58 Middle East and Africa Disposable Endoscopes Market, By Type, 2016 - 2030 (USD Million)
- Table 59 Middle East and Africa Disposable Endoscopes Market, By End Use, 2016 - 2030 (USD Million)
- Table 60 South Africa Disposable Endoscopes Market, By Type, 2016 - 2030 (USD Million)
- Table 61 South Africa Disposable Endoscopes Market, By End Use, 2016 - 2030 (USD Million)
- Table 62 Saudi Arabia Disposable Endoscopes Market, By Type, 2016 - 2030 (USD Million)
- Table 63 Saudi Arabia Disposable Endoscopes Market, By End Use, 2016 - 2030 (USD Million)
- Table 64 UAE Disposable Endoscopes Market, By Type, 2016 - 2030 (USD Million)
- Table 65 UAE Disposable Endoscopes Market, By End Use, 2016 - 2030 (USD Million)
- Table 66 Kuwait Disposable Endoscopes Market, By Type, 2016 - 2030 (USD Million)
- Table 67 Kuwait Disposable Endoscopes Market, By End Use, 2016 - 2030 (USD Million)
List of Figures
- Fig. 1 Disposable endoscopes market segmentation
- Fig. 2 Market research process
- Fig. 3 Information procurement
- Fig. 4 Primary research pattern
- Fig. 5 Market research approaches
- Fig. 6 Value-chain-based sizing & forecasting
- Fig. 7 QFD modeling for market share assessment
- Fig. 8 Market formulation & validation
- Fig. 9 Market outlook (2022)
- Fig. 10 Strategy framework
- Fig. 11 Market driver relevance analysis (Current & future impact)
- Fig. 12 Market restraint relevance analysis (Current & future impact)
- Fig. 13 Penetration & growth prospect mapping
- Fig. 14 Porter's five forces analysis
- Fig. 15 PESTLE analysis
- Fig. 16 Disposable endoscopes market: Type movement analysis
- Fig. 17 Disposable endoscopes market: Type segment dashboard
- Fig. 18 Disposable endoscopes market type outlook: Key takeaways
- Fig. 19 Laparoscopes market estimates and forecast, 2016 - 2030 (USD Million)
- Fig. 20 Arthroscopes market estimates and forecast, 2016 - 2030 (USD Million)
- Fig. 21 Ureteroscopes market estimates and forecast, 2016 - 2030 (USD Million)
- Fig. 22 Cystoscopes market estimates and forecast, 2016 - 2030 (USD Million)
- Fig. 23 Gynecology endoscopes market estimates and forecast, 2016 - 2030 (USD Million)
- Fig. 24 Neuroendoscopes market estimates and forecast, 2016 - 2030 (USD Million)
- Fig. 25 Bronchoscopes market estimates and forecast, 2016 - 2030 (USD Million)
- Fig. 26 Hysteroscopes market estimates and forecast, 2016 - 2030 (USD Million)
- Fig. 27 Laryngoscopes market estimates and forecast, 2016 - 2030 (USD Million)
- Fig. 28 Otoscopes market estimates and forecast, 2016 - 2030 (USD Million)
- Fig. 29 Duodenoscopes market estimates and forecast, 2016 - 2030 (USD Million)
- Fig. 30 Sigmoidoscopes market estimates and forecast, 2016 - 2030 (USD Million)
- Fig. 31 Nasopharyngoscopes market estimates and forecast, 2016 - 2030 (USD Million)
- Fig. 32 Rhinoscopes market estimates and forecast, 2016 - 2030 (USD Million)
- Fig. 33 Colonoscopes market estimates and forecast, 2016 - 2030 (USD Million)
- Fig. 34 Disposable endoscopes market: End-use movement analysis
- Fig. 35 Disposable endoscopes market: End-use segment dashboard
- Fig. 36 Disposable endoscopes market End-use outlook: Key takeaways
- Fig. 37 Hospitals market estimates and forecast, 2016 - 2030 (USD Million)
- Fig. 38 Outpatient facilities market estimates and forecast, 2016 - 2030 (USD Million)
- Fig. 39 Regional outlook, 2022 & 2030
- Fig. 40 Regional market dashboard
- Fig. 41 Regional market place: Key takeaways
- Fig. 42 North America, SWOT
- Fig. 43 Europe, SWOT
- Fig. 44 Asia Pacific, SWOT
- Fig. 45 Latin America, SWOT
- Fig. 46 Middle East and Africa, SWOT
- Fig. 47 North America
- Fig. 48 North America disposable endoscopes market, 2016 - 2030 (USD Million)
- Fig. 49 U.S.
- Fig. 50 U.S. disposable endoscopes market, 2016 - 2030 (USD Million)
- Fig. 51 Canada
- Fig. 52 Canada disposable endoscopes market, 2016 - 2030 (USD Million)
- Fig. 53 Europe
- Fig. 54 Europe disposable endoscopes market, 2016 - 2030 (USD Million)
- Fig. 55 UK
- Fig. 56 UK disposable endoscopes market, 2016 - 2030 (USD Million)
- Fig. 57 Germany
- Fig. 58 Germany disposable endoscopes market, 2016 - 2030 (USD Million)
- Fig. 59 Spain
- Fig. 60 Spain disposable endoscopes market, 2016 - 2030 (USD Million)
- Fig. 61 France
- Fig. 62 France disposable endoscopes market, 2016 - 2030 (USD Million)
- Fig. 63 Italy
- Fig. 64 Italy disposable endoscopes market, 2016 - 2030 (USD Million)
- Fig. 65 Denmark
- Fig. 66 Denmark disposable endoscopes market, 2016 - 2030 (USD Million)
- Fig. 67 Norway
- Fig. 68 Norway disposable endoscopes market, 2016 - 2030 (USD Million)
- Fig. 69 Sweden
- Fig. 70 Sweden disposable endoscopes market, 2016 - 2030 (USD Million)
- Fig. 71 Asia Pacific
- Fig. 72 Asia Pacific disposable endoscopes market, 2016 - 2030 (USD Million)
- Fig. 73 Japan
- Fig. 74 Japan disposable endoscopes market, 2016 - 2030 (USD Million)
- Fig. 75 China
- Fig. 76 China disposable endoscopes market, 2016 - 2030 (USD Million)
- Fig. 77 India
- Fig. 78 India disposable endoscopes market, 2016 - 2030 (USD Million)
- Fig. 79 South Korea
- Fig. 80 South Korea disposable endoscopes market, 2016 - 2030 (USD Million)
- Fig. 81 Australia
- Fig. 82 Australia disposable endoscopes market, 2016 - 2030 (USD Million)
- Fig. 83 Thailand
- Fig. 84 Thailand disposable endoscopes market, 2016 - 2030 (USD Million)
- Fig. 85 Latin America
- Fig. 86 Latin America disposable endoscopes market, 2016 - 2030 (USD Million)
- Fig. 87 Brazil
- Fig. 88 Brazil disposable endoscopes market, 2016 - 2030 (USD Million)
- Fig. 89 Mexico
- Fig. 90 Mexico disposable endoscopes market, 2016 - 2030 (USD Million)
- Fig. 91 Argentina
- Fig. 92 Argentina disposable endoscopes market, 2016 - 2030 (USD Million)
- Fig. 93 Middle East and Africa
- Fig. 94 MEA disposable endoscopes market, 2016 - 2030 (USD Million)
- Fig. 95 South Africa
- Fig. 96 South Africa disposable endoscopes market, 2016 - 2030 (USD Million)
- Fig. 97 Saudi Arabia
- Fig. 98 Saudi Arabia disposable endoscopes market, 2016 - 2030 (USD Million)
- Fig. 99 UAE
- Fig. 100 UAE disposable endoscopes market, 2016 - 2030 (USD Million)
- Fig. 101 Kuwait
- Fig. 102 Kuwait disposable endoscopes market, 2016 - 2030 (USD Million)
- Fig. 103 Heat map analysis
- Fig. 104 Market differentiators
Disposable Endoscopes Market Growth & Trends:
The global disposable endoscopes market size is expected to reach USD 7.32 billion by 2030, according to a new report by Grand View Research, Inc. The market is expected to expand at a CAGR of 16.9% from 2023 to 2030. The significant rise in the incidence of peptic ulcers, urological, gastrointestinal, respiratory, and other disorders that require endoscopic procedures for diagnosis is the key factor driving the disposable endoscopes market. In addition, several technological advancements, increased adoption of disposable endoscopes and visualization systems in healthcare settings is another factor supporting global market.
Moreover, the reusable endoscopes have a risk of leakage and contamination over the time, which in turn, fuels the demand for disposable devices due to their low cross-contamination risk. In addition, disposable endoscopes are cost effective as compared to reusable products. For instance, according to Single Use Endoscopy, a procedure with reusable endoscope costs around USD 1400-1900, whereas procedures with disposable endoscopes cost around USD 400 to USD1700. Thus, the several benefits of single use endoscopy devices is likely to facilitate their uptake in the forecast period.
In addition, the rising demand for minimally invasive procedures, and cost-effective products have accelerated the demand for single use endoscopes. Also, the robust demand from several end users is pushing manufacturers to expand their production capabilities as well as supply chain network. For instance, in November 2022 Fujifilm Europe B.V. and Scivita Medical Technology collaborated to distribute Scivita's broncho endoscopes across major countries in Europe.
Furthermore, the rising burden of target conditions, coupled with increasing elderly population is another factor supporting global market. The reduction of overall surgical procedures during the pandemic has partially impacted the overall endoscope industry growth in 2020. Whereas reduced chances of infection transmission and contamination to the healthcare personnel conducting endoscopy procedures is expected to boost the adoption of single use endoscopy devices over the forecast years.
Disposable Endoscopes Market Report Highlights:
- The bronchoscopes segment held the largest share owing to high burden of respiratory conditions and high adoption of endoscopy procedures for condition diagnosis
- The cystoscopes segment is anticipated to register the fastest growth rate because of technological advancements in imaging techniques and increasing incidence of UTIs
- The outpatient facilities segment accounted for the largest market in 2022 due to development in healthcare infrastructure and growth in adoption of minimally invasive procedures
- Asia Pacific is expected to exhibit the fastest growth over the forecast period due to high demand from end users amidst high disease burden and various strategic agreements by market players
Table of Contents
Chapter 1 Methodology and Scope
- 1.1 Market Segmentation and Scope
- 1.1.1 Segment scope
- 1.1.2 Regional scope
- 1.1.3 Estimates and forecast timeline
- 1.2 Research Methodology
- 1.3 Information Procurement
- 1.3.1 Purchased database:
- 1.3.2 GVR's internal database
- 1.3.3 Secondary sources
- 1.3.4 Primary research
- 1.3.5 Details of primary research
- 1.4 Information or Data Analysis
- 1.4.1 Data analysis models
- 1.5 Market Formulation & Validation
- 1.6 Model Details
- 1.6.1 Commodity Flow Analysis
- 1.6.1.1 Approach: Commodity Flow Approach
- 1.6.1 Commodity Flow Analysis
- 1.7 Research Assumptions
- 1.8 List of Secondary Sources
- 1.9 List of Abbreviations
- 1.10 Objectives
- 1.10.1 Objective 1
- 1.10.2 Objective 2
- 1.10.3 Objective 3
- 1.10.4 Objective 4
Chapter 2 Executive Summary
- 2.1 Market Outlook
- 2.2 Competitive Insights
Chapter 3 Disposable Endoscopes Market Variables, Trends, & Scope
- 3.1 Market Lineage Outlook
- 3.1.1 Parent market
- 3.2 Market Dynamics
- 3.2.1 Market drivers analysis
- 3.2.1.1 Increase in incidence of target disease
- 3.2.1.2 Technological advancements
- 3.2.1.3 Increased used of disposable endoscopes
- 3.2.1.4 Increasing trend of minimally invasive procedures
- 3.2.2 Market restraint analysis
- 3.2.2.1 Dearth of skilled professionals
- 3.2.2.2 Product recalls and failures
- 3.2.1 Market drivers analysis
- 3.3 Penetration & Growth Prospect Mapping
- 3.4 Mechanical Ventilators: Market Analysis Tools
- 3.4.1 Industry analysis - Porter's
- 3.4.2 PESTLE analysis
- 3.5 Regulatory Framework
Chapter 4 Disposable Endoscopes Market Segment Analysis, By Type, 2016 - 2030 (USD Million)
- 4.1 Definition and Scope
- 4.2 Type Market Share Analysis, 2022 & 2030
- 4.3 Segment Dashboard
- 4.4 Global Disposable Endoscopes Market, by Type, 2016 to 2030
- 4.5 Market Size & Forecasts and Trend Analyses, 2016 to 2030
- 4.5.1 Laparoscopes
- 4.5.1.1 Laparoscopes market estimates and forecast, 2016 - 2030 (USD Million)
- 4.5.2 Arthroscopes
- 4.5.2.1 Arthroscopes market estimates and forecast, 2016 - 2030 (USD Million)
- 4.5.3 Ureteroscopes
- 4.5.3.1 Ureteroscopes market estimates and forecast, 2016 - 2030 (USD Million)
- 4.5.4 Cystoscopes
- 4.5.4.1 Cystoscopes market estimates and forecast, 2016 - 2030 (USD Million)
- 4.5.5 Gynecology Endoscopes
- 4.5.5.1 Gynecology endoscopes market estimates and forecast, 2016 - 2030 (USD Million)
- 4.5.6 Neuroendoscopes
- 4.5.6.1 Neuroendoscopes market estimates and forecast, 2016 - 2030 (USD Million)
- 4.5.7 Bronchoscopes
- 4.5.7.1 Bronchoscopes market estimates and forecast, 2016 - 2030 (USD Million)
- 4.5.8 Hysteroscopes
- 4.5.8.1 Hysteroscopes market estimates and forecast, 2016 - 2030 (USD Million)
- 4.5.9 Laryngoscopes
- 4.5.9.1 Laryngoscopes market estimates and forecast, 2016 - 2030 (USD Million)
- 4.5.10 Otoscopes
- 4.5.10.1 Otoscopes market estimates and forecast, 2016 - 2030 (USD Million)
- 4.5.11 Sigmoidoscopes
- 4.5.11.1 Sigmoidoscopes market estimates and forecast, 2016 - 2030 (USD Million)
- 4.5.12 Duodenoscopes
- 4.5.12.1 Duodenoscopes market estimates and forecast, 2016 - 2030 (USD Million)
- 4.5.13 Nasopharyngoscopes
- 4.5.13.1 Nasopharyngoscopes market estimates and forecast, 2016 - 2030 (USD Million)
- 4.5.14 Rhinoscopes
- 4.5.14.1 Rhinoscopes market estimates and forecast, 2016 - 2030 (USD Million)
- 4.5.15 Colonoscopes
- 4.5.15.1 Colonoscopes market estimates and forecast, 2016 - 2030 (USD Million)
- 4.5.1 Laparoscopes
Chapter 5 Disposable Endoscopes Market Segment Analysis, By End Use 2016 - 2030 (USD Million)
- 5.1 Definition and Scope
- 5.2 Interphase Market Share Analysis, 2022 & 2030
- 5.3 Segment Dashboard
- 5.4 Global Disposable Endoscopes Market, by End Use, 2016 to 2030
- 5.5 Market Size & Forecasts and Trend Analyses, 2016 to 2030
- 5.5.1 Outpatient Facilities
- 5.5.1.1 Outpatient facilities market estimates and forecast, 2016 - 2030 (USD Million)
- 5.5.2 Hospitals
- 5.5.2.1 Hospitals estimates and forecast, 2016 - 2030 (USD Million)
- 5.5.1 Outpatient Facilities
Chapter 6 Disposable Endoscopes Market Segment Analysis, By Region, 2016 - 2030 (USD Million)
- 6.1 Definition & Scope
- 6.2 Regional Market Share Analysis, 2022 & 2030
- 6.3 Regional Market Dashboard
- 6.4 Regional Market Snapshot
- 6.5 SWOT Analysis
- 6.5.1 North America
- 6.5.2 Europe
- 6.5.3 Asia Pacific
- 6.5.4 Latin America
- 6.5.5 Middle East & Africa
- 6.6 Market Size, & Forecasts, Revenue and Trend Analysis, 2022 to 2030
- 6.6.1 North America
- 6.6.1.1 North America disposable endoscopes market estimates and forecast, 2016 - 2030 (USD Million)
- 6.6.1.2 U.S.
- 6.6.1.2.1 Key Country Dynamics
- 6.6.1.2.2 Competitive Scenario
- 6.6.1.2.3 Regulatory Framework
- 6.6.1.2.4 Reimbursement Scenario
- 6.6.1.2.5 U.S. disposable endoscopes market estimates and forecast, 2016 - 2030 (USD Million)
- 6.6.1.3 Canada
- 6.6.1.3.1 Key Country Dynamics
- 6.6.1.3.2 Competitive Scenario
- 6.6.1.3.3 Regulatory Framework
- 6.6.1.3.4 Reimbursement Scenario
- 6.6.1.3.5 Canada disposable endoscopes market estimates and forecast, 2016 - 2030 (USD Million)
- 6.6.2 Europe
- 6.6.2.1 Europe disposable endoscopes market estimates and forecast, 2016 - 2030 (USD Million)
- 6.6.2.2 UK
- 6.6.2.2.1 Key Country Dynamics
- 6.6.2.2.2 Competitive Scenario
- 6.6.2.2.3 Regulatory Framework
- 6.6.2.2.4 Reimbursement Scenario
- 6.6.2.2.5 UK disposable endoscopes market estimates and forecast, 2016 - 2030 (USD Million)
- 6.6.2.3 Germany
- 6.6.2.3.1 Key Country Dynamics
- 6.6.2.3.2 Competitive Scenario
- 6.6.2.3.3 Regulatory Framework
- 6.6.2.3.4 Reimbursement Scenario
- 6.6.2.3.5 Germany disposable endoscopes market estimates and forecast, 2016 - 2030 (USD Million)
- 6.6.2.4 Spain
- 6.6.2.4.1 Key Country Dynamics
- 6.6.2.4.2 Competitive Scenario
- 6.6.2.4.3 Regulatory Framework
- 6.6.2.4.4 Reimbursement Scenario
- 6.6.2.4.5 Spain disposable endoscopes market estimates and forecast, 2016 - 2030 (USD Million)
- 6.6.2.5 France
- 6.6.2.5.1 Key Country Dynamics
- 6.6.2.5.2 Competitive Scenario
- 6.6.2.5.3 Regulatory Framework
- 6.6.2.5.4 Reimbursement Scenario
- 6.6.2.5.5 France disposable endoscopes market estimates and forecast, 2016 - 2030 (USD Million)
- 6.6.2.6 Italy
- 6.6.2.6.1 Key Country Dynamics
- 6.6.2.6.2 Competitive Scenario
- 6.6.2.6.3 Regulatory Framework
- 6.6.2.6.4 Reimbursement Scenario
- 6.6.2.6.5 Italy disposable endoscopes market estimates and forecast, 2016 - 2030 (USD Million)
- 6.6.2.7 Denmark
- 6.6.2.7.1 Key Country Dynamics
- 6.6.2.7.2 Competitive Scenario
- 6.6.2.7.3 Regulatory Framework
- 6.6.2.7.4 Reimbursement Scenario
- 6.6.2.7.5 Denmark disposable endoscopes market estimates and forecast, 2016 - 2030 (USD Million)
- 6.6.2.8 Norway
- 6.6.2.8.1 Key Country Dynamics
- 6.6.2.8.2 Competitive Scenario
- 6.6.2.8.3 Regulatory Framework
- 6.6.2.8.4 Reimbursement Scenario
- 6.6.2.8.5 Norway disposable endoscopes market estimates and forecast, 2016 - 2030 (USD Million)
- 6.6.2.9 Sweden
- 6.6.2.9.1 Key Country Dynamics
- 6.6.2.9.2 Competitive Scenario
- 6.6.2.9.3 Regulatory Framework
- 6.6.2.9.4 Reimbursement Scenario
- 6.6.2.9.5 Sweden disposable endoscopes market estimates and forecast, 2016 - 2030 (USD Million)
- 6.6.3 Asia Pacific
- 6.6.3.1 Asia Pacific disposable endoscopes market estimates and forecast, 2016 - 2030 (USD Million)
- 6.6.3.2 Japan
- 6.6.3.2.1 Key Country Dynamics
- 6.6.3.2.2 Competitive Scenario
- 6.6.3.2.3 Regulatory Framework
- 6.6.3.2.4 Reimbursement Scenario
- 6.6.3.2.5 Japan disposable endoscopes market estimates and forecast, 2016 - 2030 (USD Million)
- 6.6.3.3 China
- 6.6.3.3.1 Key Country Dynamics
- 6.6.3.3.2 Competitive Scenario
- 6.6.3.3.3 Regulatory Framework
- 6.6.3.3.4 Reimbursement Scenario
- 6.6.3.3.5 China disposable endoscopes market estimates and forecast, 2016 - 2030 (USD Million)
- 6.6.3.4 India
- 6.6.3.4.1 Key Country Dynamics
- 6.6.3.4.2 Competitive Scenario
- 6.6.3.4.3 Regulatory Framework
- 6.6.3.4.4 Reimbursement Scenario
- 6.6.3.4.5 India disposable endoscopes market estimates and forecast, 2016 - 2030 (USD Million)
- 6.6.3.5 South Korea
- 6.6.3.5.1 Key Country Dynamics
- 6.6.3.5.2 Competitive Scenario
- 6.6.3.5.3 Regulatory Framework
- 6.6.3.5.4 Reimbursement Scenario
- 6.6.3.5.5 South Korea disposable endoscopes market estimates and forecast, 2016 - 2030 (USD Million)
- 6.6.3.6 Australia
- 6.6.3.6.1 Key Country Dynamics
- 6.6.3.6.2 Competitive Scenario
- 6.6.3.6.3 Regulatory Framework
- 6.6.3.6.4 Reimbursement Scenario
- 6.6.3.6.5 Australia disposable endoscopes market estimates and forecast, 2016 - 2030 (USD Million)
- 6.6.3.7 Thailand
- 6.6.3.7.1 Key Country Dynamics
- 6.6.3.7.2 Competitive Scenario
- 6.6.3.7.3 Regulatory Framework
- 6.6.3.7.4 Reimbursement Scenario
- 6.6.3.7.5 Thailand disposable endoscopes market estimates and forecast, 2016 - 2030 (USD Million)
- 6.6.4 Latin America
- 6.6.4.1 Latin America disposable endoscopes market estimates and forecast, 2016 - 2030 (USD Million)
- 6.6.4.2 Brazil
- 6.6.4.2.1 Key Country Dynamics
- 6.6.4.2.2 Competitive Scenario
- 6.6.4.2.3 Regulatory Framework
- 6.6.4.2.4 Reimbursement Scenario
- 6.6.4.2.5 Brazil disposable endoscopes market estimates and forecast, 2016 - 2030 (USD Million)
- 6.6.4.3 Mexico
- 6.6.4.3.1 Key Country Dynamics
- 6.6.4.3.2 Competitive Scenario
- 6.6.4.3.3 Regulatory Framework
- 6.6.4.3.4 Reimbursement Scenario
- 6.6.4.3.5 Mexico disposable endoscopes market estimates and forecast, 2016 - 2030 (USD Million)
- 6.6.4.4 Argentina
- 6.6.4.4.1 Key Country Dynamics
- 6.6.4.4.2 Competitive Scenario
- 6.6.4.4.3 Regulatory Framework
- 6.6.4.4.4 Reimbursement Scenario
- 6.6.4.4.5 Argentina disposable endoscopes market estimates and forecast, 2016 - 2030 (USD Million)
- 6.6.5 MEA
- 6.6.5.1 MEA disposable endoscopes market estimates and forecast, 2016 - 2030 (USD Million)
- 6.6.5.2 South Africa
- 6.6.5.2.1 Key Country Dynamics
- 6.6.5.2.2 Competitive Scenario
- 6.6.5.2.3 Regulatory Framework
- 6.6.5.2.4 Reimbursement Scenario
- 6.6.5.2.5 South Africa disposable endoscopes market estimates and forecast, 2016 - 2030 (USD Million)
- 6.6.5.3 Saudi Arabia
- 6.6.5.3.1 Key Country Dynamics
- 6.6.5.3.2 Competitive Scenario
- 6.6.5.3.3 Regulatory Framework
- 6.6.5.3.4 Reimbursement Scenario
- 6.6.5.3.5 Saudi Arabia disposable endoscopes market estimates and forecast, 2016 - 2030 (USD Million)
- 6.6.5.4 UAE
- 6.6.5.4.1 Key Country Dynamics
- 6.6.5.4.2 Competitive Scenario
- 6.6.5.4.3 Regulatory Framework
- 6.6.5.4.4 Reimbursement Scenario
- 6.6.5.4.5 UAE disposable endoscopes market estimates and forecast, 2016 - 2030 (USD Million)
- 6.6.1 North America
Chapter 7 Disposable Endoscopes Market - Competitive Analysis
- 7.1 Recent Developments & Impact Analysis, by Key Market Participants
- 7.1.1 Heat map analysis
- 7.1.2 Major Deals and Strategic Alliances Analysis
- 7.1.2.1 Joint Ventures
- 7.1.2.2 Licensing Agreements
- 7.1.2.3 Product Launches
- 7.2 Company Categorization
- 7.2.1 Innovators
- 7.2.2 Market Leaders
- 7.3 Vendor Landscape
- 7.3.1 List of key distributors and channel partners
- 7.3.2 Key customers
- 7.4 Public Companies
- 7.4.1 Competitive Dashboard Analysis
- 7.4.1.1 Market Differentiators
- 7.4.1 Competitive Dashboard Analysis
- 7.5 Private Companies
- 7.5.1 List of key emerging companies
- 7.6 Company Profiles
- 7.6.1 Ambu A/S
- 7.6.1.1 Company overview
- 7.6.1.2 Financial performance
- 7.6.1.3 Product benchmarking
- 7.6.1.4 Strategic Initiatives
- 7.6.2 Boston Scientific Corporation
- 7.6.2.1 Company overview
- 7.6.2.2 Financial performance
- 7.6.2.3 Product benchmarking
- 7.6.2.4 Strategic Initiatives
- 7.6.3 obp Surgical Corporation
- 7.6.3.1 Company overview
- 7.6.3.2 Financial performance
- 7.6.3.3 Product benchmarking
- 7.6.3.4 Strategic Initiatives
- 7.6.4 COOPERSURGICAL, INC.
- 7.6.4.1 Company overview
- 7.6.4.2 Financial performance
- 7.6.4.3 Product benchmarking
- 7.6.4.4 Strategic Initiatives
- 7.6.5 Flexicare medical Limited
- 7.6.5.1 Company overview
- 7.6.5.2 Financial performance
- 7.6.5.3 Product benchmarking
- 7.6.5.4 Strategic Initiatives
- 7.6.6 Welch Allyn (Hill Rom)
- 7.6.6.1 Company overview
- 7.6.6.2 Financial performance
- 7.6.6.3 Product benchmarking
- 7.6.6.4 Strategic Initiatives
- 7.6.7 HOYA Corporation
- 7.6.7.1 Company overview
- 7.6.7.2 Financial performance
- 7.6.7.3 Product benchmarking
- 7.6.7.4 Strategic initiatives
- 7.6.8 KARL STORZ
- 7.6.8.1 Company overview
- 7.6.8.2 Financial performance
- 7.6.8.3 Product benchmarking
- 7.6.8.4 Strategic initiatives
- 7.6.9 Olympus Corporation
- 7.6.9.1 Company overview
- 7.6.9.2 Financial performance
- 7.6.9.3 Product benchmarking
- 7.6.9.4 Strategic initiatives
- 7.6.10 OTU Medical
- 7.6.10.1 Company overview
- 7.6.10.2 Financial performance
- 7.6.10.3 Product benchmarking
- 7.6.10.4 Strategic initiatives
- 7.6.1 Ambu A/S