|
|
市場調査レポート
商品コード
1224531
LED照明の市場規模、シェア、動向分析レポート:製品別(ランプ、照明器具)、用途別(屋内、屋外)、最終用途別(商業、住宅、産業)、地域別、およびセグメント別予測、2023年~2030年LED Lighting Market Size, Share & Trends Analysis Report By Product (Lamps, Luminaires), By Application (Indoor, Outdoor), By End-use (Commercial, Residential, Industrial), By Region, And Segment Forecasts, 2023 - 2030 |
||||||
|
|
|||||||
|
● お客様のご希望に応じて、既存データの加工や未掲載情報(例:国別セグメント)の追加などの対応が可能です。 詳細はお問い合わせください。 |
|||||||


| LED照明の市場規模、シェア、動向分析レポート:製品別(ランプ、照明器具)、用途別(屋内、屋外)、最終用途別(商業、住宅、産業)、地域別、およびセグメント別予測、2023年~2030年 |
|
出版日: 2023年01月06日
発行: Grand View Research
ページ情報: 英文 120 Pages
納期: 2~10営業日
|
- 全表示
- 概要
- 図表
- 目次
LED照明の市場成長と動向
LED照明の世界市場規模は、2023年から2030年までCAGR11.0%で拡大し、2030年には1688億7000万米ドルに達すると予測されることが、Grand View Research Inc.の新しい調査により明らかになっています。AランプやTランプのようなLED照明装置の需要は、エネルギー効率の高い照明ソリューションに対する顧客需要の高まりに応じて上昇すると予想されます。顧客は、低発熱、明るい光、省エネ、低コストなどの利点により、LED照明に魅了されています。他のタイプの照明に対する LED 照明の利点は、住宅用および商業用アプリケーションの両方に対する建築業界からの需要の増加と相まって、市場の成長を促進する可能性が高い要因です。
また、自動車メーカーは、購入者を引きつけるために、はっきりとした現代的な外観の車を発売することに注力しています。LED照明ソリューションにより、メーカーは複雑なデザインの製品を小型で美しいパッケージで自由に作ることができるため、自動車産業でのLED照明ソリューションの採用率が高くなっています。自動車メーカーによるヘッドライト、フォグランプ、インテリア照明へのLEDの採用が進み、対象市場の拡大が予想されます。
LED照明産業は、産業建設活動の明らかな増加とエネルギー効率の高い照明ソリューションの需要増加により、有利に成長すると予想されます。しかし、世界のCOVID-19の大流行によりインフラ整備やビル運用が停滞し、LED照明の需要が低くなっています。また、設置コストに対する消費者の理解が低いことも、市場拡大を阻害する要因となっています。
COVID-19の影響により、市場は悪影響を受けた。製造施設を含む勤務先で政府による厳しいロックダウンが行われ、サプライチェーンに大きな混乱が生じ、照明の生産がさらに停止しました。しかし、2021年第2四半期に政府が強制規制を撤廃した後、LED照明産業は繁栄し始めました。
LED照明市場レポートハイライト
ホテルやリゾートの美観を向上させ、かつエネルギー使用量を削減するような革新的な照明ソリューションの需要は、世界で活況を呈するホスピタリティ産業が牽引している
商業・工業分野からの需要増加により、LED照明器具カテゴリは世界市場での優位性を維持し、2022年の収益シェアの55.18%以上を保持すると予想される
2022年、アジア太平洋地域は43.61%という大きな収益シェアを占めました。これは、新興国でのインフラ構築プロジェクトの急増や、エネルギー効率、明るい光、低価格といったLEDの利点に関する消費者の知識の高まりによるものです。
目次
第1章 調査手法と範囲
- 調査手法のセグメンテーションと範囲
- 情報調達
- 購入したデータベース
- GVRの内部データベース
- 二次情報と第三者の視点
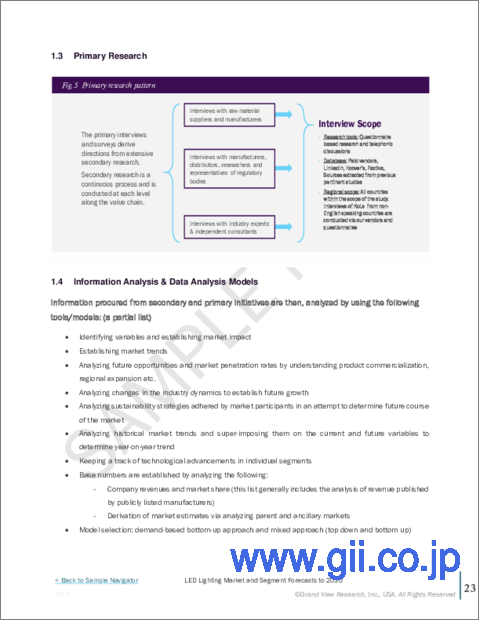
- 1次調査
- 情報分析
- データ分析モデル
- 市場形成とデータ可視化
- データの検証と公開
第2章 エグゼクティブサマリー
第3章 LED照明市場の変数、動向、範囲
- 業界バリューチェーン分析
- 市場力学
- 市場促進要因分析
- 市場抑制・課題分析
- 市場機会分析
- 浸透と成長の見通しのマッピング(重要な機会の優先順位付け)
- ビジネス環境分析ツール
- 業界分析- ポーターのファイブフォース分析
- PEST分析
- COVID-19影響分析
第4章 LED照明市場の製品展望
- 製品別LED照明市場シェア、2022年および2030年(10億米ドル)
- ランプ
- Aランプ
- Tランプ
- その他
- 照明器具
- 街灯
- ダウンライト
- トロフィー
- その他
第5章 LED照明市場のアプリケーションの見通し
- アプリケーション別LED照明市場シェア、2022年および2030年(10億米ドル)
- 屋内
- アウトドア
第6章 LED照明市場のエンドユースの見通し
- 最終用途別のLED照明市場シェア、2022年および2030年(10億米ドル)
- 商業
- 住宅
- 工業用
- その他
第7章 LED照明市場:地域の見通し
- 地域別LED照明市場シェア、2022年および2030年(10億米ドル)
- 北米
- 米国
- カナダ
- 欧州
- 英国
- ドイツ
- フランス
- その他欧州
- アジア太平洋地域
- 中国
- インド
- 日本
- その他アジア太平洋地域
- ラテンアメリカ
- ブラジル
- メキシコ
- その他ラテンアメリカ
- 中東とアフリカ
第8章 競合情勢
- Acuity Brands Lighting Inc.
- 会社概要
- 財務実績
- 製品のベンチマーク
- 最近の開発
- Cree Lighting
- 会社概要
- 財務実績
- 製品のベンチマーク
- 最近の開発
- Dialight
- 会社概要
- 財務実績
- 製品のベンチマーク
- 最近の開発
- Digital Lumens Inc
- 会社概要
- 財務実績
- 製品のベンチマーク
- 最近の開発
- Hubbell
- 会社概要
- 財務実績
- 製品のベンチマーク
- 最近の開発
- LSI Industries Inc.
- 会社概要
- 財務実績
- 製品のベンチマーク
- 最近の開発
- LumiGrow
- 会社概要
- 財務実績
- 製品のベンチマーク
- 最近の開発
- Panasonic Corporation
- 会社概要
- 財務実績
- 製品のベンチマーク
- 最近の開発
- Siteco GmbH
- 会社概要
- 財務実績
- 製品のベンチマーク
- 最近の開発
- Signify Holding
- 会社概要
- 財務実績
- 製品のベンチマーク
- 最近の開発
- Semiconductor Co. Ltd.
- 会社概要
- 財務実績
- 製品のベンチマーク
- 最近の開発
- Zumtobel Group Ag
- 会社概要
- 財務実績
- 製品のベンチマーク
- 最近の開発
List of Tables
- Table 1 Global LED lighting market, 2018 - 2030 (USD Billion)
- Table 2 Global LED lighting market, by region, 2018 - 2030 (USD Billion)
- Table 3 Global LED lighting market, by product, 2018 - 2030 (USD Billion)
- Table 4 Global LED lighting market, by application, 2018 - 2030 (USD Billion)
- Table 5 Global LED lighting market, by end-use, 2018 - 2030 (USD Billion)
- Table 6 Lamps market, 2018 - 2030 (USD Billion)
- Table 7 Lamps market, by region, 2018 - 2030 (USD Billion)
- Table 8 A-Lamps market, 2018 - 2030 (USD Billion)
- Table 9 A-Lamps market, by region, 2018 - 2030 (USD Billion)
- Table 10 T-Lamps market, 2018 - 2030 (USD Billion)
- Table 11 T-Lamps market, by region, 2018 - 2030 (USD Billion)
- Table 12 Luminaires market, 2018 - 2030 (USD Billion)
- Table 13 Luminaires market, by region, 2018 - 2030 (USD Billion)
- Table 14 Streetlights market, 2018 - 2030 (USD Billion)
- Table 15 Streetlights market, by region, 2018 - 2030 (USD Billion)
- Table 16 Downlights market, 2018 - 2030 (USD Billion)
- Table 17 Downlights market, by region, 2018 - 2030 (USD Billion)
- Table 18 Troffers market, 2018 - 2030 (USD Billion)
- Table 19 Troffers market, by region, 2018 - 2030 (USD Billion)
- Table 20 Others market, 2018 - 2030 (USD Billion)
- Table 21 Others market, by region, 2018 - 2030 (USD Billion)
- Table 22 Indoor market, 2018 - 2030 (USD Billion)
- Table 23 Indoor market, by region, 2018 - 2030 (USD Billion)
- Table 24 Outdoor market, 2018 - 2030 (USD Billion)
- Table 25 Outdoor market, by region, 2018 - 2030 (USD Billion)
- Table 26 Commercial market, 2018 - 2030 (USD Billion)
- Table 27 Commercial market, by region, 2018 - 2030 (USD Billion)
- Table 28 Residential market, 2018 - 2030 (USD Billion)
- Table 29 Residential market, by region, 2018 - 2030 (USD Billion)
- Table 30 Industrial market, 2018 - 2030 (USD Billion)
- Table 31 Industrial market, by region, 2018 - 2030 (USD Billion)
- Table 32 Others market, 2018 - 2030 (USD Billion)
- Table 33 Others market, by region, 2018 - 2030 (USD Billion)
- Table 34 North America LED lighting market, 2018 - 2030 (USD Billion)
- Table 35 North America LED lighting market, by product, 2018 - 2030 (USD Billion)
- Table 36 North America LED lighting market, by application, 2018 - 2030 (USD Billion)
- Table 37 North America LED lighting market, by end-use, 2018 - 2030 (USD Billion)
- Table 38 U.S. LED lighting market, 2018 - 2030 (USD Billion)
- Table 39 U.S. LED lighting market, by product, 2018 - 2030 (USD Billion)
- Table 40 U.S. LED lighting market, by application, 2018 - 2030 (USD Billion)
- Table 41 U.S. LED lighting market, by end-use, 2018 - 2030 (USD Billion)
- Table 42 Canada LED lighting market, 2018 - 2030 (USD Billion)
- Table 43 Canada LED lighting market, by product, 2018 - 2030 (USD Billion)
- Table 44 Canada LED lighting market, by application, 2018 - 2030 (USD Billion)
- Table 45 Canada LED lighting market, by end-use, 2018 - 2030 (USD Billion)
- Table 46 Europe LED lighting market, 2018 - 2030 (USD Billion)
- Table 47 Europe LED lighting market, by product, 2018 - 2030 (USD Billion)
- Table 48 Europe LED lighting market, by application, 2018 - 2030 (USD Billion)
- Table 49 Europe LED lighting market, by end-use, 2018 - 2030 (USD Billion)
- Table 50 U.K. LED lighting market, 2018 - 2030 (USD Billion)
- Table 51 U.K. LED lighting market, by product, 2018 - 2030 (USD Billion)
- Table 52 U.K. LED lighting market, by application, 2018 - 2030 (USD Billion)
- Table 53 U.K. LED lighting market, by end-use, 2018 - 2030 (USD Billion)
- Table 54 Germany LED lighting market, 2018 - 2030 (USD Billion)
- Table 55 Germany LED lighting market, by product, 2018 - 2030 (USD Billion)
- Table 56 Germany LED lighting market, by application, 2018 - 2030 (USD Billion)
- Table 57 Germany LED lighting market, by end-use, 2018 - 2030 (USD Billion)
- Table 58 France LED lighting market, 2018 - 2030 (USD Billion)
- Table 59 France LED lighting market, by product, 2018 - 2030 (USD Billion)
- Table 60 France LED lighting market, by application, 2018 - 2030 (USD Billion)
- Table 61 France LED lighting market, by end-use, 2018 - 2030 (USD Billion)
- Table 62 Rest of Europe LED lighting market, 2018 - 2030 (USD Billion)
- Table 63 Rest of Europe LED lighting market, by product, 2018 - 2030 (USD Billion)
- Table 64 Rest of Europe LED lighting market, by application, 2018 - 2030 (USD Billion)
- Table 65 Rest of Europe LED lighting market, by end-use, 2018 - 2030 (USD Billion)
- Table 66 Asia Pacific LED lighting market, 2018 - 2030 (USD Billion)
- Table 67 Asia Pacific LED lighting market, by product, 2018 - 2030 (USD Billion)
- Table 68 Asia Pacific LED lighting market, by application, 2018 - 2030 (USD Billion)
- Table 69 Asia Pacific LED lighting market, by end-use, 2018 - 2030 (USD Billion)
- Table 70 China LED lighting market, 2018 - 2030 (USD Billion)
- Table 71 China LED lighting market, by product, 2018 - 2030 (USD Billion)
- Table 72 China LED lighting market, by application, 2018 - 2030 (USD Billion)
- Table 73 China LED lighting market, by end-use, 2018 - 2030 (USD Billion)
- Table 74 India LED lighting market, 2018 - 2030 (USD Billion)
- Table 75 India LED lighting market, by product, 2018 - 2030 (USD Billion)
- Table 76 India LED lighting market, by application, 2018 - 2030 (USD Billion)
- Table 77 India LED lighting market, by end-use, 2018 - 2030 (USD Billion)
- Table 78 Japan LED lighting market, 2018 - 2030 (USD Billion)
- Table 79 Japan LED lighting market, by product, 2018 - 2030 (USD Billion)
- Table 80 Japan LED lighting market, by application, 2018 - 2030 (USD Billion)
- Table 81 Japan LED lighting market, by end-use, 2018 - 2030 (USD Billion)
- Table 82 Rest of Asia Pacific LED lighting market, 2018 - 2030 (USD Billion)
- Table 83 Rest of Asia Pacific LED lighting market, by product, 2018 - 2030 (USD Billion)
- Table 84 Rest of Asia Pacific LED lighting market, by application, 2018 - 2030 (USD Billion)
- Table 85 Rest of Asia Pacific LED lighting market, by end-use, 2018 - 2030 (USD Billion)
- Table 86 Latin America LED lighting market, 2018 - 2030 (USD Billion)
- Table 87 Latin America LED lighting market, by product, 2018 - 2030 (USD Billion)
- Table 88 Latin America LED lighting market, by application, 2018 - 2030 (USD Billion)
- Table 89 Latin America LED lighting market, by end-use, 2018 - 2030 (USD Billion)
- Table 90 Brazil LED lighting market, 2018 - 2030 (USD Billion)
- Table 91 Brazil LED lighting market, by product, 2018 - 2030 (USD Billion)
- Table 92 Brazil LED lighting market, by application, 2018 - 2030 (USD Billion)
- Table 93 Brazil LED lighting market, by end-use, 2018 - 2030 (USD Billion)
- Table 94 Mexico LED lighting market, 2018 - 2030 (USD Billion)
- Table 95 Mexico LED lighting market, by product, 2018 - 2030 (USD Billion)
- Table 96 Mexico LED lighting market, by application, 2018 - 2030 (USD Billion)
- Table 97 Mexico LED lighting market, by end-use, 2018 - 2030 (USD Billion)
- Table 98 Rest of Latin America LED lighting market, 2018 - 2030 (USD Billion)
- Table 99 Rest of Latin America LED lighting market, by product, 2018 - 2030 (USD Billion)
- Table 100 Rest of Latin America LED lighting market, by application, 2018 - 2030 (USD Billion)
- Table 101 Rest of Latin America LED lighting market, by end-use, 2018 - 2030 (USD Billion)
- Table 102 Middle East & Africa LED lighting market, 2018 - 2030 (USD Billion)
- Table 103 Middle East & Africa LED lighting market, by product, 2018 - 2030 (USD Billion)
- Table 104 Middle East & Africa LED lighting market, by application, 2018 - 2030 (USD Billion)
- Table 105 Middle East & Africa LED lighting market, by end-use, 2018 - 2030 (USD Billion)
List of Figures
- Fig. 1 Market Segmentation & Scope
- Fig. 2 Information Procurement
- Fig. 3 Primary Research Pattern
- Fig. 4 Primary Research Process
- Fig. 5 Market Formulation and Data Visualization
- Fig. 6 Industry Snapshot
- Fig. 7 LED Lighting Market Size and Growth Prospects, 2018 - 2030 (USD Billion)
- Fig. 8 LED Lighting Market Value Chain Analysis
- Fig. 9 LED Lighting Market Penetration & Growth Prospect Mapping (Key Opportunity Prioritized)
- Fig. 10 Industry Analysis - Porter's Five Forces
- Fig. 11 PEST Analysis
- Fig. 12 LED Lighting Market, by Product, Key Takeaways (USD Billion)
- Fig. 13 Product Movement Analysis & Market Share, 2022 & 2030
- Fig. 14 LED Lighting Market, by Application, Key Takeaways (USD Billion)
- Fig. 15 Application Movement Analysis & Market Share, 2022 & 2030
- Fig. 16 LED Lighting Market, by End-use, Key Takeaways (USD Billion)
- Fig. 17 End-use Movement Analysis & Market Share, 2022 & 2030
- Fig. 18 Regional market size estimates & forecasts, 2018 - 2030 (USD Billion)
- Fig. 19 North America LED Lighting Market Outlook and Market Share by Country, 2022 & 2030 (USD Billion)
- Fig. 20 Europe LED Lighting Market Outlook and Market Share by Country, 2022 & 2030 (USD Billion)
- Fig. 21 Asia Pacific LED Lighting Market Outlook and Market Share by Country, 2022 & 2030 (USD Billion)
- Fig. 22 Latin America LED Lighting Market Outlook and Market Share by Country, 2022 & 2030 (USD Billion)
- Fig. 23 Middle East & Africa LED Lighting Market Outlook and Market Share by Country, 2022 & 2030 (USD Billion)
- Fig. 24 Key Company Ranking Analysis, 2022
LED Lighting Market Growth & Trends:
The global LED lighting market size is anticipated to reach USD 168.87 billion by 2030, expanding at a CAGR of 11.0% from 2023 to 2030, according to a new study by Grand View Research Inc. Demand for LED lighting devices like A-lamps and T-lamps is anticipated to rise in response to rising customer demand for energy-efficient lighting solutions. Clients are attracted to LED lighting due to its benefits like lower heat emission, brighter light, energy savings, and low cost. The advantages of LED lighting over other types of lighting, coupled with the increasing demand from the building industry for both residential and commercial applications, are factors likely to propel the market growth.
Additionally, automakers are concentrating on releasing cars with a distinctly contemporary appearance to draw in buyers. LED lighting solutions give manufacturers the freedom to create goods with intricate designs in small, aesthetically pleasing packages, which has led to a high rate of adoption of LED lighting solutions by the automotive industry. The target market is anticipated to expand as a result of the increased adoption of LEDs by automakers in headlights, fog lights, and interior illumination applications.
The LED lighting industry is anticipated to grow favorably as a result of an obvious increase in industrial construction activities and increased demand for energy-efficient lighting solutions. However, the global COVID-19 pandemic has slowed down infrastructure development and building operations, resulting in low demand for LED lighting. Low consumer understanding of installation costs is another factor impeding the market's expansion.
The market was adversely affected by COVID-19. Severe lockdowns imposed by governments at places of employment, including manufacturing facilities, caused significant disruption in the supply chain and further halted the production of lights. However, after the government removed the enforced regulation in the second quarter of 2021, the LED lighting industry began to flourish.
LED Lighting Market Report Highlights:
- The demand for innovative lighting solutions that would improve the aesthetics of hotels and resorts while also reducing energy usage is being driven by the world's booming hospitality industry
- Due to rising demand from the commercial and industrial sectors, the LED luminaires category is anticipated to maintain its dominance on the global market, holding more than 55.18% of the revenue share in 2022
- In 2022, the Asia Pacific region accounted for a significant revenue share of 43.61%. This can be ascribed to the quick rise in infrastructure-building projects in emerging nations as well as growing consumer knowledge of the advantages of LED, such as their energy efficiency, bright light, and low price
Table of Contents
Chapter 1. Methodology and Scope
- 1.1. Methodology Segmentation & Scope
- 1.2. Information Procurement
- 1.2.1. Purchased database
- 1.2.2. GVR's internal database
- 1.2.3. Secondary sources & third-party perspectives
- 1.2.4. Primary research
- 1.3. Information Analysis
- 1.3.1. Data analysis models
- 1.4. Market Formulation & Data Visualization
- 1.5. Data Validation & Publishing
Chapter 2. Executive Summary
- 2.1. LED Lighting Market - Industry Snapshot, 2018 - 2030
Chapter 3. LED Lighting Market Variables, Trends & Scope
- 3.1. Market Size and Growth Prospects, 2018 - 2030
- 3.2. Industry Value Chain Analysis
- 3.3. Market Dynamics
- 3.3.1. Market Driver Analysis
- 3.3.2. Market Restraint/Challenge Analysis
- 3.3.3. Market Opportunity Analysis
- 3.4. Penetration & Growth Prospect Mapping (Key Opportunities Prioritized)
- 3.5. Business Environment Analysis Tools
- 3.5.1. Industry Analysis - Porter's Five Forces Analysis
- 3.5.2. PEST Analysis
- 3.5.3. COVID-19 Impact Analysis
Chapter 4. LED Lighting Market Product Outlook
- 4.1. LED Lighting Market Share by Product, 2022 & 2030 (USD Billion)
- 4.2. Lamps
- 4.2.1. Market estimates and forecasts, 2018 - 2030 (USD Billion)
- 4.2.2. Market estimates and forecast by region, 2018 - 2030 (USD Billion)
- 4.2.3. A-Lamps
- 4.2.3.1. Market estimates and forecast, 2018 - 2030 (USD Billion)
- 4.2.3.2. Market estimates and forecast by region, 2018 - 2030 (USD Billion)
- 4.2.4. T-Lamps
- 4.2.4.1. Market estimates and forecast, 2018 - 2030 (USD Billion)
- 4.2.4.2. Market estimates and forecast by region, 2018 - 2030 (USD Billion)
- 4.2.5. Others
- 4.2.5.1. Market estimates and forecast, 2018 - 2030 (USD Billion)
- 4.2.5.2. Market estimates and forecast by region, 2018 - 2030 (USD Billion)
- 4.3. Luminaires
- 4.3.1. Market estimates and forecast, 2018 - 2030 (USD Billion)
- 4.3.2. Market estimates and forecast by region, 2018 - 2030 (USD Billion)
- 4.3.3. Streetlights
- 4.3.3.1. Market estimates and forecast, 2018 - 2030 (USD Billion)
- 4.3.3.2. Market estimates and forecast by region, 2018 - 2030 (USD Billion)
- 4.3.4. Downlights
- 4.3.4.1. Market estimates and forecast, 2018 - 2030 (USD Billion)
- 4.3.4.2. Market estimates and forecast by region, 2018 - 2030 (USD Billion)
- 4.3.5. Troffers
- 4.3.5.1. Market estimates and forecast, 2018 - 2030 (USD Billion)
- 4.3.5.2. Market estimates and forecast by region, 2018 - 2030 (USD Billion)
- 4.3.6. Others
- 4.3.6.1. Market estimates and forecast, 2018 - 2030 (USD Billion)
- 4.3.6.2. Market estimates and forecast by region, 2018 - 2030 (USD Billion)
Chapter 5. LED Lighting Market Application Outlook
- 5.1. LED Lighting Market Share by Application, 2022 & 2030 (USD Billion)
- 5.2. Indoor
- 5.2.1. Market estimates and forecast, 2018 - 2030 (USD Billion)
- 5.2.2. Market estimates and forecast by region, 2018 - 2030 (USD Billion)
- 5.3. Outdoor
- 5.3.1. Market estimates and forecast, 2018 - 2030 (USD Billion)
- 5.3.2. Market estimates and forecast by region, 2018 - 2030 (USD Billion)
Chapter 6. LED Lighting Market End-use Outlook
- 6.1. LED Lighting Market Share by End-use, 2022 & 2030 (USD Billion)
- 6.2. Commercial
- 6.2.1. Market estimates and forecasts, 2018 - 2030 (USD Billion)
- 6.2.2. Market estimates and forecast by region, 2018 - 2030 (USD Billion)
- 6.3. Residential
- 6.3.1. Market estimates and forecast, 2018 - 2030 (USD Billion)
- 6.3.2. Market estimates and forecast by region, 2018 - 2030 (USD Billion)
- 6.4. Industrial
- 6.4.1. Market estimates and forecast, 2018 - 2030 (USD Billion)
- 6.4.2. Market estimates and forecast by region, 2018 - 2030 (USD Billion)
- 6.5. Others
- 6.5.1. Market Size Estimates and Forecasts, 2018 - 2030 (USD Billion)
- 6.5.2. Market estimates and forecast by region, 2018 - 2030 (USD Billion)
Chapter 7. LED Lighting Market: Regional Outlook
- 7.1. LED Lighting Market Share by Region, 2022 & 2030 (USD Billion)
- 7.2. North America
- 7.2.1. Market estimates and forecast, 2018 - 2030 (USD Billion)
- 7.2.2. Market estimates and forecast by product, 2018 - 2030 (USD Billion)
- 7.2.3. Market estimates and forecast by application, 2018 - 2030 (USD Billion)
- 7.2.4. Market estimates and forecast by end-use, 2018 - 2030 (USD Billion)
- 7.2.5. U.S.
- 7.2.5.1. Market estimates and forecast, 2018 - 2030 (USD Billion)
- 7.2.5.2. Market estimates and forecast by product, 2018 - 2030 (USD Billion)
- 7.2.5.3. Market estimates and forecast by application, 2018 - 2030 (USD Billion)
- 7.2.5.4. Market estimates and forecast by end-use, 2018 - 2030 (USD Billion)
- 7.2.6. Canada
- 7.2.6.1. Market estimates and forecast, 2018 - 2030 (USD Billion)
- 7.2.6.2. Market estimates and forecast by product, 2018 - 2030 (USD Billion)
- 7.2.6.3. Market estimates and forecast by application, 2018 - 2030 (USD Billion)
- 7.2.6.4. Market estimates and forecast by end-use, 2018 - 2030 (USD Billion)
- 7.3. Europe
- 7.3.1. Market estimates and forecast, 2018 - 2030 (USD Billion)
- 7.3.2. Market estimates and forecast by product, 2018 - 2030 (USD Billion)
- 7.3.3. Market estimates and forecast by application, 2018 - 2030 (USD Billion)
- 7.3.4. Market estimates and forecast by end-use, 2018 - 2030 (USD Billion)
- 7.3.5. U.K.
- 7.3.5.1. Market estimates and forecast, 2018 - 2030 (USD Billion)
- 7.3.5.2. Market estimates and forecast by product, 2018 - 2030 (USD Billion)
- 7.3.5.3. Market estimates and forecast by application, 2018 - 2030 (USD Billion)
- 7.3.5.4. Market estimates and forecast by end-use, 2018 - 2030 (USD Billion)
- 7.3.6. Germany
- 7.3.6.1. Market estimates and forecast, 2018 - 2030 (USD Billion)
- 7.3.6.2. Market estimates and forecast by product, 2018 - 2030 (USD Billion)
- 7.3.6.3. Market estimates and forecast by application, 2018 - 2030 (USD Billion)
- 7.3.6.4. Market estimates and forecast by end-use, 2018 - 2030 (USD Billion)
- 7.3.7. France
- 7.3.7.1. Market estimates and forecast, 2018 - 2030 (USD Billion)
- 7.3.7.2. Market estimates and forecast by product, 2018 - 2030 (USD Billion)
- 7.3.7.3. Market estimates and forecast by application, 2018 - 2030 (USD Billion)
- 7.3.7.4. Market estimates and forecast by end-use, 2018 - 2030 (USD Billion)
- 7.3.8. Rest of Europe
- 7.3.8.1. Market estimates and forecast, 2018 - 2030 (USD Billion)
- 7.3.8.2. Market estimates and forecast by product, 2018 - 2030 (USD Billion)
- 7.3.8.3. Market estimates and forecast by end-use, 2018 - 2030 (USD Billion)
- 7.4. Asia Pacific
- 7.4.1. Market estimates and forecast, 2018 - 2030 (USD Billion)
- 7.4.2. Market estimates and forecast by product, 2018 - 2030 (USD Billion)
- 7.4.3. Market estimates and forecast by application, 2018 - 2030 (USD Billion)
- 7.4.4. Market estimates and forecast by end-use, 2018 - 2030 (USD Billion)
- 7.4.5. China
- 7.4.5.1. Market estimates and forecast, 2018 - 2030 (USD Billion)
- 7.4.5.2. Market estimates and forecast by product, 2018 - 2030 (USD Billion)
- 7.4.5.3. Market estimates and forecast by application, 2018 - 2030 (USD Billion)
- 7.4.5.4. Market estimates and forecast by end-use, 2018 - 2030 (USD Billion)
- 7.4.6. India
- 7.4.6.1. Market estimates and forecast, 2018 - 2030 (USD Billion)
- 7.4.6.2. Market estimates and forecast by product, 2018 - 2030 (USD Billion)
- 7.4.6.3. Market estimates and forecast by application, 2018 - 2030 (USD Billion)
- 7.4.6.4. Market estimates and forecast by end-use, 2018 - 2030 (USD Billion)
- 7.4.7. Japan
- 7.4.7.1. Market estimates and forecast, 2018 - 2030 (USD Billion)
- 7.4.7.2. Market estimates and forecast by product, 2018 - 2030 (USD Billion)
- 7.4.7.3. Market estimates and forecast by application, 2018 - 2030 (USD Billion)
- 7.4.7.4. Market estimates and forecast by end-use, 2018 - 2030 (USD Billion)
- 7.4.8. Rest of Asia Pacific
- 7.4.8.1. Market estimates and forecast, 2018 - 2030 (USD Billion)
- 7.4.8.2. Market estimates and forecast by product, 2018 - 2030 (USD Billion)
- 7.4.8.3. Market estimates and forecast by application, 2018 - 2030 (USD Billion)
- 7.4.8.4. Market estimates and forecast by end-use, 2018 - 2030 (USD Billion)
- 7.5. Latin America
- 7.5.1. Market estimates and forecast, 2018 - 2030 (USD Billion)
- 7.5.2. Market estimates and forecast by product, 2018 - 2030 (USD Billion)
- 7.5.3. Market estimates and forecast by application, 2018 - 2030 (USD Billion)
- 7.5.4. Market estimates and forecast by end-use, 2018 - 2030 (USD Billion)
- 7.5.5. Brazil
- 7.5.5.1. Market estimates and forecast, 2018 - 2030 (USD Billion)
- 7.5.5.2. Market estimates and forecast by product, 2018 - 2030 (USD Billion)
- 7.5.5.3. Market estimates and forecast by application, 2018 - 2030 (USD Billion)
- 7.5.5.4. Market estimates and forecast by end-use, 2018 - 2030 (USD Billion)
- 7.5.6. Mexico
- 7.5.6.1. Market estimates and forecast, 2018 - 2030 (USD Billion)
- 7.5.6.2. Market estimates and forecast by product, 2018 - 2030 (USD Billion)
- 7.5.6.3. Market estimates and forecast by application, 2018 - 2030 (USD Billion)
- 7.5.6.4. Market estimates and forecast by end-use, 2018 - 2030 (USD Billion)
- 7.5.7. Rest of Latin America
- 7.5.7.1. Market estimates and forecast, 2018 - 2030 (USD Billion)
- 7.5.7.2. Market estimates and forecast by product, 2018 - 2030 (USD Billion)
- 7.5.7.3. Market estimates and forecast by application, 2018 - 2030 (USD Billion)
- 7.5.7.4. Market estimates and forecast by end-use, 2018 - 2030 (USD Billion)
- 7.6. Middle East & Africa
- 7.6.1. Market estimates and forecast, 2018 - 2030 (USD Billion)
- 7.6.2. Market estimates and forecast by product, 2018 - 2030 (USD Billion)
- 7.6.3. Market estimates and forecast by application, 2018 - 2030 (USD Billion)
- 7.6.4. Market estimates and forecast by end-use, 2018 - 2030 (USD Billion)
Chapter 8. Competitive Landscape
- 8.1. Acuity Brands Lighting Inc.
- 8.1.1. Company overview
- 8.1.2. Financial performance
- 8.1.3. Product benchmarking
- 8.1.4. Recent developments
- 8.2. Cree Lighting
- 8.2.1. Company overview
- 8.2.2. Financial performance
- 8.2.3. Product benchmarking
- 8.2.4. Recent developments
- 8.3. Dialight
- 8.3.1. Company overview
- 8.3.2. Financial performance
- 8.3.3. Product benchmarking
- 8.3.4. Recent developments
- 8.4. Digital Lumens Inc
- 8.4.1. Company overview
- 8.4.2. Financial performance
- 8.4.3. Product benchmarking
- 8.4.4. Recent developments
- 8.5. Hubbell
- 8.5.1. Company overview
- 8.5.2. Financial performance
- 8.5.3. Product benchmarking
- 8.5.4. Recent developments
- 8.6. LSI Industries Inc.
- 8.6.1. Company overview
- 8.6.2. Financial performance
- 8.6.3. Product benchmarking
- 8.6.4. Recent developments
- 8.7. LumiGrow
- 8.7.1. Company overview
- 8.7.2. Financial performance
- 8.7.3. Product benchmarking
- 8.7.4. Recent developments
- 8.8. Panasonic Corporation
- 8.8.1. Company overview
- 8.8.2. Financial performance
- 8.8.3. Product benchmarking
- 8.8.4. Recent developments
- 8.9. Siteco GmbH
- 8.9.1. Company overview
- 8.9.2. Financial performance
- 8.9.3. Product benchmarking
- 8.9.4. Recent developments
- 8.10. Signify Holding
- 8.10.1. Company overview
- 8.10.2. Financial performance
- 8.10.3. Product benchmarking
- 8.10.4. Recent developments
- 8.11. Semiconductor Co. Ltd.
- 8.11.1. Company overview
- 8.11.2. Financial performance
- 8.11.3. Product benchmarking
- 8.11.4. Recent developments
- 8.12. Zumtobel Group Ag
- 8.12.1. Company overview
- 8.12.2. Financial performance
- 8.12.3. Product benchmarking
- 8.12.4. Recent developments