|
|
市場調査レポート
商品コード
1147586
コールドチェーン市場規模・シェア・動向分析レポート:タイプ別(保管、監視部品)、装置別(保管、輸送)、用途別(魚、肉、水産)、包装別、地域別、セグメント別予測、2022年~2030年Cold Chain Market Size, Share & Trends Analysis Report By Type (Storage, Monitoring Components), By Equipment (Storage, Transportation), By Application (Fish, Meat & Seafood), By Packaging, By Region, And Segment Forecasts, 2022 - 2030 |
||||||
|
|
|||||||
|
● お客様のご希望に応じて、既存データの加工や未掲載情報(例:国別セグメント)の追加などの対応が可能です。 詳細はお問い合わせください。 |
|||||||


| コールドチェーン市場規模・シェア・動向分析レポート:タイプ別(保管、監視部品)、装置別(保管、輸送)、用途別(魚、肉、水産)、包装別、地域別、セグメント別予測、2022年~2030年 |
|
出版日: 2022年10月07日
発行: Grand View Research
ページ情報: 英文 350 Pages
納期: 2~10営業日
|
- 全表示
- 概要
- 図表
- 目次
コールドチェーン市場の成長と動向
グランドビューリサーチ社の最新レポートによると、世界のコールドチェーン市場は2030年までに9869億1000万米ドルに達し、CAGR17.1%を記録すると予測されています。インドや中国など新興国の小売部門は組織化が進んでおり、この動向が予測期間中にコールドストレージの需要を増大させると予想されます。外国企業の参入を規制緩和する政府の政策により、こうした地域の小売セクターへの外国直接投資(FDI)が増加しています。
組織化された小売店では、従来の店舗よりも優れた冷蔵技術や改良された保管技術が使用されています。そのため、消費者はこれらの小売店で冷凍食品を購入することが多くなっています。冷蔵・冷凍食品への需要の高まりと組織小売セクターの急拡大により、低温保存ソリューションの需要は予測期間中に拡大すると予想されます。組織小売業は、消費力および主要な住宅地や消費クラスターへの近接度に応じて、さまざまな店舗形態をサポートしています。
組織小売業のオフライン・モードは、商品の品揃えと販売面積に基づいて、コンビニエンスストア、スーパーマーケット、ハイパーマーケットに分類されます。一方、輸送ハブや港湾では冷凍トレーラー用の電源フックがなく、冷蔵倉庫には信頼できる電源がないため、運営コストがさらに増加します。
しかし、このことは、新興国市場において、これらの問題を克服できる独自のソリューションを開発したり、代替エネルギー源を活用したりする企業にとってチャンスでもあります。さらに、適切な輸送施設の不足を解消するために、多用途の冷蔵コンテナなどの新しい輸送手段が開発されています。これらのソリューションは、国際市場へのアクセスを可能にし、これらの地域の農家や小規模事業者に機会を提供することができます。
コールドチェーン市場のレポートハイライト
低炭素設計、環境監査、エネルギー効率の高い冷蔵倉庫の建設が、冷蔵倉庫の需要を促進すると予想されます。
スーパーマーケットでの買い物文化の拡大、プライベートブランドに対する消費者の嗜好の高まりは、世界各地の食品小売チェーン拡大の主な要因となっています。
コールドパック分野は、CAGR 21.0%を記録すると予測されています。この成長は、消費者の生活水準と食品消費行動の著しい変化に起因しています。
加工食品用途は、予測期間中に19.1%という高いCAGRを記録すると予想されています。
コールドチェーンの一次情報源市場は、米国、カナダ、ドイツ、中国、英国、インド、フランス、日本、韓国です。米国はコールドチェーンプロバイダーにとって一次情報市場となるでしょう。
日本の市場は飽和状態になりつつあり、その結果、日本のコールドストレージ事業者は国際貿易を強化する道を模索しています。
市場の主要企業には、Americold Logistics LLC、Agro Merchant Group、Burris Logistics, Inc.、Henningsen Cold Storage Company、Lineage Logistics, LLC、Nordic Logistics、Preferred Freezer、Wabash National、Cold Chain Technologies, Inc、 Cryopak Industries Inc、Creopack、Cold Box Express, Inc、Intelsius、Nilkamal Limited、Sofrigam、 Softbox Systems Ltd、 Sonoco ThermoSafe、 Valor Industries、 va Q tec AGが挙げられます。
目次
第1章 調査手法と範囲
- 調査手法
- 調査範囲と前提
- データソースのリスト
- 略語一覧
第2章 エグゼクティブサマリー
- 主要な市場動向
- 食品小売チェーンの拡大
- CO2/NH3カスケード冷凍システムの意味
- 冷媒の環境影響
- 医薬品のコールドチェーン流通におけるコストとリスクの削減戦略
- 医薬品サプライチェーンにおけるモノのインターネット(IoT)
- 主な国の動向
- 中国
- 中国Eコマース業界動向
- eコマースが中国の水産物市場に与える影響
- 食品および飲料のeコマースがサプライチェーンに与える影響
- オンライン小売大手によるコールドチェーンシステムのアップグレードへの取り組み
- 中国における生鮮食品プロデュースEコマースのビジネスモデル
- 統合されたB2C eコマースマーケットプレース
- バーティカルB2C eコマースプラットフォーム
- 物流会社が運営するEコマースプラットフォーム
- スーパーマーケットが運営するO2Oモデル
- コミュニティ O2Oモデル
- 中国における生鮮食品のeコマース-損失増加の要因
- Eコマースの課題克服要因
- 生鮮食品のeコマース-コールドチェーンロジスティクスの要件
- シンガポール
- インド
- 政府の取り組み
- 日本
- 米国
- 中国
- ブラジル
- コールドチェーン型の見通し(売上高、10億米ドル、2017年-2030年)
- 保管所
- 交通手段
- コンポーネントの監視
- コールドチェーンパッケージングの見通し(収益、USD Million;2017-2030)
- 製品
- 材料
- コールドチェーン設備の見通し(収益、USD Million;2017-2030)
- コールドチェーンアプリケーションの見通し(収益、USD Million;2017-2030)
- 乳製品
- 医薬品
- ベーカリー&製菓
- 加工食品
- 魚、肉、魚介類
- 果物と野菜
- 果肉・濃縮物
- その他(調理済み、鶏肉)
- 中国
第3章 市場変数、動向、および範囲の見通し
- 市場セグメンテーションと範囲
- コールドチェーンの市場規模と成長の見通し
- コールドチェーン市場-バリューチェーン分析
- コールドチェーン市場力学
- 冷媒市場分析
- 市場促進要因分析
- 市場抑制要因分析
- 市場機会分析
- 市場課題分析
- 主要な機会- 優先順位付け
- 冷蔵容量を持つ主要プレーヤーのリスト-2021
- 冷蔵・冷凍食品の規制の枠組み
- 米国
- カナダ
- ドイツ
- 英国
- インド
- 中国
- オランダ
- ノルウェー
- シンガポール
- 日本
- コールドチェーン市場- ポーターのファイブフォース分析
- サプライヤーの力
- 買い手の交渉力
- 代替の脅威
- 新規参入者からの脅威
- 競争企業間の敵対関係
- コールドチェーン市場-PEST分析
- 政治情勢
- 経済情勢
- 社会情勢
- テクノロジー情勢
- COVID-19影響分析
第4章 コールドチェーン市場タイプの見通し
- コールドチェーン市場、タイプ別分析と市場シェア、2021年と2030年
- 保管所
- 倉庫
- オングリッド
- オフグリッド
- 冷凍コンテナ
- 倉庫
- 輸送手段
- 道路
- 海路
- 鉄道
- 空路
- コンポーネントの監視
- ハードウェア
- センサー
- RFIDデバイス
- テレマティクス
- ネットワーキングデバイス
- ソフトウェア
- オンプレミス
- クラウドベース
- ハードウェア
第5章 コールドチェーン市場の包装の見通し
- コールドチェーン市場、包装分析と市場シェア別、2021年と2030年
- 製品
- クレート
- 乳製品
- 医薬品
- 漁業
- 園芸
- 保冷コンテナ・ボックス
- ペイロードサイズ
- 大(32~66リットル)
- ミディアム(21~29リットル)
- 小(10~17リットル)
- X-small(3~8リットル)
- 小柄(0.9~2.7リットル)
- タイプ
- コールドチェーンバッグ/ワクチンバッグ
- 段ボール箱
- その他
- 保冷剤
- ラベル
- 定温パレットシッパー
- クレート
- 材料
- 断熱材
- EPS
- PUR
- VIP
- 極低温タンク
- その他
- 断熱材
- フルオロカーボン
- 無機物
- アンモニア
- CO2
- 炭化水素
- 断熱材
第6章 コールドチェーン市場設備の見通し
- コールドチェーン市場、機器分析と市場シェア別、2021年と2030年
- ストレージ機器
- オングリッド
- オフグリッド
- 輸送機器
第7章 コールドチェーン市場のアプリケーションの見通し
- コールドチェーン市場、アプリケーション分析と市場シェア別、2021年と2030年
- 果物と野菜
- 果肉・濃縮物
- 乳製品
- 魚、肉、魚介類
- 加工食品
- 医薬品
- ベーカリー&製菓
- その他
第8章 コールドチェーン市場:地域の推定・動向分析
- 地域別コールドチェーン市場シェア、2021年および2030年
第9章 競合分析
- 主要な市場参入企業別最近の動向と影響分析
- 企業/競合の分類(主要なイノベーター、マーケットリーダー、新興企業、ニッチプレイヤー)
- ベンダー情勢
- 主要企業の市場シェア分析、2021年
- 企業分析ツール
- 市況分析
- 競合ダッシュボード分析
第10章 競合情勢
- 企業プロファイル
- Americold Logistics LLC
- 会社概要
- 財務実績
- タイプのベンチマーク
- 戦略的イニシアチブ
- Agro Merchant Group
- 会社概要
- 財務実績
- タイプのベンチマーク
- 戦略的イニシアチブ
- Burris Logistics, Inc.
- 会社概要
- 財務実績
- タイプのベンチマーク
- 戦略的イニシアチブ
- Henningsen Cold Storage Company
- 会社概要
- 財務実績
- タイプのベンチマーク
- 戦略的イニシアチブ
- Lineage Logistics, LLC
- 会社概要
- 財務実績
- タイプのベンチマーク
- 戦略的イニシアチブ
- Nordic Logistics
- 会社概要
- 財務実績
- タイプのベンチマーク
- 戦略的イニシアチブ
- Preferred Freezer
- 会社概要
- 財務実績
- タイプのベンチマーク
- 戦略的イニシアチブ
- Wabash National
- 会社概要
- 財務実績
- タイプのベンチマーク
- 戦略的イニシアチブ
- Americold Logistics LLC
- 企業プロファイル:包装ソリューション会社
- コールドチェーンテクノロジーズ株式会社
- 会社概要
- 財務実績
- タイプのベンチマーク
- 戦略的イニシアチブ
- クライオパックインダストリーズ株式会社
- 会社概要
- 財務実績
- タイプのベンチマーク
- 戦略的イニシアチブ
- クレオパック
- 会社概要
- 財務実績
- タイプのベンチマーク
- 戦略的イニシアチブ
- 株式会社コールドボックスエクスプレス
- 会社概要
- 財務実績
- タイプのベンチマーク
- 戦略的イニシアチブ
- インテリウス
- 会社概要
- 財務実績
- タイプのベンチマーク
- 戦略的イニシアチブ
- ニルカマル・リミテッド
- 会社概要
- 財務実績
- タイプのベンチマーク
- 戦略的イニシアチブ
- ソフリガム
- 会社概要
- 財務実績
- タイプのベンチマーク
- 戦略的イニシアチブ
- ソフトボックスシステム株式会社
- 会社概要
- 財務実績
- タイプのベンチマーク
- 戦略的イニシアチブ
- Sonocoサーモセーフ
- 会社概要
- 財務実績
- タイプのベンチマーク
- 戦略的イニシアチブ
- バロールインダストリーズ
- 会社概要
- 財務実績
- タイプのベンチマーク
- 戦略的イニシアチブ
- va Q tec AG
- 会社概要
- 財務実績
- タイプのベンチマーク
- 戦略的イニシアチブ
- コールドチェーンテクノロジーズ株式会社
List of Tables
- TABLE 1 Global Retail Development Index (GRDI)
- TABLE 2 Cold chain- Industry snapshot & critical success factor, 2017 - 2030
- TABLE 3 Global cold chain market, 2017 - 2030 (USD Billion)
- TABLE 4 Global cold chain market, 2017 - 2030 (USD Billion)
- TABLE 5 Global cold chain market, by type, 2017 - 2030 (USD Billion)
- TABLE 6 Global cold chain type market, by storage, 2017 - 2030 (USD Billion)
- TABLE 7 Global cold chain storage market, by warehouse, 2017 - 2030 (USD Billion)
- TABLE 8 Global cold chain type market, by transportation, 2017 - 2030 (USD Billion)
- TABLE 9 Global cold chain type market, by monitoring components, 2017 - 2030 (USD Billion)
- TABLE 10 Global cold chain monitoring components market, by hardware, 2017 - 2030 (USD Billion)
- TABLE 11 Global cold chain monitoring components market, by software, 2017 - 2030 (USD Billion)
- TABLE 12 Global cold chain market, by packaging, 2017 - 2030 (USD Billion)
- TABLE 13 Global cold chain packaging market, by product, 2017 - 2030 (USD Billion)
- TABLE 14 Global cold chain product market, by crates, 2017 - 2030 (USD Billion)
- TABLE 15 Global cold chain insulated container & boxes market, by payload size, 2017 - 2030 (USD Billion)
- TABLE 16 Global cold chain packaging market, by material, 2017 - 2030 (USD Billion)
- TABLE 17 Global cold chain material market, by insulating materials, 2017 - 2030 (USD Billion)
- TABLE 18 Global cold chain material market, by refrigerants, 2017 - 2030 (USD Billion)
- TABLE 19 Global cold chain refrigerants market, by inorganics, 2017 - 2030 (USD Billion)
- TABLE 20 Global cold chain market, by equipment, 2017 - 2030 (USD Billion)
- TABLE 21 Global cold chain equipment market, by storage equipment, 2017 - 2030 (USD Billion)
- TABLE 22 Global cold chain storage equipment market, by on-grid, 2017 - 2030 (USD Billion)
- TABLE 23 Global cold chain storage equipment market, by off-grid, 2017 - 2030 (USD Billion)
- TABLE 24 Global cold chain market, by application, 2017 - 2030 (USD Billion)
- TABLE 25 Global cold chain application market, by fruits & vegetables, 2017 - 2030 (USD Billion)
- TABLE 26 Global cold chain application market, by dairy products, 2017 - 2030 (USD Billion)
- TABLE 27 Global cold chain application market, by fish, meat & seafood, 2017 - 2030 (USD Billion)
- TABLE 28 Global cold chain application market, by processed food, 2017 - 2030 (USD Billion)
- TABLE 29 Global cold chain application market, by pharmaceutical, 2017 - 2030 (USD Billion)
- TABLE 30 Global cold chain market estimates and forecasts by region, 2017 - 2030 (USD Billion)
- TABLE 31 Key international regulations & their impact on the refrigerant industry
- TABLE 32 Key company analysis
- TABLE 33 List of key players with cold storage capacity
- TABLE 34 Global storage market by region, 2017 - 2030 (USD Billion)
- TABLE 35 Global cold chain storage market by warehouse, 2017 - 2030 (USD Billion)
- TABLE 36 Global cold chain warehouse market by on-grid, 2017 - 2030 (USD Billion)
- TABLE 37 Global cold chain warehouse market by off-grid, 2017 - 2030 (USD Billion)
- TABLE 38 Global cold chain storage market by reefer container, 2017 - 2030 (USD Billion)
- TABLE 39 Global cold chain transportation market by region, 2017 - 2030 (USD Billion)
- TABLE 40 Global cold chain transportation market by road, 2017 - 2030 (USD Billion)
- TABLE 41 Global cold chain transportation market by sea, 2017 - 2030 (USD Billion)
- TABLE 42 Global cold chain transportation market by rail, 2017 - 2030 (USD Billion)
- TABLE 43 Global cold chain transportation market by air, 2017 - 2030 (USD Billion)
- TABLE 44 Global cold chain monitoring components market by region, 2017 - 2030 (USD Billion)
- TABLE 45 Global cold chain monitoring components market by hardware, 2017 - 2030 (USD Billion)
- TABLE 46 Global cold chain monitoring components market by sensors, 2017 - 2030 (USD Billion)
- TABLE 47 Global cold chain monitoring components market by RFID devices, 2017 - 2030 (USD Billion)
- TABLE 48 Global cold chain monitoring components market by telematics, 2017 - 2030 (USD Billion)
- TABLE 49 Global cold chain monitoring components market by networking devices, 2017 - 2030 (USD Billion)
- TABLE 50 Global cold chain monitoring components market by software, 2017 - 2030 (USD Billion)
- TABLE 51 Global cold chain monitoring components market by software, 2017 - 2030 (USD Billion)
- TABLE 52 Global cold chain monitoring components market by software, 2017 - 2030 (USD Billion)
- TABLE 53 Global cold chain packaging product market by region, 2017 - 2030 (USD Billion)
- TABLE 54 Global cold chain packaging product market by crates, 2017 - 2030 (Volume in Million units)
- TABLE 55 Global cold chain packaging product market by crates, 2017 - 2030 (USD Billion)
- TABLE 56 Global cold chain crates market by dairy, 2017 - 2030 (USD Billion)
- TABLE 57 Global cold chain crates market by pharmaceuticals, 2017 - 2030 (USD Billion)
- TABLE 58 Global cold chain crates market by fisheries, 2017 - 2030 (USD Billion)
- TABLE 59 Global cold chain crates market by horticulture, 2017 - 2030 (USD Billion)
- TABLE 60 Global cold chain packaging product market by insulated container & boxes, 2017 - 2030 (Volume in Million Units)
- TABLE 61 Global cold chain packaging product market by insulated container & boxes, 2017 - 2030 (USD Billion)
- TABLE 62 Global cold chain insulated container & boxes market by payload size, 2017 - 2030 (USD Billion)
- TABLE 63 Global cold chain insulated container & boxes market by payload size, 2017 - 2030 (USD Billion)
- TABLE 64 Global cold chain insulated container & boxes market by payload size, 2017 - 2030 (USD Billion)
- TABLE 65 Global cold chain insulated container & boxes market by payload size, 2017 - 2030 (USD Billion)
- TABLE 66 Global cold chain insulated container & boxes market by payload size, 2017 - 2030 (USD Billion)
- TABLE 67 Global cold chain insulated container & boxes market by type, 2017 - 2030 (USD Billion)
- TABLE 68 Global cold chain insulated container & boxes market by type, 2017 - 2030 (USD Billion)
- TABLE 69 Global cold chain insulated container & boxes market by type, 2017 - 2030 (USD Billion)
- TABLE 70 Global cold chain packaging product market by cold packs, 2017 - 2030 (USD Billion)
- TABLE 71 Global cold chain packaging product market by labels, 2017 - 2030 (USD Billion)
- TABLE 72 Global cold chain packaging product market by temperature-controlled pallet shippers, 2017 - 2030 (USD Billion)
- TABLE 73 Global cold chain packaging material market by region, 2017 - 2030 (USD Billion)
- TABLE 74 Global cold chain packaging material market by insulating material, 2017 - 2030 (USD Billion)
- TABLE 75 Global cold chain packaging material market by insulating material, 2017 - 2030 (USD Billion)
- TABLE 76 Global cold chain packaging material market by insulating material, 2017 - 2030 (USD Billion)
- TABLE 77 Global cold chain packaging material market by insulating material, 2017 - 2030 (USD Billion)
- TABLE 78 Global cold chain packaging material market by insulating material, 2017 - 2030 (USD Billion)
- TABLE 79 Global cold chain packaging material market by insulating material, 2017 - 2030 (USD Billion)
- TABLE 80 Global cold chain packaging material market by refrigerants, 2017 - 2030 (USD Billion)
- TABLE 81 Global cold chain packaging material market by refrigerants, 2017 - 2030 (USD Billion)
- TABLE 82 Global cold chain packaging material market by refrigerants, 2017 - 2030 (USD Billion)
- TABLE 83 Global cold chain inorganics market by ammonia, 2017 - 2030 (USD Billion)
- TABLE 84 Global cold chain inorganics market by CO2, 2017 - 2030 (USD Billion)
- TABLE 85 Global cold chain packaging material market by refrigerants, 2017 - 2030 (USD Billion)
- TABLE 86 Global storage equipment market by region, 2017 - 2030 (USD Billion)
- TABLE 87 Global cold chain storage equipment market, by on-grid, 2017 - 2030 (USD Billion)
- TABLE 88 Global cold chain storage equipment market, by on-grid, 2017 - 2030 (USD Billion)
- TABLE 89 Global cold chain storage equipment market, by off-grid, 2017 - 2030 (USD Billion)
- TABLE 90 Global cold chain storage equipment market, by off-grid, 2017 - 2030 (USD Billion)
- TABLE 91 Global transportation equipment market by region, 2017 - 2030 (USD Billion)
- TABLE 92 Global fruits & vegetables market by region, 2017 - 2030 (USD Billion)
- TABLE 93 Global fruit & pulp concentrates market by region, 2017 - 2030 (USD Billion)
- TABLE 94 Global dairy products market by region, 2017 - 2030 (USD Billion)
- TABLE 95 Global fish, meat, and seafood market by region, 2017 - 2030 (USD Billion)
- TABLE 96 Global processed food market by region, 2017 - 2030 (USD Billion)
- TABLE 97 Global pharmaceuticals market by region, 2017 - 2030 (USD Billion)
- TABLE 98 Global bakery & confectionaries market by region, 2017 - 2030 (USD Billion)
- TABLE 99 Global others market by region, 2017 - 2030 (USD Billion)
- TABLE 100 North America cold chain market, 2017 - 2030 (USD Billion)
- TABLE 101 North America cold chain market, 2017 - 2030 (USD Billion)
- TABLE 102 North America cold chain market, by type, 2017 - 2030 (USD Billion)
- TABLE 103 North America cold chain type market, by storage, 2017 - 2030 (USD Billion)
- TABLE 104 North America cold chain storage market, by warehouse, 2017 - 2030 (USD Billion)
- TABLE 105 North America cold chain type market, by transportation, 2017 - 2030 (USD Billion)
- TABLE 106 North America cold chain type market, by monitoring components, 2017 - 2030 (USD Billion)
- TABLE 107 North America cold chain monitoring components market, by hardware, 2017 - 2030 (USD Billion)
- TABLE 108 North America cold chain monitoring components market, by software, 2017 - 2030 (USD Billion)
- TABLE 109 North America cold chain market, by packaging, 2017 - 2030 (USD Billion)
- TABLE 110 North America cold chain packaging market, by product, 2017 - 2030 (USD Billion)
- TABLE 111 North America cold chain product market, by crates, 2017 - 2030 (USD Billion)
- TABLE 112 North America cold chain insulated container & boxes market, by payload size, 2017 - 2030 (USD Billion)
- TABLE 113 North America cold chain packaging market, by material, 2017 - 2030 (USD Billion)
- TABLE 114 North America cold chain material market, by insulating materials, 2017 - 2030 (USD Billion)
- TABLE 115 North America cold chain material market, by refrigerants, 2017 - 2030 (USD Billion)
- TABLE 116 North America cold chain refrigerants market, by inorganics, 2017 - 2030 (USD Billion)
- TABLE 117 North America cold chain market, by equipment, 2017 - 2030 (USD Billion)
- TABLE 118 North America cold chain equipment market, by storage equipment, 2017 - 2030 (USD Billion)
- TABLE 119 North America cold chain storage equipment market, by on-grid, 2017 - 2030 (USD Billion)
- TABLE 120 North America cold chain storage equipment market, by off-grid, 2017 - 2030 (USD Billion)
- TABLE 121 North America cold chain market, by application, 2017 - 2030 (USD Billion)
- TABLE 122 North America cold chain application market, by fruits & vegetables, 2017 - 2030 (USD Billion)
- TABLE 123 North America cold chain application market, by dairy products, 2017 - 2030 (USD Billion)
- TABLE 124 North America cold chain application market, by fish, meat & seafood, 2017 - 2030 (USD Billion)
- TABLE 125 North America cold chain application market, by processed food, 2017 - 2030 (USD Billion)
- TABLE 126 North America cold chain application market, by pharmaceutical, 2017 - 2030 (USD Billion)
- TABLE 127 U.S. cold chain market, 2017 - 2030 (USD Billion)
- TABLE 128 U.S. cold chain market, by type, 2017 - 2030 (USD Billion)
- TABLE 129 U.S. cold chain market, by equipment, 2017 - 2030 (USD Billion)
- TABLE 130 U.S. cold chain market, by packaging, 2017 - 2030 (USD Billion)
- TABLE 131 Canada cold chain market, 2017 - 2030 (USD Billion)
- TABLE 132 Canada cold chain market, by type, 2017 - 2030 (USD Billion)
- TABLE 133 Canada cold chain market, by equipment, 2017 - 2030 (USD Billion)
- TABLE 134 Canada cold chain market, by packaging, 2017 - 2030 (USD Billion)
- TABLE 135 Mexico cold chain market, 2017 - 2030 (USD Billion)
- TABLE 136 Mexico cold chain market, by type, 2017 - 2030 (USD Billion)
- TABLE 137 Mexico cold chain market, by packaging, 2017 - 2030 (USD Billion)
- TABLE 138 Mexico cold chain market, by equipment, 2017 - 2030 (USD Billion)
- TABLE 139 Asia Pacific cold chain market, 2017 - 2030 (USD Billion)
- TABLE 140 Asia Pacific cold chain market, 2017 - 2030 (USD Billion)
- TABLE 141 Asia Pacific cold chain market, by type, 2017 - 2030 (USD Billion)
- TABLE 142 Asia Pacific cold chain type market, by storage, 2017 - 2030 (USD Billion)
- TABLE 143 Asia Pacific cold chain storage market, by warehouse, 2017 - 2030 (USD Billion)
- TABLE 144 Asia Pacific cold chain type market, by transportation, 2017 - 2030 (USD Billion)
- TABLE 145 Asia Pacific cold chain type market, by monitoring components, 2017 - 2030 (USD Billion)
- TABLE 146 Asia Pacific cold chain monitoring components market, by hardware, 2017 - 2030 (USD Billion)
- TABLE 147 Asia Pacific cold chain monitoring components market, by software, 2017 - 2030 (USD Billion)
- TABLE 148 Asia Pacific cold chain market, by packaging, 2017 - 2030 (USD Billion)
- TABLE 149 Asia Pacific cold chain packaging market, by product, 2017 - 2030 (USD Billion)
- TABLE 150 Asia Pacific cold chain product market, by crates, 2017 - 2030 (USD Billion)
- TABLE 151 Asia Pacific cold chain insulated container & boxes market, by payload size, 2017 - 2030 (USD Billion)
- TABLE 152 Asia Pacific cold chain packaging market, by material, 2017 - 2030 (USD Billion)
- TABLE 153 Asia Pacific cold chain material market, by insulating materials, 2017 - 2030 (USD Billion)
- TABLE 154 Asia Pacific cold chain material market, by refrigerants, 2017 - 2030 (USD Billion)
- TABLE 155 Asia Pacific cold chain refrigerants market, by inorganics, 2017 - 2030 (USD Billion)
- TABLE 156 Asia Pacific cold chain market, by equipment, 2017 - 2030 (USD Billion)
- TABLE 157 Asia Pacific cold chain equipment market, by storage equipment, 2017 - 2030 (USD Billion)
- TABLE 158 Asia Pacific cold chain storage equipment market, by on-grid, 2017 - 2030 (USD Billion)
- TABLE 159 Asia Pacific cold chain storage equipment market, by off-grid, 2017 - 2030 (USD Billion)
- TABLE 160 Asia Pacific cold chain market, by application, 2017 - 2030 (USD Billion)
- TABLE 161 Asia Pacific cold chain application market, by fruits & vegetables, 2017 - 2030 (USD Billion)
- TABLE 162 Asia Pacific cold chain application market, by dairy products, 2017 - 2030 (USD Billion)
- TABLE 163 Asia Pacific cold chain application market, by fish, meat & seafood, 2017 - 2030 (USD Billion)
- TABLE 164 Asia Pacific cold chain application market, by processed food, 2017 - 2030 (USD Billion)
- TABLE 165 Asia Pacific cold chain application market, by pharmaceutical, 2017 - 2030 (USD Billion)
- TABLE 166 China cold chain market, 2017 - 2030 (USD Billion)
- TABLE 167 China cold chain market, by type, 2017 - 2030 (USD Billion)
- TABLE 168 China cold chain market, by packaging, 2017 - 2030 (USD Billion)
- TABLE 169 China cold chain market, by equipment, 2017 - 2030 (USD Billion)
- TABLE 170 India cold chain market, 2017 - 2030 (USD Billion)
- TABLE 171 India cold chain market, by type, 2017 - 2030 (USD Billion)
- TABLE 172 India cold chain market, by packaging, 2017 - 2030 (USD Billion)
- TABLE 173 India cold chain market, by equipment, 2017 - 2030 (USD Billion)
- TABLE 174 Japan cold chain market, 2017 - 2030 (USD Billion)
- TABLE 175 Japan cold chain market, by type, 2017 - 2030 (USD Billion)
- TABLE 176 Japan cold chain market, by packaging, 2017 - 2030 (USD Billion)
- TABLE 177 Japan cold chain market, by equipment, 2017 - 2030 (USD Billion)
- TABLE 178 Singapore cold chain market, 2017 - 2030 (USD Billion)
- TABLE 179 Singapore cold chain market, by type, 2017 - 2030 (USD Billion)
- TABLE 180 Singapore cold chain market, by packaging, 2017 - 2030 (USD Billion)
- TABLE 181 Singapore cold chain market, by equipment, 2017 - 2030 (USD Billion)
- TABLE 182 South Korea cold chain market, 2017 - 2030 (USD Billion)
- TABLE 183 South Korea cold chain market, by type, 2017 - 2030 (USD Billion)
- TABLE 184 South Korea cold chain market, by packaging, 2017 - 2030 (USD Billion)
- TABLE 185 South Korea cold chain market, by equipment, 2017 - 2030 (USD Billion)
- TABLE 186 Europe cold chain market, 2017 - 2030 (USD Billion)
- TABLE 187 Europe cold chain market, 2017 - 2030 (USD Billion)
- TABLE 188 Europe cold chain market, by type, 2017 - 2030 (USD Billion)
- TABLE 189 Europe cold chain type market, by storage, 2017 - 2030 (USD Billion)
- TABLE 190 Europe cold chain storage market, by warehouse, 2017 - 2030 (USD Billion)
- TABLE 191 Europe cold chain type market, by transportation, 2017 - 2030 (USD Billion)
- TABLE 192 Europe cold chain type market, by monitoring components, 2017 - 2030 (USD Billion)
- TABLE 193 Europe cold chain monitoring components market, by hardware, 2017 - 2030 (USD Billion)
- TABLE 194 Europe cold chain monitoring components market, by software, 2017 - 2030 (USD Billion)
- TABLE 195 Europe cold chain market, by packaging, 2017 - 2030 (USD Billion)
- TABLE 196 Europe cold chain packaging market, by product, 2017 - 2030 (USD Billion)
- TABLE 197 Europe cold chain product market, by crates, 2017 - 2030 (USD Billion)
- TABLE 198 Europe cold chain insulated container & boxes market, by payload size, 2017 - 2030 (USD Billion)
- TABLE 199 Europe cold chain packaging market, by material, 2017 - 2030 (USD Billion)
- TABLE 200 Europe cold chain material market, by insulating materials, 2017 - 2030 (USD Billion)
- TABLE 201 Europe cold chain material market, by refrigerants, 2017 - 2030 (USD Billion)
- TABLE 202 Europe cold chain refrigerants market, by inorganics, 2017 - 2030 (USD Billion)
- TABLE 203 Europe cold chain market, by equipment, 2017 - 2030 (USD Billion)
- TABLE 204 Europe cold chain equipment market, by storage equipment, 2017 - 2030 (USD Billion)
- TABLE 205 Europe cold chain storage equipment market, by on-grid, 2017 - 2030 (USD Billion)
- TABLE 206 Europe cold chain storage equipment market, by off-grid, 2017 - 2030 (USD Billion)
- TABLE 207 Europe cold chain market, by application, 2017 - 2030 (USD Billion)
- TABLE 208 Europe cold chain application market, by fruits & vegetables, 2017 - 2030 (USD Billion)
- TABLE 209 Europe cold chain application market, by dairy products, 2017 - 2030 (USD Billion)
- TABLE 210 Europe cold chain application market, by fish, meat & seafood, 2017 - 2030 (USD Billion)
- TABLE 211 Europe cold chain application market, by processed food, 2017 - 2030 (USD Billion)
- TABLE 212 Europe cold chain application market, by pharmaceutical, 2017 - 2030 (USD Billion)
- TABLE 213 U.K. cold chain market, 2017 - 2030 (USD Billion)
- TABLE 214 U.K. cold chain market, by type, 2017 - 2030 (USD Billion)
- TABLE 215 U.K. cold chain market, by packaging, 2017 - 2030 (USD Billion)
- TABLE 216 U.K. cold chain market, by equipment, 2017 - 2030 (USD Billion)
- TABLE 217 Germany cold chain market, 2017 - 2030 (USD Billion)
- TABLE 218 Germany cold chain market, by type, 2017 - 2030 (USD Billion)
- TABLE 219 Germany cold chain market, by packaging, 2017 - 2030 (USD Billion)
- TABLE 220 Germany cold chain market, by equipment, 2017 - 2030 (USD Billion)
- TABLE 221 France cold chain market, 2017 - 2030 (USD Billion)
- TABLE 222 France cold chain market, by type, 2017 - 2030 (USD Billion)
- TABLE 223 France cold chain market, by packaging, 2017 - 2030 (USD Billion)
- TABLE 224 France cold chain market, by equipment, 2017 - 2030 (USD Billion)
- TABLE 225 Italy cold chain market, 2017 - 2030 (USD Billion)
- TABLE 226 Italy cold chain market, by type, 2017 - 2030 (USD Billion)
- TABLE 227 Italy cold chain market, by packaging, 2017 - 2030 (USD Billion)
- TABLE 228 Italy cold chain market, by equipment, 2017 - 2030 (USD Billion)
- TABLE 229 Spain cold chain market, 2017 - 2030 (USD Billion)
- TABLE 230 Spain cold chain market, by type, 2017 - 2030 (USD Billion)
- TABLE 231 Spain cold chain market, by packaging, 2017 - 2030 (USD Billion)
- TABLE 232 Spain cold chain market, by equipment, 2017 - 2030 (USD Billion)
- TABLE 233 South America cold chain market, 2017 - 2030 (USD Billion)
- TABLE 234 South America cold chain market, 2017 - 2030 (USD Billion)
- TABLE 235 South America cold chain market, by type, 2017 - 2030 (USD Billion)
- TABLE 236 South America cold chain type market, by storage, 2017 - 2030 (USD Billion)
- TABLE 237 South America cold chain storage market, by warehouse, 2017 - 2030 (USD Billion)
- TABLE 238 South America cold chain type market, by transportation, 2017 - 2030 (USD Billion)
- TABLE 239 South America cold chain type market, by monitoring components, 2017 - 2030 (USD Billion)
- TABLE 240 South America cold chain monitoring components market, by hardware, 2017 - 2030 (USD Billion)
- TABLE 241 South America cold chain monitoring components market, by software, 2017 - 2030 (USD Billion)
- TABLE 242 South America cold chain market, by packaging, 2017 - 2030 (USD Billion)
- TABLE 243 South America cold chain packaging market, by product, 2017 - 2030 (USD Billion)
- TABLE 244 South America cold chain product market, by crates, 2017 - 2030 (USD Billion)
- TABLE 245 South America cold chain insulated container & boxes market, by payload size, 2017 - 2030 (USD Billion)
- TABLE 246 South America cold chain packaging market, by material, 2017 - 2030 (USD Billion)
- TABLE 247 South America cold chain material market, by insulating materials, 2017 - 2030 (USD Billion)
- TABLE 248 South America cold chain material market, by refrigerants, 2017 - 2030 (USD Billion)
- TABLE 249 South America cold chain refrigerants market, by inorganics, 2017 - 2030 (USD Billion)
- TABLE 250 South America cold chain market, by equipment, 2017 - 2030 (USD Billion)
- TABLE 251 South America cold chain equipment market, by storage equipment, 2017 - 2030 (USD Billion)
- TABLE 252 South America cold chain storage equipment market, by on-grid, 2017 - 2030 (USD Billion)
- TABLE 253 South America cold chain storage equipment market, by off-grid, 2017 - 2030 (USD Billion)
- TABLE 254 South America cold chain market, by application, 2017 - 2030 (USD Billion)
- TABLE 255 South America cold chain application market, by fruits & vegetables, 2017 - 2030 (USD Billion)
- TABLE 256 South America cold chain application market, by dairy products, 2017 - 2030 (USD Billion)
- TABLE 257 South America cold chain application market, by fish, meat & seafood, 2017 - 2030 (USD Billion)
- TABLE 258 South America cold chain application market, by processed food, 2017 - 2030 (USD Billion)
- TABLE 259 South America cold chain application market, by pharmaceutical, 2017 - 2030 (USD Billion)
- TABLE 260 Brazil cold chain market, 2017 - 2030 (USD Billion)
- TABLE 261 Brazil cold chain market, by type, 2017 - 2030 (USD Billion)
- TABLE 262 Brazil cold chain market, by packaging, 2017 - 2030 (USD Billion)
- TABLE 263 Brazil cold chain market, by equipment, 2017 - 2030 (USD Billion)
- TABLE 264 Middle East cold chain market, 2017 - 2030 (USD Billion)
- TABLE 265 Middle East cold chain storage market, by warehouse, 2017 - 2030 (USD Billion)
- TABLE 266 Middle East cold chain type market, by transportation, 2017 - 2030 (USD Billion)
- TABLE 267 Middle East cold chain type market, by monitoring components, 2017 - 2030 (USD Billion)
- TABLE 268 Middle East cold chain monitoring components market, by hardware, 2017 - 2030 (USD Billion)
- TABLE 269 Middle East cold chain monitoring components market, by software, 2017 - 2030 (USD Billion)
- TABLE 270 Middle East cold chain market, by packaging, 2017 - 2030 (USD Billion)
- TABLE 271 Middle East cold chain packaging market, by product, 2017 - 2030 (USD Billion)
- TABLE 272 Middle East cold chain product market, by crates, 2017 - 2030 (USD Billion)
- TABLE 273 Middle East cold chain insulated container & boxes market, by payload size, 2017 - 2030 (USD Billion)
- TABLE 274 Middle East cold chain packaging market, by material, 2017 - 2030 (USD Billion)
- TABLE 275 Middle East cold chain material market, by insulating materials, 2017 - 2030 (USD Billion)
- TABLE 276 Middle East cold chain material market, by refrigerants, 2017 - 2030 (USD Billion)
- TABLE 277 Middle East cold chain refrigerants market, by inorganics, 2017 - 2030 (USD Billion)
- TABLE 278 Middle East cold chain market, by equipment, 2017 - 2030 (USD Billion)
- TABLE 279 Middle East cold chain equipment market, by storage equipment, 2017 - 2030 (USD Billion)
- TABLE 280 Middle East cold chain storage equipment market, by on-grid, 2017 - 2030 (USD Billion)
- TABLE 281 Middle East cold chain storage equipment market, by off-grid, 2017 - 2030 (USD Billion)
- TABLE 282 Middle East cold chain market, by application, 2017 - 2030 (USD Billion)
- TABLE 283 Middle East cold chain application market, by fruits & vegetables, 2017 - 2030 (USD Billion)
- TABLE 284 Middle East cold chain application market, by dairy products, 2017 - 2030 (USD Billion)
- TABLE 285 Middle East cold chain application market, by fish, meat & seafood, 2017 - 2030 (USD Billion)
- TABLE 286 Middle East cold chain application market, by processed food, 2017 - 2030 (USD Billion)
- TABLE 287 Middle East cold chain application market, by pharmaceutical, 2017 - 2030 (USD Billion)
- TABLE 288 UAE cold chain market, 2017 - 2030 (USD Billion)
- TABLE 289 UAE cold chain market, by type, 2017 - 2030 (USD Billion)
- TABLE 290 UAE cold chain market, by equipment, 2017 - 2030 (USD Billion)
- TABLE 291 UAE cold chain market, by packaging, 2017 - 2030 (USD Billion)
- TABLE 292 Saudi Arabia cold chain market, 2017 - 2030 (USD Billion)
- TABLE 293 Saudi Arabia cold chain market, by type, 2017 - 2030 (USD Billion)
- TABLE 294 Saudi Arabia cold chain market, by equipment, 2017 - 2030 (USD Billion)
- TABLE 295 Saudi Arabia cold chain market, by packaging, 2017 - 2030 (USD Billion)
- TABLE 296 Israel cold chain market, 2017 - 2030 (USD Billion)
List of Figures
- FIG. 1 Market segmentation &scope
- FIG. 2 Cold chain market size and growth prospects (Revenue in USD Billion) 2017 - 2030
- FIG. 3 Cold chain market - Value chain analysis
- FIG. 4 Market dynamics
- FIG. 5 FDI inflow, by region, 2017 - 2020 (USD Billion)
- FIG. 6 Key opportunities prioritized
- FIG. 7 Porter's five forces analysis
- FIG. 8 Cold chain - PEST analysis
- FIG. 9 Cold chain market: Type analysis
- FIG. 10 Cold chain market: Packaging analysis
- FIG. 11 Cold chain market: Equipment analysis
- FIG. 12 Cold chain market: Application analysis
- FIG. 13 Regional marketplace: Key takeaways
- FIG. 14 Regional outlook, 2021 & 2030
Cold Chain Market Growth & Trends:
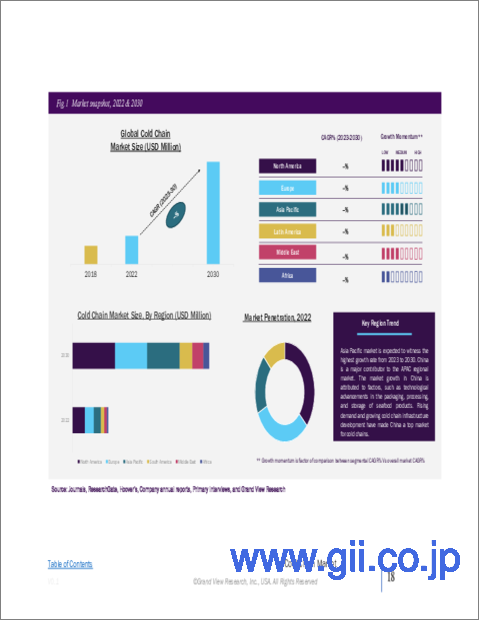
The global cold chain market is expected to reach USD 986.91 billion by 2030, registering a CAGR of 17.1%, according to a new report by Grand View Research, Inc. The retail sector in emerging economies, such as India and China, is getting more organized and this trend is expected to augment the demand for cold storage over the forecast period. Government policies to deregulate the entry of foreign companies have increased the Foreign Direct Investment (FDI) in the retail sectors of such regions.
Organized retail stores use better refrigeration and improved storage technology than traditional stores. Thus, consumers are increasingly purchasing frozen foods from these retail stores. With the increased demand for chilled and frozen foods and the rapidly expanding organized retail sector, the demand for cold storage solutions is expected to grow over the projected period. Organized retail supports different outlet formats depending on spending power and proximity to major residential and consumption clusters.
The offline mode of organized retailing is categorized into convenience stores, supermarkets, and hypermarkets based on product range and surface coverage. On the other hand, the lack of power hook-ups for reefer trailers at transportation hubs and ports coupled with the lack of reliable power supply for cold warehouses further increases the operating costs.
However, this also offers opportunities for companies to develop unique solutions or leverage alternative energy sources that can overcome these issues in emerging markets. Furthermore, new transportation means, such as versatile refrigerated containers, are being developed to overcome the lack of adequate transportation facilities. These solutions can provide access to international markets and offer opportunities for farmers and small-scale businesses in these regions.
Cold Chain Market Report Highlights:
- Low carbon design, environmental auditing, and construction of energy-efficient cold storage warehouses are anticipated to fuel the demand for cold storage.
- Growing supermarket shopping culture and rising consumer preference toward private labels are the key factors for the expansion of food retail chains across the globe.
- The cold packs segment is anticipated to register a CAGR of 21.0%. The growth is attributed to the significant changes in the living standards and food consumption behavior of consumers.
- The processed food application is anticipated to witness a high CAGR of 19.1% over the projected period.
- The primary source markets for cold chain are the U.S., Canada, Germany, China, the U.K., India, France, Japan, and South Korea. The U.S. will be the primary source market for cold chain providers.
- The market in Japan is becoming increasingly saturated, resulting in cold storage operators in the country seeking avenues to enhance international trade.
- Key players in the market include Americold Logistics LLC, Agro Merchant Group, Burris Logistics, Inc., Henningsen Cold Storage Company, Lineage Logistics, LLC, Nordic Logistics, Preferred Freezer, Wabash National, Cold Chain Technologies, Inc., Cryopak Industries Inc., Creopack, Cold Box Express, Inc., Intelsius, Nilkamal Limited, Sofrigam, Softbox Systems Ltd., Sonoco ThermoSafe, Valor Industries, and va Q tec AG.
Table of Contents
Chapter 1. Methodology and Scope
- 1.1. Research Methodology
- 1.2. Research Scope and Assumptions
- 1.3. List of Data Sources
- 1.4. List of Abbreviations
Chapter 2. Executive Summary
- 2.1. Key Market Trends
- 2.1.1. Expansion of food retail chains
- 2.1.2. Implications of CO2/NH3 cascade refrigeration system
- 2.1.3. Environmental impact of refrigerants
- 2.1.4. Cost and risk reduction strategies in pharmaceutical cold chain distribution
- 2.1.5. Internet of Things (IoT) in pharmaceutical supply chains
- 2.2. Key Country Trends
- 2.2.1. China
- 2.2.1.1. E-commerce industry trends in China
- 2.2.1.2. Effects of e-commerce on the Chinese seafood market
- 2.2.1.3. Impact of food and beverage e-commerce on the supply chain
- 2.2.1.4. Initiatives by online retail giants to upgrade cold chain systems
- 2.2.1.5. Business models for fresh food produce e-commerce in China
- 2.2.1.5.1. Integrated B2C e-commerce marketplace
- 2.2.1.5.2. Vertical B2C e-commerce platform
- 2.2.1.5.3. E-commerce platform operated by logistics companies
- 2.2.1.5.4. O2O model operated by supermarkets
- 2.2.1.5.5. Community O2O model
- 2.2.1.6. Fresh produce e-commerce in China-Factors for increased losses
- 2.2.1.6.1. Factors to overcome challenges involved in fresh produce e-commerce
- 2.2.1.6.2. Fresh produce e-commerce - Cold chain logistics requirements
- 2.2.2. Singapore
- 2.2.3. India
- 2.2.3.1. Government initiatives
- 2.2.4. Japan
- 2.2.5. U.S.
- 2.2.6. China
- 2.2.7. Brazil
- 2.2.1. China
- 2.3. Cold Chain-Industry Snapshot & Key Buying Criteria, 2017 - 2030
- 2.3.1. Global cold chain market, 2017 - 2030
- 2.3.2. Cold chain type outlook (Revenue, USD Billion; 2017 - 2030)
- 2.3.2.1. Storage
- 2.3.2.2. Transportation
- 2.3.2.3. Monitoring components
- 2.3.3. Cold chain packaging outlook (Revenue, USD Million; 2017 - 2030)
- 2.3.3.1. Product
- 2.3.3.2. Materials
- 2.3.4. Cold chain equipment outlook (Revenue, USD Million; 2017 - 2030)
- 2.3.5. Cold chain application outlook (Revenue, USD Million; 2017 - 2030)
- 2.3.5.1. Dairy products
- 2.3.5.2. Pharmaceuticals
- 2.3.5.3. Bakery & confectionary
- 2.3.5.4. Processed food
- 2.3.5.5. Fish, meat, and seafood
- 2.3.5.6. Fruits & vegetables
- 2.3.5.7. Fruit pulp & concentrates
- 2.3.5.8. Others (ready-to-cook, poultry)
Chapter 3. Market Variables, Trends, & Scope Outlook
- 3.1. Market Segmentation & Scope
- 3.2. Cold Chain Market Size & Growth Prospects
- 3.3. Cold Chain Market - Value Chain Analysis
- 3.4. Cold Chain Market Dynamics
- 3.4.1. Refrigerants market analysis
- 3.4.2. Market driver analysis
- 3.4.3. Market restraints analysis
- 3.4.4. Market opportunity analysis
- 3.4.5. Market challenge analysis
- 3.5. Key Opportunities-Prioritized
- 3.6. List of Key Players with Cold Storage Capacity - 2021
- 3.7. Regulatory Framework for Chilled and Frozen Food
- 3.7.1. The U.S.
- 3.7.2. Canada
- 3.7.3. Germany
- 3.7.4. The U.K.
- 3.7.5. India
- 3.7.6. China
- 3.7.7. Netherlands
- 3.7.8. Norway
- 3.7.9. Singapore
- 3.7.10. Japan
- 3.8. Cold Chain Market - Porter's Five Forces Analysis
- 3.8.1. Supplier power
- 3.8.2. Buyer power
- 3.8.3. Substitution threat
- 3.8.4. Threat from new entrant
- 3.8.5. Competitive rivalry
- 3.9. Cold Chain Market - PEST Analysis
- 3.9.1. Political landscape
- 3.9.2. Economic landscape
- 3.9.3. Social landscape
- 3.9.4. Technology landscape
- 3.10. COVID-19 Impact Analysis
Chapter 4. Cold Chain Market Type Outlook
- 4.1. Cold Chain Market, By Type Analysis & Market Share, 2021 & 2030
- 4.2. Storage
- 4.2.1. Warehouses
- 4.2.1.1. On-grid
- 4.2.1.2. Off-grid
- 4.2.2. Reefer container
- 4.2.1. Warehouses
- 4.3. Transportation
- 4.3.1. Road
- 4.3.2. Sea
- 4.3.3. Rail
- 4.3.4. Air
- 4.4. Monitoring components
- 4.4.1. Hardware
- 4.4.1.1. Sensors
- 4.4.1.2. RFID devices
- 4.4.1.3. Telematics
- 4.4.1.4. Networking devices
- 4.4.2. Software
- 4.4.2.1. On-premise
- 4.4.2.2. Cloud-based
- 4.4.1. Hardware
Chapter 5. Cold Chain Market Packaging Outlook
- 5.1. Cold Chain Market, By Packaging Analysis & Market Share, 2021 & 2030
- 5.2. Product
- 5.2.1. Crates
- 5.2.1.1. Dairy
- 5.2.1.2. Pharmaceuticals
- 5.2.1.3. Fishery
- 5.2.1.4. Horticulture
- 5.2.2. Insulated containers & boxes
- 5.2.2.1. Payload size
- 5.2.2.1.1. Large (32 to 66 liters)
- 5.2.2.1.2. Medium (21 to 29 liters)
- 5.2.2.1.3. Small (10 to 17 liters)
- 5.2.2.1.4. X-small (3 to 8 liters)
- 5.2.2.1.5. Petite (0.9 to 2.7 liters)
- 5.2.2.2. Type
- 5.2.2.2.1. Cold Chain Bags/Vaccine Bags
- 5.2.2.2.2. Corrugated Boxes
- 5.2.2.2.3. Others
- 5.2.3. Cold Packs
- 5.2.4. Labels
- 5.2.5. Temperature-controlled Pallet Shippers
- 5.2.1. Crates
- 5.3. Materials
- 5.3.1. Insulating Materials
- 5.3.1.1. EPS
- 5.3.1.2. PUR
- 5.3.1.3. VIP
- 5.3.1.4. Cryogenic Tanks
- 5.3.1.5. Others
- 5.3.2. Insulating Materials
- 5.3.2.1. Fluorocarbons
- 5.3.2.1.1. Inorganics
- 5.3.2.1.2. Ammonia
- 5.3.2.2. CO2
- 5.3.2.3. Hydrocarbons
- 5.3.1. Insulating Materials
Chapter 6. Cold Chain Market Equipment Outlook
- 6.1. Cold Chain Market, By Equipment Analysis & Market Share, 2021 & 2030
- 6.2. Storage Equipment
- 6.2.1. On-grid
- 6.2.2. Off-grid
- 6.3. Transportation Equipment
Chapter 7. Cold Chain Market Application Outlook
- 7.1. Cold Chain Market, By Application Analysis & Market Share, 2021 & 2030
- 7.2. Fruits & vegetables
- 7.3. Fruits pulp & concentrates
- 7.4. Dairy products
- 7.5. Fish, meat, and seafood
- 7.6. Processed food
- 7.7. Pharmaceuticals
- 7.8. Bakery & confectionary
- 7.9. Others
Chapter 8. Cold Chain Market: Regional Estimates & Trend Analysis
- 8.1. Cold Chain Market Share by Region, 2021 & 2030
- 8.2. North America Cold Chain Market, 2017 - 2030
- 8.2.1. U.S. Cold Chain Market, 2017 - 2030
- 8.2.2. Canada Cold Chain Market, 2017 - 2030
- 8.2.3. Mexico Cold Chain Market, 2017 - 2030
- 8.3. Europe Cold Chain Market, 2017 - 2030
- 8.3.1. U.K. Cold Chain Market, 2017 - 2030
- 8.3.2. Germany Cold Chain Market, 2017 - 2030
- 8.3.3. France Cold Chain Market, 2017 - 2030
- 8.3.4. Italy Cold Chain Market, 2017 - 2030
- 8.3.5. Spain Cold Chain Market, 2017 - 2030
- 8.4. Asia Pacific Cold Chain Market, 2017 - 2030
- 8.4.1. China Cold Chain Market, 2017 - 2030
- 8.4.2. India Cold Chain Market, 2017 - 2030
- 8.4.3. Japan Cold Chain Market, 2017 - 2030
- 8.4.4. Singapore Cold Chain Market, 2017 - 2030
- 8.4.5. South Korea Cold Chain Market, 2017 - 2030
- 8.5. South America Cold Chain Market, 2017 - 2030
- 8.5.1. Brazil Cold Chain Market, 2017 - 2030
- 8.6. Middle East Cold Chain Market, 2017 - 2030
- 8.6.1. UAE Cold Chain Market, 2017 - 2030
- 8.6.2. Saudi Arabia Cold Chain Market, 2017 - 2030
- 8.6.3. Israel Cold Chain Market, 2017 - 2030
- 8.7. Africa Cold Chain Market, 2017 - 2030
- 8.7.1. South Africa Cold Chain Market, 2017 - 2030
- 8.7.2. Nigeria Cold Chain Market, 2017 - 2030
- 8.7.3. Egypt Cold Chain Market, 2017 - 2030
- 8.7.4. Kenya Cold Chain Market, 2017 - 2030
Chapter 9. Competitive Analysis
- 9.1. Recent Developments and Impact Analysis, by Key Market Participants
- 9.2. Company/Competition Categorization (Key Innovators, Market Leaders, Emerging, Niche Players)
- 9.3. Vendor Landscape
- 9.3.1. Key company market share analysis, 2021
- 9.4. Company Analysis Tools
- 9.4.1. Market Position Analysis
- 9.4.2. Competitive Dashboard Analysis
Chapter 10. Competitive Landscape
- 10.1. Company Profiles
- 10.1.1. Americold Logistics LLC
- 10.1.1.1. Company overview
- 10.1.1.2. Financial performance
- 10.1.1.3. Type benchmarking
- 10.1.1.4. Strategic initiatives
- 10.1.2. Agro Merchant Group
- 10.1.2.1. Company overview
- 10.1.2.2. Financial performance
- 10.1.2.3. Type benchmarking
- 10.1.2.4. Strategic initiatives
- 10.1.3. Burris Logistics, Inc.
- 10.1.3.1. Company overview
- 10.1.3.2. Financial performance
- 10.1.3.3. Type benchmarking
- 10.1.3.4. Strategic initiatives
- 10.1.4. Henningsen Cold Storage Company
- 10.1.4.1. Company overview
- 10.1.4.2. Financial performance
- 10.1.4.3. Type benchmarking
- 10.1.4.4. Strategic initiatives
- 10.1.5. Lineage Logistics, LLC
- 10.1.5.1. Company overview
- 10.1.5.2. Financial performance
- 10.1.5.3. Type benchmarking
- 10.1.5.4. Strategic initiatives
- 10.1.6. Nordic Logistics
- 10.1.6.1. Company overview
- 10.1.6.2. Financial performance
- 10.1.6.3. Type benchmarking
- 10.1.6.4. Strategic initiatives
- 10.1.7. Preferred Freezer
- 10.1.7.1. Company overview
- 10.1.7.2. Financial performance
- 10.1.7.3. Type benchmarking
- 10.1.7.4. Strategic initiatives
- 10.1.8. Wabash National
- 10.1.8.1. Company overview
- 10.1.8.2. Financial performance
- 10.1.8.3. Type benchmarking
- 10.1.8.4. Strategic initiatives
- 10.1.1. Americold Logistics LLC
- 10.2. Company Profiles: Packaging solutions companies
- 10.2.1. Cold Chain Technologies, Inc.
- 10.2.1.1. Company overview
- 10.2.1.2. Financial performance
- 10.2.1.3. Type benchmarking
- 10.2.1.4. Strategic initiatives
- 10.2.2. Cryopak Industries Inc.
- 10.2.2.1. Company overview
- 10.2.2.2. Financial performance
- 10.2.2.3. Type benchmarking
- 10.2.2.4. Strategic initiatives
- 10.2.3. Creopack
- 10.2.3.1. Company overview
- 10.2.3.2. Financial performance
- 10.2.3.3. Type benchmarking
- 10.2.3.4. Strategic initiatives
- 10.2.4. Cold Box Express, Inc.
- 10.2.4.1. Company overview
- 10.2.4.2. Financial performance
- 10.2.4.3. Type benchmarking
- 10.2.4.4. Strategic initiatives
- 10.2.5. Intelsius
- 10.2.5.1. Company overview
- 10.2.5.2. Financial performance
- 10.2.5.3. Type benchmarking
- 10.2.5.4. Strategic initiatives
- 10.2.6. Nilkamal Limited
- 10.2.6.1. Company overview
- 10.2.6.2. Financial performance
- 10.2.6.3. Type benchmarking
- 10.2.6.4. Strategic initiatives
- 10.2.7. Sofrigam
- 10.2.7.1. Company overview
- 10.2.7.2. Financial performance
- 10.2.7.3. Type benchmarking
- 10.2.7.4. Strategic initiatives
- 10.2.8. Softbox Systems Ltd.
- 10.2.8.1. Company overview
- 10.2.8.2. Financial performance
- 10.2.8.3. Type benchmarking
- 10.2.8.4. Strategic initiatives
- 10.2.9. Sonoco ThermoSafe
- 10.2.9.1. Company overview
- 10.2.9.2. Financial performance
- 10.2.9.3. Type benchmarking
- 10.2.9.4. Strategic initiatives
- 10.2.10. Valor Industries
- 10.2.10.1. Company overview
- 10.2.10.2. Financial performance
- 10.2.10.3. Type benchmarking
- 10.2.10.4. Strategic initiatives
- 10.2.11. va Q tec AG
- 10.2.11.1. Company overview
- 10.2.11.2. Financial performance
- 10.2.11.3. Type benchmarking
- 10.2.11.4. Strategic initiatives
- 10.2.1. Cold Chain Technologies, Inc.