|
|
市場調査レポート
商品コード
1280593
浮遊式ソーラーパネルの世界市場Floating Solar Panels |
||||||
|
|
|||||||


| 浮遊式ソーラーパネルの世界市場 |
|
出版日: 2023年01月01日
発行: Global Industry Analysts, Inc.
ページ情報: 英文 189 Pages
納期: 即日から翌営業日
|
- 全表示
- 概要
- 目次
浮遊式ソーラーパネルの世界市場は2030年に1万8,700MWに達する
変化したCOVID-19後のビジネス環境において、2022年に2,600MWと推定される浮遊式ソーラーパネルの世界市場は、2030年には1万8,700MWに達し、分析期間2022-2030年に28.1%のCAGRで成長すると予測しています。本レポートで分析したセグメントの1つである定置型は、CAGR25.5%を記録し、分析期間終了時には2,800MWに達すると予測されます。
米国市場は67MWと推定され、中国はCAGR26.2%で成長する見通し
米国の浮遊式ソーラーパネル市場は、2022年には67MWになると推定されています。世界第2位の経済大国である中国は、2022年から2030年にかけてCAGR26.2%で成長し、2030年までに5,800MWの市場規模に達すると予測されます。その他の注目すべき地域市場としては、アジア太平洋と欧州があり、2022年から2030年にかけてそれぞれ31.1%と24.2%で成長すると予測されています。
調査対象企業の例
- Kyocera Corporation
- Bharat Heavy Electricals Ltd.
- First Solar, Inc.
- Jain Irrigation Systems Ltd.
- NTPC Ltd.
- Tata Group
- JA Solar Technology Co., Ltd.
- Sungrow Power Supply Co., Ltd.
- Ciel & Terre International
- Jakson Group
- LONGi Solar Technology Co., Ltd.
- GCL System Integration Technology Company Ltd.
- LA Solar Group
- Glint Solar
- Conrexx Technology
目次
第1章 調査手法
第2章 エグゼクティブサマリー
- 市場概要
- 主要企業
- 市場動向と促進要因
- 世界市場の見通し
第3章 市場分析
- 米国
- 中国
- 欧州
- オランダ
- その他欧州
- アジア太平洋
- インド
- 韓国
- 台湾
- その他アジア太平洋地域
- 世界のその他の地域
第4章 競合
Looking Ahead to 2023
The global economy is at a critical crossroads with a number of interlocking challenges and crises running in parallel. The uncertainty around how Russia`s war on Ukraine will play out this year and the war`s role in creating global instability means that the trouble on the inflation front is not over yet. Food and fuel inflation will remain a persistent economic problem. Higher retail inflation will impact consumer confidence and spending. As governments combat inflation by raising interest rates, new job creation will slowdown and impact economic activity and growth. Lower capital expenditure is in the offing as companies go slow on investments, held back by inflation worries and weaker demand. With slower growth and high inflation, developed markets seem primed to enter into a recession. Fears of new COVID outbreaks and China's already uncertain post-pandemic path poses a real risk of the world experiencing more acute supply chain pain and manufacturing disruptions this year. Volatile financial markets, growing trade tensions, stricter regulatory environment and pressure to mainstream climate change into economic decisions will compound the complexity of challenges faced. Year 2023 is expected to be tough year for most markets, investors and consumers. Nevertheless, there is always opportunity for businesses and their leaders who can chart a path forward with resilience and adaptability.
Global Floating Solar Panels Market to Reach 18.7 Thousand MW by 2030
In the changed post COVID-19 business landscape, the global market for Floating Solar Panels estimated at 2.6 Thousand MW in the year 2022, is projected to reach a revised size of 18.7 Thousand MW by 2030, growing at a CAGR of 28.1% over the analysis period 2022-2030. Stationary, one of the segments analyzed in the report, is projected to record a 25.5% CAGR and reach 2.8 Thousand MW by the end of the analysis period.
The U.S. Market is Estimated at 67 MW, While China is Forecast to Grow at 26.2% CAGR
The Floating Solar Panels market in the U.S. is estimated at 67 MW in the year 2022. China, the world`s second largest economy, is forecast to reach a projected market size of 5.8 Thousand MW by the year 2030 trailing a CAGR of 26.2% over the analysis period 2022 to 2030. Among the other noteworthy geographic markets are Asia-Pacific and Europe, each forecast to grow at 31.1% and 24.2% respectively over the 2022-2030 period.
Select Competitors (Total 43 Featured) -
- Kyocera Corporation
- Bharat Heavy Electricals Ltd.
- First Solar, Inc.
- Jain Irrigation Systems Ltd.
- NTPC Ltd.
- Tata Group
- JA Solar Technology Co., Ltd.
- Sungrow Power Supply Co., Ltd.
- Ciel & Terre International
- Jakson Group
- LONGi Solar Technology Co., Ltd.
- GCL System Integration Technology Company Ltd.
- LA Solar Group
- Glint Solar
- Conrexx Technology
TABLE OF CONTENTS
I. METHODOLOGY
II. EXECUTIVE SUMMARY
- 1. MARKET OVERVIEW
- The Race Between the Virus & Vaccines Intensifies. Amidst this Chaotic Battle, Where is the World Economy Headed?
- Progress on Vaccinations: Why Should Businesses Care?
- With IMF's Upward Revision of Global GDP Forecasts, Most Companies are Bullish about an Economic Comeback Despite a Continuing Pandemic
- A Strong Yet Exceedingly Patchy & Uncertain Recovery Shaped by New Variants Comes Into Play: World Economic Growth Projections (Real GDP, Annual % Change) for 2020 through 2022
- Easing Unemployment Levels in 2021 Although Moderate Will Infuse Hope for Industries Reliant on Consumer Discretionary Incomes: Global Number of Unemployed People (In Million) for Years 2019, 2020, 2021, and 2022
- How the Clean Technologies Industry is Impacted by the Pandemic & What's the New Normal?
- Global Clean Technologies Market Reset & Trajectory - Growth Outlook (In %) for Years 2019 through 2025
- A Green Recovery is On the Agenda for Most Countries Worldwide: The New Normal in Global Clean Technologies Market by Major Geographies Analyzed by Annual % Growth for Years 2019 through 2025
- COVID-19 Sharpens the Focus on the Environment
- What's In-Store for Renewable Resources?
- Recommendations for the Power & Energy Sector in the Post-Pandemic Era
- Floating Solar Panels - Global Key Competitors Percentage Market Share in 2022 (E)
- Competitive Market Presence - Strong/Active/Niche/Trivial for Players Worldwide in 2022 (E)
- Floating Photovoltaic (FPV) Systems: A Prelude
- An Introduction to Floating Solar Panels
- History and the Future
- Floating PVs: More Advantages over Land-Based Systems
- Global Market Prospects & Outlook
- Analysis by Type
- World Floating Solar Panels Market by Type (2021 & 2027): Percentage Breakdown of Demand for Stationary, and Tracking
- Regional Analysis
- World Floating Solar Panels Market - Geographic Regions Ranked by CAGR (Volume) for 2020-2027: China, Asia-Pacific, Europe, USA, and Rest of World
- Asia: The Juggernaut
- Japan: The Leader in Floating Solar Power Generation
- China Launches the World's Biggest Floating Solar Plant
- India Commissions the Country's Largest Floating Solar Power Plant
- Thailand's 'Largest' Project is Up and Running
- The US Solar Power Industry Looking Up To FPVs
- Competitive Scenario
- Recent Market Activity
- 2. FOCUS ON SELECT PLAYERS
- 3. MARKET TRENDS & DRIVERS
- Floating Solar Panels Technology: Highly Efficient than Land Based Solar Plants
- Environmental Concerns and Floating Solar
- Domestic Targets for Greenhouse Gas Emissions of Select Regions/Countries
- Global CO2 Emissions: Percentage Breakdown of Volume Emissions by Fuel Type (2015, 2020, 2040 & 2050)
- Significance of Floating Solar Power Plants in Cooling Down Lakes in the face of Climate Change
- Floating Solar Panels and the Use of Reservoirs and Manmade Water Bodies
- Floating Solar System Plays Pivotal Role in Cleaning Water
- Offshore Floating Solar: A Potential Solar Energy Generation Medium in High Seas
- Growing Focus on Renewable Energy: A Strong Growth Driver
- Government Boost to Solar Energy Adoption to Spur Market Momentum
- Global Investments (US$ Billion) in Renewable Energy by Source: 2018
- Leading Countries with Renewable Energy as % of Total Energy
- Targets for Electricity Production from Renewable Energy Sources in Select Countries
- Estimated Global Power Generation Infrastructure Requirement (in US$ Billion) for China, India, Latin America, and North America over the Period 2010-2030
- Robust Demand for Electricity Closer to the Point of Consumption Drives Proliferation of FPVs
- Projected Global Demand for Electricity (MWh): 2015, 2020, 2025, 2030 & 2035
- Global Primary Energy Consumption (Billion toe): Growth Trajectory for the Period 1990-2040
- Global Energy Consumption (Billion toe) by Country/Region (1995, 2017 and 2040): Breakdown for USA, China, India, Russia, Brazil, EU, Middle East and Rest of World
- Microgrids and Distributed Generation Transform Electricity Management Forever
- Global Distributed Generation Capacity in Microgrids by Type (2021): Percentage Breakdown of Capacity Installations for Diesel Generators, Fuel cells, Natural Gas Generators, Small Wind Turbines, Solar PV Systems, and Others
- Distributed Generation Complemented with FPVs: Futuristic Enabler of Smart Cities
- Number of Smart Cities Worldwide by Geographic Region (2025E)
- Favorable Demographic and Urbanization Trends Strengthens Market Prospects
- World Population by Geographic Region (2000-2050) (in Millions)
- Rapid Urbanization: A Mega Growth Driver for Floating Solar Panels
- World Population Urbanization Rate (%) by Region/Country: 2016 & 2040
- Challenges and Issues
- Challenges Faced by Designers of Floating Solar Panels
- Installation of Floating PVs versus Other Photovoltaic Systems
- 4. GLOBAL MARKET PERSPECTIVE
- TABLE 1: World Recent Past, Current & Future Analysis for Floating Solar Panels by Geographic Region - USA, China, Europe, Asia-Pacific and Rest of World Markets - Independent Analysis of Annual Demand in MW for Years 2022 through 2030 and % CAGR
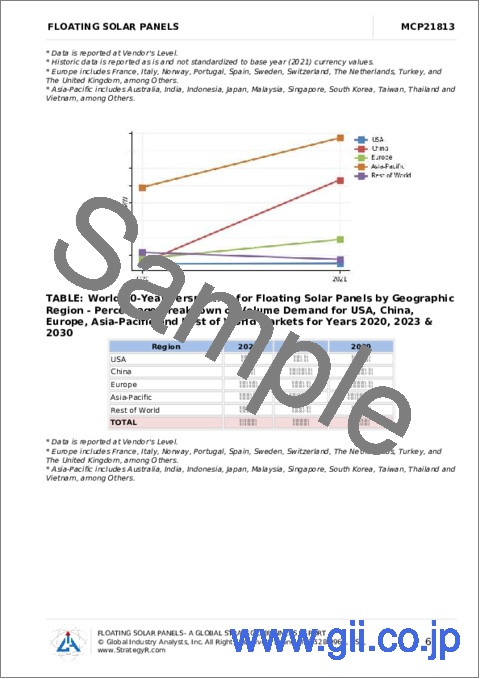
- TABLE 2: World 10-Year Perspective for Floating Solar Panels by Geographic Region - Percentage Breakdown of Volume Demand for USA, China, Europe, Asia-Pacific and Rest of World Markets for Years 2020, 2023 & 2030
- TABLE 3: World Recent Past, Current & Future Analysis for Stationary by Geographic Region - USA, China, Europe, Asia-Pacific and Rest of World Markets - Independent Analysis of Annual Demand in MW for Years 2022 through 2030 and % CAGR
- TABLE 4: World 10-Year Perspective for Stationary by Geographic Region - Percentage Breakdown of Volume Demand for USA, China, Europe, Asia-Pacific and Rest of World for Years 2020, 2023 & 2030
- TABLE 5: World Recent Past, Current & Future Analysis for Tracking by Geographic Region - USA, China, Europe, Asia-Pacific and Rest of World Markets - Independent Analysis of Annual Demand in MW for Years 2022 through 2030 and % CAGR
- TABLE 6: World 10-Year Perspective for Tracking by Geographic Region - Percentage Breakdown of Volume Demand for USA, China, Europe, Asia-Pacific and Rest of World for Years 2020, 2023 & 2030
- TABLE 7: World Floating Solar Panels Market Analysis of Annual Sales in MW for Years 2020 through 2030
- TABLE 8: World Historic Review for Floating Solar Panels by Geographic Region - USA, China, Europe, Asia-Pacific and Rest of World Markets - Independent Analysis of Annual Demand in MW for Years 2020 through 2021 and % CAGR
- TABLE 9: World Historic Review for Stationary by Geographic Region - USA, China, Europe, Asia-Pacific and Rest of World Markets - Independent Analysis of Annual Demand in MW for Years 2020 through 2021 and % CAGR
- TABLE 10: World Historic Review for Tracking by Geographic Region - USA, China, Europe, Asia-Pacific and Rest of World Markets - Independent Analysis of Annual Demand in MW for Years 2020 through 2021 and % CAGR
III. MARKET ANALYSIS
- UNITED STATES
- Floating Solar Panels Market Presence - Strong/Active/Niche/Trivial - Key Competitors in the United States for 2023 (E)
- TABLE 11: USA Recent Past, Current & Future Analysis for Floating Solar Panels by Type - Stationary and Tracking - Independent Analysis of Annual Demand in MW for the Years 2022 through 2030 and % CAGR
- TABLE 12: USA 10-Year Perspective for Floating Solar Panels by Type - Percentage Breakdown of Volume Demand for Stationary and Tracking for the Years 2020, 2023 & 2030
- TABLE 13: USA Historic Review for Floating Solar Panels by Type - Stationary and Tracking Markets - Independent Analysis of Annual Demand in MW for Years 2020 through 2021 and % CAGR
- CHINA
- Floating Solar Panels Market Presence - Strong/Active/Niche/Trivial - Key Competitors in China for 2023 (E)
- TABLE 14: China Recent Past, Current & Future Analysis for Floating Solar Panels by Type - Stationary and Tracking - Independent Analysis of Annual Demand in MW for the Years 2022 through 2030 and % CAGR
- TABLE 15: China 10-Year Perspective for Floating Solar Panels by Type - Percentage Breakdown of Volume Demand for Stationary and Tracking for the Years 2020, 2023 & 2030
- TABLE 16: China Historic Review for Floating Solar Panels by Type - Stationary and Tracking Markets - Independent Analysis of Annual Demand in MW for Years 2020 through 2021 and % CAGR
- EUROPE
- Floating Solar Panels Market Presence - Strong/Active/Niche/Trivial - Key Competitors in Europe for 2023 (E)
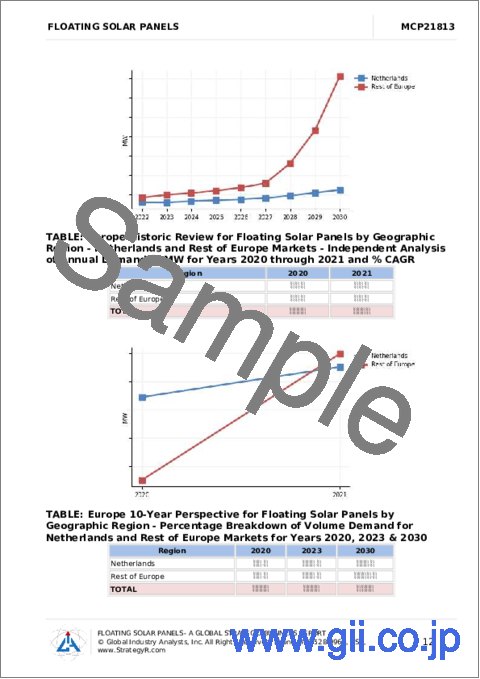
- TABLE 17: Europe Recent Past, Current & Future Analysis for Floating Solar Panels by Geographic Region - Netherlands and Rest of Europe Markets - Independent Analysis of Annual Demand in MW for Years 2022 through 2030 and % CAGR
- TABLE 18: Europe 10-Year Perspective for Floating Solar Panels by Geographic Region - Percentage Breakdown of Volume Demand for Netherlands and Rest of Europe Markets for Years 2020, 2023 & 2030
- TABLE 19: Europe Recent Past, Current & Future Analysis for Floating Solar Panels by Type - Stationary and Tracking - Independent Analysis of Annual Demand in MW for the Years 2022 through 2030 and % CAGR
- TABLE 20: Europe 10-Year Perspective for Floating Solar Panels by Type - Percentage Breakdown of Volume Demand for Stationary and Tracking for the Years 2020, 2023 & 2030
- TABLE 21: Europe Historic Review for Floating Solar Panels by Geographic Region - Netherlands and Rest of Europe Markets - Independent Analysis of Annual Demand in MW for Years 2020 through 2021 and % CAGR
- TABLE 22: Europe Historic Review for Floating Solar Panels by Type - Stationary and Tracking Markets - Independent Analysis of Annual Demand in MW for Years 2020 through 2021 and % CAGR
- NETHERLANDS
- TABLE 23: Netherlands Recent Past, Current & Future Analysis for Floating Solar Panels by Type - Stationary and Tracking - Independent Analysis of Annual Demand in MW for the Years 2022 through 2030 and % CAGR
- TABLE 24: Netherlands 10-Year Perspective for Floating Solar Panels by Type - Percentage Breakdown of Volume Demand for Stationary and Tracking for the Years 2020, 2023 & 2030
- TABLE 25: Netherlands Historic Review for Floating Solar Panels by Type - Stationary and Tracking Markets - Independent Analysis of Annual Demand in MW for Years 2020 through 2021 and % CAGR
- REST OF EUROPE
- TABLE 26: Rest of Europe Recent Past, Current & Future Analysis for Floating Solar Panels by Type - Stationary and Tracking - Independent Analysis of Annual Demand in MW for the Years 2022 through 2030 and % CAGR
- TABLE 27: Rest of Europe 10-Year Perspective for Floating Solar Panels by Type - Percentage Breakdown of Volume Demand for Stationary and Tracking for the Years 2020, 2023 & 2030
- TABLE 28: Rest of Europe Historic Review for Floating Solar Panels by Type - Stationary and Tracking Markets - Independent Analysis of Annual Demand in MW for Years 2020 through 2021 and % CAGR
- ASIA-PACIFIC
- Floating Solar Panels Market Presence - Strong/Active/Niche/Trivial - Key Competitors in Asia-Pacific for 2023 (E)
- TABLE 29: Asia-Pacific Recent Past, Current & Future Analysis for Floating Solar Panels by Geographic Region - India, South Korea, Taiwan and Rest of Asia-Pacific Markets - Independent Analysis of Annual Demand in MW for Years 2022 through 2030 and % CAGR
- TABLE 30: Asia-Pacific 10-Year Perspective for Floating Solar Panels by Geographic Region - Percentage Breakdown of Volume Demand for India, South Korea, Taiwan and Rest of Asia-Pacific Markets for Years 2020, 2023 & 2030
- TABLE 31: Asia-Pacific Recent Past, Current & Future Analysis for Floating Solar Panels by Type - Stationary and Tracking - Independent Analysis of Annual Demand in MW for the Years 2022 through 2030 and % CAGR
- TABLE 32: Asia-Pacific 10-Year Perspective for Floating Solar Panels by Type - Percentage Breakdown of Volume Demand for Stationary and Tracking for the Years 2020, 2023 & 2030
- TABLE 33: Asia-Pacific Historic Review for Floating Solar Panels by Geographic Region - India, South Korea, Taiwan and Rest of Asia-Pacific Markets - Independent Analysis of Annual Demand in MW for Years 2020 through 2021 and % CAGR
- TABLE 34: Asia-Pacific Historic Review for Floating Solar Panels by Type - Stationary and Tracking Markets - Independent Analysis of Annual Demand in MW for Years 2020 through 2021 and % CAGR
- INDIA
- Floating Solar Panels Market Presence - Strong/Active/Niche/Trivial - Key Competitors in India for 2023 (E)
- TABLE 35: India Recent Past, Current & Future Analysis for Floating Solar Panels by Type - Stationary and Tracking - Independent Analysis of Annual Demand in MW for the Years 2022 through 2030 and % CAGR
- TABLE 36: India 10-Year Perspective for Floating Solar Panels by Type - Percentage Breakdown of Volume Demand for Stationary and Tracking for the Years 2020, 2023 & 2030
- TABLE 37: India Historic Review for Floating Solar Panels by Type - Stationary and Tracking Markets - Independent Analysis of Annual Demand in MW for Years 2020 through 2021 and % CAGR
- SOUTH KOREA
- TABLE 38: South Korea Recent Past, Current & Future Analysis for Floating Solar Panels by Type - Stationary and Tracking - Independent Analysis of Annual Demand in MW for the Years 2022 through 2030 and % CAGR
- TABLE 39: South Korea 10-Year Perspective for Floating Solar Panels by Type - Percentage Breakdown of Volume Demand for Stationary and Tracking for the Years 2020, 2023 & 2030
- TABLE 40: South Korea Historic Review for Floating Solar Panels by Type - Stationary and Tracking Markets - Independent Analysis of Annual Demand in MW for Years 2020 through 2021 and % CAGR
- TAIWAN
- TABLE 41: Taiwan Recent Past, Current & Future Analysis for Floating Solar Panels by Type - Stationary and Tracking - Independent Analysis of Annual Demand in MW for the Years 2022 through 2030 and % CAGR
- TABLE 42: Taiwan 10-Year Perspective for Floating Solar Panels by Type - Percentage Breakdown of Volume Demand for Stationary and Tracking for the Years 2020, 2023 & 2030
- TABLE 43: Taiwan Historic Review for Floating Solar Panels by Type - Stationary and Tracking Markets - Independent Analysis of Annual Demand in MW for Years 2020 through 2021 and % CAGR
- REST OF ASIA-PACIFIC
- TABLE 44: Rest of Asia-Pacific Recent Past, Current & Future Analysis for Floating Solar Panels by Type - Stationary and Tracking - Independent Analysis of Annual Demand in MW for the Years 2022 through 2030 and % CAGR
- TABLE 45: Rest of Asia-Pacific 10-Year Perspective for Floating Solar Panels by Type - Percentage Breakdown of Volume Demand for Stationary and Tracking for the Years 2020, 2023 & 2030
- TABLE 46: Rest of Asia-Pacific Historic Review for Floating Solar Panels by Type - Stationary and Tracking Markets - Independent Analysis of Annual Demand in MW for Years 2020 through 2021 and % CAGR
- REST OF WORLD
- TABLE 47: Rest of World Recent Past, Current & Future Analysis for Floating Solar Panels by Type - Stationary and Tracking - Independent Analysis of Annual Demand in MW for the Years 2022 through 2030 and % CAGR
- TABLE 48: Rest of World 10-Year Perspective for Floating Solar Panels by Type - Percentage Breakdown of Volume Demand for Stationary and Tracking for the Years 2020, 2023 & 2030
- TABLE 49: Rest of World Historic Review for Floating Solar Panels by Type - Stationary and Tracking Markets - Independent Analysis of Annual Demand in MW for Years 2020 through 2021 and % CAGR