|
|
市場調査レポート
商品コード
1212200
スマート家具の世界市場Smart Furniture |
||||||
|
|
|||||||


| スマート家具の世界市場 |
|
出版日: 2023年01月01日
発行: Global Industry Analysts, Inc.
ページ情報: 英文 246 Pages
納期: 即日から翌営業日
|
- 全表示
- 概要
- 目次
世界のスマート家具の市場規模は、2022年の2億7,280万米ドルから、2030年には12億米ドルに達し、2022年~2030年にかけて19.8%のCAGRで成長すると予測されます。
当レポートでは、世界のスマート家具市場について調査分析し、市場動向と促進要因、見通し、地域分析、競合情勢などの情報を提供しています。
調査対象企業の例(全46社):
- Carlo Ratti Associati S.R.L
- Herman Miller Furniture (India) Pvt. Ltd.
- Inter IKEA Systems BV
- Steelcase Inc.
- StoreBound LLC
目次
第1章 調査手法
第2章 エグゼクティブサマリー
- 市場概要
- 主要企業
- 市場動向と促進要因
- 世界市場の見通し
第3章 市場分析
- 米国
- カナダ
- 日本
- 中国
- 欧州
- フランス
- ドイツ
- イタリア
- 英国
- その他欧州
- アジア太平洋地域
- その他の地域
第4章 競合
What`s New for 2023?
»Special coverage on Russia-Ukraine war; global inflation; easing of "zero-Covid" policy in China and its `bumpy` reopening; supply chain disruptions, global trade tensions; and risk of recession.
»Global competitiveness and key competitor percentage market shares
» Market presence across multiple geographies - Strong/Active/Niche/Trivial
»Online interactive peer-to-peer collaborative bespoke updates
»Access to our digital archives and MarketGlass Research Platform
»Complimentary updates for one year
Looking Ahead to 2023
The global economy is at a critical crossroads with a number of interlocking challenges and crises running in parallel. The uncertainty around how Russia`s war on Ukraine will play out this year and the war`s role in creating global instability means that the trouble on the inflation front is not over yet. Food and fuel inflation will remain a persistent economic problem. Higher retail inflation will impact consumer confidence and spending. As governments combat inflation by raising interest rates, new job creation will slowdown and impact economic activity and growth. Lower capital expenditure is in the offing as companies go slow on investments, held back by inflation worries and weaker demand. With slower growth and high inflation, developed markets seem primed to enter into a recession. Fears of new COVID outbreaks and China's already uncertain post-pandemic path poses a real risk of the world experiencing more acute supply chain pain and manufacturing disruptions this year. Volatile financial markets, growing trade tensions, stricter regulatory environment and pressure to mainstream climate change into economic decisions will compound the complexity of challenges faced. Year 2023 is expected to be tough year for most markets, investors and consumers. Nevertheless, there is always opportunity for businesses and their leaders who can chart a path forward with resilience and adaptability.
Global Smart Furniture Market to Reach $1.2 Billion by 2030
In the changed post COVID-19 business landscape, the global market for Smart Furniture estimated at US$272.8 Million in the year 2022, is projected to reach a revised size of US$1.2 Billion by 2030, growing at aCAGR of 19.8% over the period 2022-2030. Commercial, one of the segments analyzed in the report, is projected to record 23.1% CAGR and reach US$600.4 Million by the end of the analysis period. Taking into account the ongoing post pandemic recovery, growth in the Residential segment is readjusted to a revised 17% CAGR for the next 8-year period.
The U.S. Market is Estimated at $79.8 Million, While China is Forecast to Grow at 18.7% CAGR
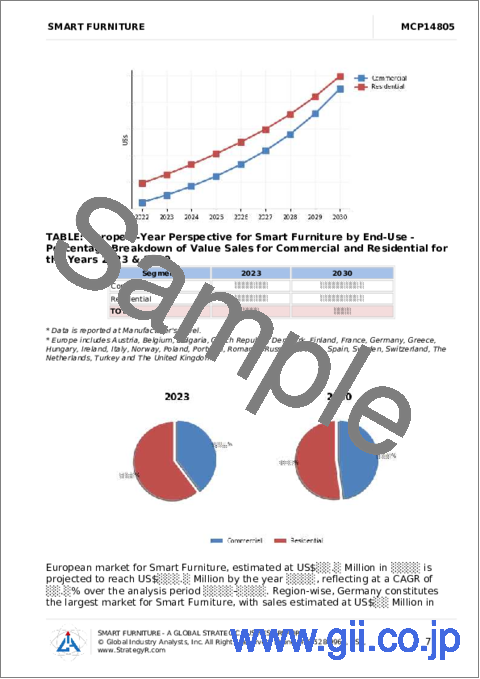
The Smart Furniture market in the U.S. is estimated at US$79.8 Million in the year 2022. China, the world`s second largest economy, is forecast to reach a projected market size of US$194.2 Million by the year 2030 trailing a CAGR of 18.7% over the analysis period 2022 to 2030. Among the other noteworthy geographic markets are Japan and Canada, each forecast to grow at 18.3% and 16.4% respectively over the 2022-2030 period. Within Europe, Germany is forecast to grow at approximately 13% CAGR.
Select Competitors (Total 46 Featured):
- Carlo Ratti Associati S.R.L
- Herman Miller Furniture (India) Pvt. Ltd.
- Inter IKEA Systems BV
- Steelcase Inc.
- StoreBound LLC
TABLE OF CONTENTS
I. METHODOLOGY
II. EXECUTIVE SUMMARY
- 1. MARKET OVERVIEW
- Influencer Market Insights
- World Market Trajectories
- Smart Furniture - Global Key Competitors Percentage Market Share in 2022 (E)
- Impact of Covid-19 and a Looming Global Recession
- Competitive Market Presence - Strong/Active/Niche/Trivial for Players Worldwide in 2022 (E)
- 2. FOCUS ON SELECT PLAYERS
- 3. MARKET TRENDS & DRIVERS
- 4. GLOBAL MARKET PERSPECTIVE
- TABLE 1: World Recent Past, Current & Future Analysis for Smart Furniture by Geographic Region - USA, Canada, Japan, China, Europe, Asia-Pacific and Rest of World Markets - Independent Analysis of Annual Sales in US$ for Years 2022 through 2030 and % CAGR
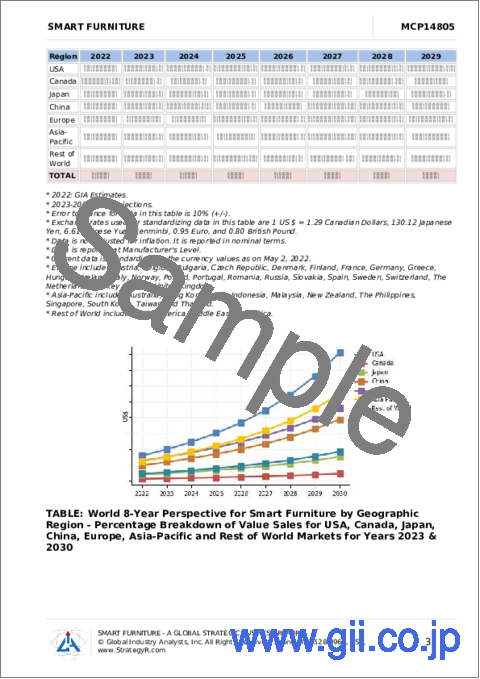
- TABLE 2: World 8-Year Perspective for Smart Furniture by Geographic Region - Percentage Breakdown of Value Sales for USA, Canada, Japan, China, Europe, Asia-Pacific and Rest of World Markets for Years 2023 & 2030
- TABLE 3: World Recent Past, Current & Future Analysis for Commercial by Geographic Region - USA, Canada, Japan, China, Europe, Asia-Pacific and Rest of World Markets - Independent Analysis of Annual Sales in US$ for Years 2022 through 2030 and % CAGR
- TABLE 4: World 8-Year Perspective for Commercial by Geographic Region - Percentage Breakdown of Value Sales for USA, Canada, Japan, China, Europe, Asia-Pacific and Rest of World for Years 2023 & 2030
- TABLE 5: World Recent Past, Current & Future Analysis for Residential by Geographic Region - USA, Canada, Japan, China, Europe, Asia-Pacific and Rest of World Markets - Independent Analysis of Annual Sales in US$ for Years 2022 through 2030 and % CAGR
- TABLE 6: World 8-Year Perspective for Residential by Geographic Region - Percentage Breakdown of Value Sales for USA, Canada, Japan, China, Europe, Asia-Pacific and Rest of World for Years 2023 & 2030
- TABLE 7: World Smart Furniture Market Analysis of Annual Sales in US$ for Years 2014 through 2030
III. MARKET ANALYSIS
- UNITED STATES
- Smart Furniture Market Presence - Strong/Active/Niche/Trivial - Key Competitors in the United States for 2023 (E)
- TABLE 8: USA Recent Past, Current & Future Analysis for Smart Furniture by End-Use - Commercial and Residential - Independent Analysis of Annual Sales in US$ for the Years 2022 through 2030 and % CAGR
- TABLE 9: USA 8-Year Perspective for Smart Furniture by End-Use - Percentage Breakdown of Value Sales for Commercial and Residential for the Years 2023 & 2030
- CANADA
- TABLE 10: Canada Recent Past, Current & Future Analysis for Smart Furniture by End-Use - Commercial and Residential - Independent Analysis of Annual Sales in US$ for the Years 2022 through 2030 and % CAGR
- TABLE 11: Canada 8-Year Perspective for Smart Furniture by End-Use - Percentage Breakdown of Value Sales for Commercial and Residential for the Years 2023 & 2030
- JAPAN
- Smart Furniture Market Presence - Strong/Active/Niche/Trivial - Key Competitors in Japan for 2023 (E)
- TABLE 12: Japan Recent Past, Current & Future Analysis for Smart Furniture by End-Use - Commercial and Residential - Independent Analysis of Annual Sales in US$ for the Years 2022 through 2030 and % CAGR
- TABLE 13: Japan 8-Year Perspective for Smart Furniture by End-Use - Percentage Breakdown of Value Sales for Commercial and Residential for the Years 2023 & 2030
- CHINA
- Smart Furniture Market Presence - Strong/Active/Niche/Trivial - Key Competitors in China for 2023 (E)
- TABLE 14: China Recent Past, Current & Future Analysis for Smart Furniture by End-Use - Commercial and Residential - Independent Analysis of Annual Sales in US$ for the Years 2022 through 2030 and % CAGR
- TABLE 15: China 8-Year Perspective for Smart Furniture by End-Use - Percentage Breakdown of Value Sales for Commercial and Residential for the Years 2023 & 2030
- EUROPE
- Smart Furniture Market Presence - Strong/Active/Niche/Trivial - Key Competitors in Europe for 2023 (E)
- TABLE 16: Europe Recent Past, Current & Future Analysis for Smart Furniture by Geographic Region - France, Germany, Italy, UK and Rest of Europe Markets - Independent Analysis of Annual Sales in US$ for Years 2022 through 2030 and % CAGR
- TABLE 17: Europe 8-Year Perspective for Smart Furniture by Geographic Region - Percentage Breakdown of Value Sales for France, Germany, Italy, UK and Rest of Europe Markets for Years 2023 & 2030
- TABLE 18: Europe Recent Past, Current & Future Analysis for Smart Furniture by End-Use - Commercial and Residential - Independent Analysis of Annual Sales in US$ for the Years 2022 through 2030 and % CAGR
- TABLE 19: Europe 8-Year Perspective for Smart Furniture by End-Use - Percentage Breakdown of Value Sales for Commercial and Residential for the Years 2023 & 2030
- FRANCE
- Smart Furniture Market Presence - Strong/Active/Niche/Trivial - Key Competitors in France for 2023 (E)
- TABLE 20: France Recent Past, Current & Future Analysis for Smart Furniture by End-Use - Commercial and Residential - Independent Analysis of Annual Sales in US$ for the Years 2022 through 2030 and % CAGR
- TABLE 21: France 8-Year Perspective for Smart Furniture by End-Use - Percentage Breakdown of Value Sales for Commercial and Residential for the Years 2023 & 2030
- GERMANY
- Smart Furniture Market Presence - Strong/Active/Niche/Trivial - Key Competitors in Germany for 2023 (E)
- TABLE 22: Germany Recent Past, Current & Future Analysis for Smart Furniture by End-Use - Commercial and Residential - Independent Analysis of Annual Sales in US$ for the Years 2022 through 2030 and % CAGR
- TABLE 23: Germany 8-Year Perspective for Smart Furniture by End-Use - Percentage Breakdown of Value Sales for Commercial and Residential for the Years 2023 & 2030
- ITALY
- TABLE 24: Italy Recent Past, Current & Future Analysis for Smart Furniture by End-Use - Commercial and Residential - Independent Analysis of Annual Sales in US$ for the Years 2022 through 2030 and % CAGR
- TABLE 25: Italy 8-Year Perspective for Smart Furniture by End-Use - Percentage Breakdown of Value Sales for Commercial and Residential for the Years 2023 & 2030
- UNITED KINGDOM
- Smart Furniture Market Presence - Strong/Active/Niche/Trivial - Key Competitors in the United Kingdom for 2023 (E)
- TABLE 26: UK Recent Past, Current & Future Analysis for Smart Furniture by End-Use - Commercial and Residential - Independent Analysis of Annual Sales in US$ for the Years 2022 through 2030 and % CAGR
- TABLE 27: UK 8-Year Perspective for Smart Furniture by End-Use - Percentage Breakdown of Value Sales for Commercial and Residential for the Years 2023 & 2030
- REST OF EUROPE
- TABLE 28: Rest of Europe Recent Past, Current & Future Analysis for Smart Furniture by End-Use - Commercial and Residential - Independent Analysis of Annual Sales in US$ for the Years 2022 through 2030 and % CAGR
- TABLE 29: Rest of Europe 8-Year Perspective for Smart Furniture by End-Use - Percentage Breakdown of Value Sales for Commercial and Residential for the Years 2023 & 2030
- ASIA-PACIFIC
- Smart Furniture Market Presence - Strong/Active/Niche/Trivial - Key Competitors in Asia-Pacific for 2023 (E)
- TABLE 30: Asia-Pacific Recent Past, Current & Future Analysis for Smart Furniture by End-Use - Commercial and Residential - Independent Analysis of Annual Sales in US$ for the Years 2022 through 2030 and % CAGR
- TABLE 31: Asia-Pacific 8-Year Perspective for Smart Furniture by End-Use - Percentage Breakdown of Value Sales for Commercial and Residential for the Years 2023 & 2030
- REST OF WORLD
- TABLE 32: Rest of World Recent Past, Current & Future Analysis for Smart Furniture by End-Use - Commercial and Residential - Independent Analysis of Annual Sales in US$ for the Years 2022 through 2030 and % CAGR
- TABLE 33: Rest of World 8-Year Perspective for Smart Furniture by End-Use - Percentage Breakdown of Value Sales for Commercial and Residential for the Years 2023 & 2030