|
|
市場調査レポート
商品コード
1164832
電子セラミックスの世界市場 - 製品別、エンドユーザー別の市場規模、業界分析、地域の見通し、用途開発可能性、価格動向、競合市場シェア、予測(2023年~2032年)Electronic Ceramics Market Size, By Product, By End-user, Industry Analysis Report, Regional Outlook, Application Development Potential, Price Trends, Competitive Market Share & Forecast, 2023 - 2032 |
||||||
|
|
|||||||
|
● お客様のご希望に応じて、既存データの加工や未掲載情報(例:国別セグメント)の追加などの対応が可能です。 詳細はお問い合わせください。 |
|||||||


| 電子セラミックスの世界市場 - 製品別、エンドユーザー別の市場規模、業界分析、地域の見通し、用途開発可能性、価格動向、競合市場シェア、予測(2023年~2032年) |
|
出版日: 2022年11月24日
発行: Global Market Insights Inc.
ページ情報: 英文 350 Pages
納期: 2~3営業日
|
- 全表示
- 概要
- 図表
- 目次
世界の電子セラミックス市場は、最終用途市場からの需要の増加により、2032年まで急激に拡大すると予測されています。
当レポートでは、世界の電子セラミックス市場について調査分析し、業界の考察、セグメント分析、地域分析、企業プロファイルなどを提供しています。
目次
第1章 調査手法と範囲
第2章 エグゼクティブサマリー
第3章 電子セラミックス業界の考察
- 業界セグメンテーション
- 業界規模と予測(2018年~2032年)
- 業界情勢に対するCOVID-19の影響
- 業界エコシステム分析
- 原材料の分析
- 利益率分析
- 各段階での価値付加
- 流通チャネル分析
- ベンダーマトリックス
- 革新と持続可能性
- 特許分析
- 技術情勢
- 将来の動向
- 業界に対する影響要因
- 成長促進要因
- 業界の潜在的リスク・課題
- 規制動向
- 米国
- 欧州
- 中国
- 成長可能性分析(2022年)
- ポーターのファイブフォース分析
- 地域の価格動向
- コスト構造分析
- PESTLE分析
- 電子セラミックス業界に対するCOVID-19の影響
第4章 競合情勢
- イントロダクション
- 企業の市場シェア(2022年)
- 北米の企業の市場シェア(2022年)
- 欧州の企業の市場シェア(2022年)
- アジア太平洋の企業の市場シェア(2022年)
- ラテンアメリカの企業の市場シェア(2022年)
- 中東・アフリカの企業の市場シェア(2022年)
- 主な市場企業の競合の分析
- ベンダー採用マトリックス
- 戦略ダッシュボード
- 主要企業の概要
第5章 電子セラミックス市場:製品別
- 世界の電子セラミックス市場の考察:製品別
- 強誘電体セラミックス
- 圧電セラミックス
- 焦電セラミックス
- その他
第6章 電子セラミックス市場:エンドユーザー別
- 世界の電子セラミックス市場の考察:エンドユーザー別
- 家電・コンシューマーエレクトロニクス
- 医療
- 自動車・輸送
- 通信・送電
- その他
第7章 電子セラミックス市場:地域別
- 世界の電子セラミックス市場の地域の考察
- 北米
- 市場の推計と予測(2018年~2032年)
- 市場の推計と予測:エンドユーザー別の製品(2018年~2032年)
- 市場の推計と予測:エンドユーザー別(2018年~2032年)
- 米国
- カナダ
- 欧州
- 市場の推計と予測(2018年~2032年)
- 市場の推計と予測:エンドユーザー別の製品(2018年~2032年)
- 市場の推計と予測:エンドユーザー別(2018年~2032年)
- ドイツ
- 英国
- フランス
- スペイン
- イタリア
- ロシア
- アジア太平洋
- 市場の推計と予測(2018年~2032年)
- 市場の推計と予測:エンドユーザー別の製品(2018年~2032年)
- 市場の推計と予測:エンドユーザー別(2018年~2032年)
- 中国
- インド
- 日本
- オーストラリア
- インドネシア
- マレーシア
- 韓国
- ラテンアメリカ
- 市場の推計と予測(2018年~2032年)
- 市場の推計と予測:エンドユーザー別の製品(2018年~2032年)
- 市場の推計と予測:エンドユーザー別(2018年~2032年)
- ブラジル
- メキシコ
- 中東・アフリカ
- 市場の推計と予測(2018年~2032年)
- 市場の推計と予測:エンドユーザー別の製品(2018年~2032年)
- 市場の推計と予測:エンドユーザー別(2018年~2032年)
- 南アフリカ
- アラブ首長国連邦
- サウジアラビア
- クウェート
第8章 企業プロファイル
- CeramTec Holding GmbH
- Morgan Advanced Materials
- Maruwa Co., Ltd.
- Central Electronics Limited
- Kyocera Corporation
- Murata Manufacturing Co., Ltd.
- PI Ceramics
- Sensor Technology Ltd.
- Vinayak Techno Ceramics
- Sparkler Ceramics Pvt. Ltd.
- APC International, Ltd.
Data Tables
- TABLE 1 Global electronic ceramics market estimates and forecast, 2018 - 2032, (Kilo tons) (USD Million)
- TABLE 2 Global ferroelectric ceramics market volume, by end-user, (Kilo tons), 2018 - 2032
- TABLE 3 Global ferroelectric ceramics market revenue, by end-user, (USD Million), 2018 - 2032
- TABLE 4 Global piezoelectric ceramics market volume, by end-user, (Kilo tons), 2018 - 2032
- TABLE 5 Global piezoelectric ceramics market revenue, by end-user, (USD Million), 2018 - 2032
- TABLE 6 Global pyroelectric ceramics market volume, by end-user, (Kilo tons), 2018 - 2032
- TABLE 7 Global pyroelectric ceramics market revenue, by end-user, (USD Million), 2018 - 2032
- TABLE 8 Global other electronic ceramics market volume, by end-user, (Kilo tons), 2018 - 2032
- TABLE 9 Global other electronic ceramics market revenue, by end-user, (USD Million), 2018 - 2032
- TABLE 10 Global electronic ceramics market volume, by end-user, (Kilo tons), 2018 - 2032
- TABLE 11 Global Electronic ceramics market revenue, by end-user, (USD Million), 2018 - 2032
- TABLE 12 Global electronic ceramics market volume estimates and forecast, by region, 2018 - 2032 (Kilo tons)
- TABLE 13 Global electronic ceramics market revenue estimates and forecast, by region, 2018 - 2032 (USD Million)
- TABLE 14 Industry impact force analysis
- TABLE 15 Strategic dashboard
- TABLE 16 Global electronic ceramics market estimates and forecast for ferroelectric ceramics, 2018 - 2032, (Kilo tons) (USD Million)
- TABLE 17 Global ferroelectric ceramics market volume estimates and forecast, by end-user, 2018 - 2032 (Kilo tons)
- TABLE 18 Global ferroelectric ceramics market revenue estimates and forecast, by end-user, 2018 - 2032 (USD Million)
- TABLE 19 Global ferroelectric ceramics market volume, by region, 2018 - 2032 (Kilo tons)
- TABLE 20 Global ferroelectric ceramics market revenue, by region, 2018 - 2032 (USD Million)
- TABLE 21 Global electronic ceramics market estimates and forecast for piezoelectric ceramics, 2018 - 2032, (Kilo tons) (USD Million)
- TABLE 22 Global piezoelectric ceramics market volume estimates and forecast, by end-user, 2018 - 2032 (Kilo tons)
- TABLE 23 Global piezoelectric ceramics market revenue estimates and forecast, by end-user, 2018 - 2032 (USD Million)
- TABLE 24 Global piezoelectric ceramics market volume, by region, 2018 - 2032 (Kilo tons)
- TABLE 25 Global piezoelectric ceramics market revenue, by region, 2018 - 2032 (USD Million)
- TABLE 26 Global electronic ceramics market estimates and forecast for pyroelectric ceramics, 2018 - 2032, (Kilo tons) (USD Million)
- TABLE 27 Global pyroelectric ceramics market volume estimates and forecast, by end-user, 2018 - 2032 (Kilo tons)
- TABLE 28 Global pyroelectric ceramics market revenue estimates and forecast, by end-user, 2018 - 2032 (USD Million)
- TABLE 29 Global pyroelectric ceramics market volume, by region, 2018 - 2032 (Kilo tons)
- TABLE 30 Global pyroelectric ceramics market revenue, by region, 2018 - 2032 (USD Million)
- TABLE 31 Global electronic ceramics market estimates and forecast for other electronic ceramics, 2018 - 2032, (Kilo tons) (USD Million)
- TABLE 32 Global other electronic ceramics market volume estimates and forecast, by end-user, 2018 - 2032 (Kilo tons)
- TABLE 33 Global other electronic ceramics market revenue estimates and forecast, by end-user, 2018 - 2032 (USD Million)
- TABLE 34 Global other electronic ceramics market volume, by region, 2018 - 2032 (Kilo tons)
- TABLE 35 Global other electronic ceramics market revenue, by region, 2018 - 2032 (USD Million)
- TABLE 36 Global electronic ceramics market estimates and forecast for home appliances & consumer electronics, 2018 - 2032, (Kilo tons) (USD Million)
- TABLE 37 Global electronic ceramics market volume for home appliances & consumer electronics, by region, 2018 - 2032 (Kilo tons)
- TABLE 38 Global electronic ceramics market revenue for home appliances & consumer electronics by region, 2018 - 2032 (USD Million)
- TABLE 39 Global electronic ceramics market estimates and forecast for healthcare, 2018 - 2032, (Kilo tons) (USD Million)
- TABLE 40 Global electronic ceramics market volume for healthcare, by region, 2018 - 2032 (Kilo tons)
- TABLE 41 Global electronic ceramics market revenue for healthcare by region, 2018 - 2032 (USD Million)
- TABLE 42 Global electronic ceramics market estimates and forecast for automotive & transportation, 2018 - 2032, (Kilo tons) (USD Million)
- TABLE 43 Global electronic ceramics market volume for automotive & transportation, by region, 2018 - 2032 (Kilo tons)
- TABLE 44 Global electronic ceramics market revenue for automotive & transportation by region, 2018 - 2032 (USD Million)
- TABLE 45 Global electronic ceramics market estimates and forecast for telecommunication & power transmission, 2018 - 2032, (Kilo tons) (USD Million)
- TABLE 46 Global electronic ceramics market volume for telecommunication & power transmission, by region, 2018 - 2032 (Kilo tons)
- TABLE 47 Global electronic ceramics market revenue for telecommunication & power transmission by region, 2018 - 2032 (USD Million)
- TABLE 48 Global electronic ceramics market estimates and forecast for others, 2018 - 2032, (Kilo tons) (USD Million)
- TABLE 49 Global electronic ceramics market volume for others, by region, 2018 - 2032 (Kilo tons)
- TABLE 50 Global electronic ceramics market revenue for others by region, 2018 - 2032 (USD Million)
- TABLE 51 North America electronic ceramics market estimates and forecast, 2018 - 2032, (Kilo tons) (USD Million)
- TABLE 52 North America ferroelectric ceramics market volume, by end-user, (Kilo tons), 2018 - 2032
- TABLE 53 North America ferroelectric ceramics market revenue, by end-user, (USD Million), 2018 - 2032
- TABLE 54 North America piezoelectric ceramics market volume, by end-user, (Kilo tons), 2018 - 2032
- TABLE 55 North America piezoelectric ceramics market revenue, by end-user, (USD Million), 2018 - 2032
- TABLE 56 North America pyroelectric ceramics market volume, by end-user, (Kilo tons), 2018 - 2032
- TABLE 57 North America pyroelectric ceramics market revenue, by end-user, (USD Million), 2018 - 2032
- TABLE 58 North America other electronic ceramics market volume, by end-user, (Kilo tons), 2018 - 2032
- TABLE 59 North America other electronic ceramics market revenue, by end-user, (USD Million), 2018 - 2032
- TABLE 60 North America electronic ceramics market volume, by end-user, (Kilo tons), 2018 - 2032
- TABLE 61 North America electronic ceramics market revenue, by end-user, (USD Million), 2018 - 2032
- TABLE 62 U.S. electronic ceramics market estimates and forecast, 2018 - 2032, (Kilo tons) (USD Million)
- TABLE 63 U.S. ferroelectric ceramics market volume, by end-user, (Kilo tons), 2018 - 2032
- TABLE 64 U.S. ferroelectric ceramics market revenue, by end-user, (USD Million), 2018 - 2032
- TABLE 65 U.S. piezoelectric ceramics market volume, by end-user, (Kilo tons), 2018 - 2032
- TABLE 66 U.S. piezoelectric ceramics market revenue, by end-user, (USD Million), 2018 - 2032
- TABLE 67 U.S. pyroelectric ceramics market volume, by end-user, (Kilo tons), 2018 - 2032
- TABLE 68 U.S. pyroelectric ceramics market revenue, by end-user, (USD Million), 2018 - 2032
- TABLE 69 U.S. other electronic ceramics market volume, by end-user, (Kilo tons), 2018 - 2032
- TABLE 70 U.S. other electronic ceramics market revenue, by end-user, (USD Million), 2018 - 2032
- TABLE 71 U.S. electronic ceramics market volume, by end-user, (Kilo tons), 2018 - 2032
- TABLE 72 U.S. electronic ceramics market revenue, by end-user, (USD Million), 2018 - 2032
- TABLE 73 Canada electronic ceramics market estimates and forecast, 2018 - 2032, (Kilo tons) (USD Million)
- TABLE 74 Canada ferroelectric ceramics market volume, by end-user, (Kilo tons), 2018 - 2032
- TABLE 75 Canada ferroelectric ceramics market revenue, by end-user, (USD Million), 2018 - 2032
- TABLE 76 Canada piezoelectric ceramics market volume, by end-user, (Kilo tons), 2018 - 2032
- TABLE 77 Canada piezoelectric ceramics market revenue, by end-user, (USD Million), 2018 - 2032
- TABLE 78 Canada pyroelectric ceramics market volume, by end-user, (Kilo tons), 2018 - 2032
- TABLE 79 Canada pyroelectric ceramics market revenue, by end-user, (USD Million), 2018 - 2032
- TABLE 80 Canada other electronic ceramics market volume, by end-user, (Kilo tons), 2018 - 2032
- TABLE 81 Canada other electronic ceramics market revenue, by end-user, (USD Million), 2018 - 2032
- TABLE 82 Canada electronic ceramics market volume, by end-user, (Kilo tons), 2018 - 2032
- TABLE 83 Canada electronic ceramics market revenue, by end-user, (USD Million), 2018 - 2032
- TABLE 84 Europe electronic ceramics market estimates and forecast, 2018 - 2032, (Kilo tons) (USD Million)
- TABLE 85 Europe ferroelectric ceramics market volume, by end-user, (Kilo tons), 2018 - 2032
- TABLE 86 Europe ferroelectric ceramics market revenue, by end-user, (USD Million), 2018 - 2032
- TABLE 87 Europe piezoelectric ceramics market volume, by end-user, (Kilo tons), 2018 - 2032
- TABLE 88 Europe piezoelectric ceramics market revenue, by end-user, (USD Million), 2018 - 2032
- TABLE 89 Europe pyroelectric ceramics market volume, by end-user, (Kilo tons), 2018 - 2032
- TABLE 90 Europe pyroelectric ceramics market revenue, by end-user, (USD Million), 2018 - 2032
- TABLE 91 Europe other electronic ceramics market volume, by end-user, (Kilo tons), 2018 - 2032
- TABLE 92 Europe other electronic ceramics market revenue, by end-user, (USD Million), 2018 - 2032
- TABLE 93 Europe electronic ceramics market volume, by end-user, (Kilo tons), 2018 - 2032
- TABLE 94 Europe Electronic ceramics market revenue, by end-user, (USD Million), 2018 - 2032
- TABLE 95 Germany electronic ceramics market estimates and forecast, 2018 - 2032, (Kilo tons) (USD Million)
- TABLE 96 Germany ferroelectric ceramics market volume, by end-user, (Kilo tons), 2018 - 2032
- TABLE 97 Germany ferroelectric ceramics market revenue, by end-user, (USD Million), 2018 - 2032
- TABLE 98 Germany piezoelectric ceramics market volume, by end-user, (Kilo tons), 2018 - 2032
- TABLE 99 Germany piezoelectric ceramics market revenue, by end-user, (USD Million), 2018 - 2032
- TABLE 100 Germany pyroelectric ceramics market volume, by end-user, (Kilo tons), 2018 - 2032
- TABLE 101 Germany pyroelectric ceramics market revenue, by end-user, (USD Million), 2018 - 2032
- TABLE 102 Germany other electronic ceramics market volume, by end-user, (Kilo tons), 2018 - 2032
- TABLE 103 Germany other electronic ceramics market revenue, by end-user, (USD Million), 2018 - 2032
- TABLE 104 Germany electronic ceramics market volume, by end-user, (Kilo tons), 2018 - 2032
- TABLE 105 Germany electronic ceramics market revenue, by end-user, (USD Million), 2018 - 2032
- TABLE 106 UK electronic ceramics market estimates and forecast, 2018 - 2032, (Kilo tons) (USD Million)
- TABLE 107 UK ferroelectric ceramics market volume, by end-user, (Kilo tons), 2018 - 2032
- TABLE 108 UK ferroelectric ceramics market revenue, by end-user, (USD Million), 2018 - 2032
- TABLE 109 UK piezoelectric ceramics market volume, by end-user, (Kilo tons), 2018 - 2032
- TABLE 110 UK piezoelectric ceramics market revenue, by end-user, (USD Million), 2018 - 2032
- TABLE 111 UK pyroelectric ceramics market volume, by end-user, (Kilo tons), 2018 - 2032
- TABLE 112 UK pyroelectric ceramics market revenue, by end-user, (USD Million), 2018 - 2032
- TABLE 113 UK other electronic ceramics market volume, by end-user, (Kilo tons), 2018 - 2032
- TABLE 114 UK other electronic ceramics market revenue, by end-user, (USD Million), 2018 - 2032
- TABLE 115 UK electronic ceramics market volume, by end-user, (Kilo tons), 2018 - 2032
- TABLE 116 UK electronic ceramics market revenue, by end-user, (USD Million), 2018 - 2032
- TABLE 117 France electronic ceramics market estimates and forecast, 2018 - 2032, (Kilo tons) (USD Million)
- TABLE 118 France ferroelectric ceramics market volume, by end-user, (Kilo tons), 2018 - 2032
- TABLE 119 France ferroelectric ceramics market revenue, by end-user, (USD Million), 2018 - 2032
- TABLE 120 France piezoelectric ceramics market volume, by end-user, (Kilo tons), 2018 - 2032
- TABLE 121 France piezoelectric ceramics market revenue, by end-user, (USD Million), 2018 - 2032
- TABLE 122 France pyroelectric ceramics market volume, by end-user, (Kilo tons), 2018 - 2032
- TABLE 123 France pyroelectric ceramics market revenue, by end-user, (USD Million), 2018 - 2032
- TABLE 124 France other electronic ceramics market volume, by end-user, (Kilo tons), 2018 - 2032
- TABLE 125 France other electronic ceramics market revenue, by end-user, (USD Million), 2018 - 2032
- TABLE 126 France electronic ceramics market volume, by end-user, (Kilo tons), 2018 - 2032
- TABLE 127 France electronic ceramics market revenue, by end-user, (USD Million), 2018 - 2032
- TABLE 128 Spain electronic ceramics market estimates and forecast, 2018 - 2032, (Kilo tons) (USD Million)
- TABLE 129 Spain ferroelectric ceramics market volume, by end-user, (Kilo tons), 2018 - 2032
- TABLE 130 Spain ferroelectric ceramics market revenue, by end-user, (USD Million), 2018 - 2032
- TABLE 131 Spain piezoelectric ceramics market volume, by end-user, (Kilo tons), 2018 - 2032
- TABLE 132 Spain piezoelectric ceramics market revenue, by end-user, (USD Million), 2018 - 2032
- TABLE 133 Spain pyroelectric ceramics market volume, by end-user, (Kilo tons), 2018 - 2032
- TABLE 134 Spain pyroelectric ceramics market revenue, by end-user, (USD Million), 2018 - 2032
- TABLE 135 Spain other electronic ceramics market volume, by end-user, (Kilo tons), 2018 - 2032
- TABLE 136 Spain other electronic ceramics market revenue, by end-user, (USD Million), 2018 - 2032
- TABLE 137 Spain electronic ceramics market volume, by end-user, (Kilo tons), 2018 - 2032
- TABLE 138 Spain electronic ceramics market revenue, by end-user, (USD Million), 2018 - 2032
- TABLE 139 Italy electronic ceramics market estimates and forecast, 2018 - 2032, (Kilo tons) (USD Million)
- TABLE 140 Italy ferroelectric ceramics market volume, by end-user, (Kilo tons), 2018 - 2032
- TABLE 141 Italy ferroelectric ceramics market revenue, by end-user, (USD Million), 2018 - 2032
- TABLE 142 Italy piezoelectric ceramics market volume, by end-user, (Kilo tons), 2018 - 2032
- TABLE 143 Italy piezoelectric ceramics market revenue, by end-user, (USD Million), 2018 - 2032
- TABLE 144 Italy pyroelectric ceramics market volume, by end-user, (Kilo tons), 2018 - 2032
- TABLE 145 Italy pyroelectric ceramics market revenue, by end-user, (USD Million), 2018 - 2032
- TABLE 146 Italy other electronic ceramics market volume, by end-user, (Kilo tons), 2018 - 2032
- TABLE 147 Italy other electronic ceramics market revenue, by end-user, (USD Million), 2018 - 2032
- TABLE 148 Italy electronic ceramics market volume, by end-user, (Kilo tons), 2018 - 2032
- TABLE 149 Italy electronic ceramics market revenue, by end-user, (USD Million), 2018 - 2032
- TABLE 150 Russia electronic ceramics market estimates and forecast, 2018 - 2032, (Kilo tons) (USD Million)
- TABLE 151 Russia ferroelectric ceramics market volume, by end-user, (Kilo tons), 2018 - 2032
- TABLE 152 Russia ferroelectric ceramics market revenue, by end-user, (USD Million), 2018 - 2032
- TABLE 153 Russia piezoelectric ceramics market volume, by end-user, (Kilo tons), 2018 - 2032
- TABLE 154 Russia piezoelectric ceramics market revenue, by end-user, (USD Million), 2018 - 2032
- TABLE 155 Russia pyroelectric ceramics market volume, by end-user, (Kilo tons), 2018 - 2032
- TABLE 156 Russia pyroelectric ceramics market revenue, by end-user, (USD Million), 2018 - 2032
- TABLE 157 Russia other electronic ceramics market volume, by end-user, (Kilo tons), 2018 - 2032
- TABLE 158 Russia other electronic ceramics market revenue, by end-user, (USD Million), 2018 - 2032
- TABLE 159 Russia electronic ceramics market volume, by end-user, (Kilo tons), 2018 - 2032
- TABLE 160 Russia electronic ceramics market revenue, by end-user, (USD Million), 2018 - 2032
- TABLE 161 Asia Pacific electronic ceramics market estimates and forecast, 2018 - 2032, (Kilo tons) (USD Million)
- TABLE 162 Asia Pacific ferroelectric ceramics market volume, by end-user, (Kilo tons), 2018 - 2032
- TABLE 163 Asia Pacific ferroelectric ceramics market revenue, by end-user, (USD Million), 2018 - 2032
- TABLE 164 Asia Pacific piezoelectric ceramics market volume, by end-user, (Kilo tons), 2018 - 2032
- TABLE 165 Asia Pacific piezoelectric ceramics market revenue, by end-user, (USD Million), 2018 - 2032
- TABLE 166 Asia Pacific pyroelectric ceramics market volume, by end-user, (Kilo tons), 2018 - 2032
- TABLE 167 Asia Pacific pyroelectric ceramics market revenue, by end-user, (USD Million), 2018 - 2032
- TABLE 168 Asia Pacific other electronic ceramics market volume, by end-user, (Kilo tons), 2018 - 2032
- TABLE 169 Asia Pacific other electronic ceramics market revenue, by end-user, (USD Million), 2018 - 2032
- TABLE 170 Asia Pacific electronic ceramics market volume, by end-user, (Kilo tons), 2018 - 2032
- TABLE 171 Asia Pacific electronic ceramics market revenue, by end-user, (USD Million), 2018 - 2032
- TABLE 172 China electronic ceramics market estimates and forecast, 2018 - 2032, (Kilo tons) (USD Million)
- TABLE 173 China ferroelectric ceramics market volume, by end-user, (Kilo tons), 2018 - 2032
- TABLE 174 China ferroelectric ceramics market revenue, by end-user, (USD Million), 2018 - 2032
- TABLE 175 China piezoelectric ceramics market volume, by end-user, (Kilo tons), 2018 - 2032
- TABLE 176 China piezoelectric ceramics market revenue, by end-user, (USD Million), 2018 - 2032
- TABLE 177 China pyroelectric ceramics market volume, by end-user, (Kilo tons), 2018 - 2032
- TABLE 178 China pyroelectric ceramics market revenue, by end-user, (USD Million), 2018 - 2032
- TABLE 179 China other electronic ceramics market volume, by end-user, (Kilo tons), 2018 - 2032
- TABLE 180 China other electronic ceramics market revenue, by end-user, (USD Million), 2018 - 2032
- TABLE 181 China electronic ceramics market volume, by end-user, (Kilo tons), 2018 - 2032
- TABLE 182 China electronic ceramics market revenue, by end-user, (USD Million), 2018 - 2032
- TABLE 183 India electronic ceramics market estimates and forecast, 2018 - 2032, (Kilo tons) (USD Million)
- TABLE 184 India ferroelectric ceramics market volume, by end-user, (Kilo tons), 2018 - 2032
- TABLE 185 India ferroelectric ceramics market revenue, by end-user, (USD Million), 2018 - 2032
- TABLE 186 India piezoelectric ceramics market volume, by end-user, (Kilo tons), 2018 - 2032
- TABLE 187 India piezoelectric ceramics market revenue, by end-user, (USD Million), 2018 - 2032
- TABLE 188 India pyroelectric ceramics market volume, by end-user, (Kilo tons), 2018 - 2032
- TABLE 189 India pyroelectric ceramics market revenue, by end-user, (USD Million), 2018 - 2032
- TABLE 190 India other electronic ceramics market volume, by end-user, (Kilo tons), 2018 - 2032
- TABLE 191 India other electronic ceramics market revenue, by end-user, (USD Million), 2018 - 2032
- TABLE 192 India electronic ceramics market volume, by end-user, (Kilo tons), 2018 - 2032
- TABLE 193 India electronic ceramics market revenue, by end-user, (USD Million), 2018 - 2032
- TABLE 194 Japan electronic ceramics market estimates and forecast, 2018 - 2032, (Kilo tons) (USD Million)
- TABLE 195 Japan ferroelectric ceramics market volume, by end-user, (Kilo tons), 2018 - 2032
- TABLE 196 Japan ferroelectric ceramics market revenue, by end-user, (USD Million), 2018 - 2032
- TABLE 197 Japan piezoelectric ceramics market volume, by end-user, (Kilo tons), 2018 - 2032
- TABLE 198 Japan piezoelectric ceramics market revenue, by end-user, (USD Million), 2018 - 2032
- TABLE 199 Japan pyroelectric ceramics market volume, by end-user, (Kilo tons), 2018 - 2032
- TABLE 200 Japan pyroelectric ceramics market revenue, by end-user, (USD Million), 2018 - 2032
- TABLE 201 Japan other electronic ceramics market volume, by end-user, (Kilo tons), 2018 - 2032
- TABLE 202 Japan other electronic ceramics market revenue, by end-user, (USD Million), 2018 - 2032
- TABLE 203 Japan electronic ceramics market volume, by end-user, (Kilo tons), 2018 - 2032
- TABLE 204 Japan electronic ceramics market revenue, by end-user, (USD Million), 2018 - 2032
- TABLE 205 Australia electronic ceramics market estimates and forecast, 2018 - 2032, (Kilo tons) (USD Million)
- TABLE 206 Australia ferroelectric ceramics market volume, by end-user, (Kilo tons), 2018 - 2032
- TABLE 207 Australia ferroelectric ceramics market revenue, by end-user, (USD Million), 2018 - 2032
- TABLE 208 Australia piezoelectric ceramics market volume, by end-user, (Kilo tons), 2018 - 2032
- TABLE 209 Australia piezoelectric ceramics market revenue, by end-user, (USD Million), 2018 - 2032
- TABLE 210 Australia pyroelectric ceramics market volume, by end-user, (Kilo tons), 2018 - 2032
- TABLE 211 Australia pyroelectric ceramics market revenue, by end-user, (USD Million), 2018 - 2032
- TABLE 212 Australia other electronic ceramics market volume, by end-user, (Kilo tons), 2018 - 2032
- TABLE 213 Australia other electronic ceramics market revenue, by end-user, (USD Million), 2018 - 2032
- TABLE 214 Australia electronic ceramics market volume, by end-user, (Kilo tons), 2018 - 2032
- TABLE 215 Australia electronic ceramics market revenue, by end-user, (USD Million), 2018 - 2032
- TABLE 216 Indonesia electronic ceramics market estimates and forecast, 2018 - 2032, (Kilo tons) (USD Million)
- TABLE 217 Indonesia ferroelectric ceramics market volume, by end-user, (Kilo tons), 2018 - 2032
- TABLE 218 Indonesia ferroelectric ceramics market revenue, by end-user, (USD Million), 2018 - 2032
- TABLE 219 Indonesia piezoelectric ceramics market volume, by end-user, (Kilo tons), 2018 - 2032
- TABLE 220 Indonesia piezoelectric ceramics market revenue, by end-user, (USD Million), 2018 - 2032
- TABLE 221 Indonesia pyroelectric ceramics market volume, by end-user, (Kilo tons), 2018 - 2032
- TABLE 222 Indonesia pyroelectric ceramics market revenue, by end-user, (USD Million), 2018 - 2032
- TABLE 223 Indonesia other electronic ceramics market volume, by end-user, (Kilo tons), 2018 - 2032
- TABLE 224 Indonesia other electronic ceramics market revenue, by end-user, (USD Million), 2018 - 2032
- TABLE 225 Indonesia electronic ceramics market volume, by end-user, (Kilo tons), 2018 - 2032
- TABLE 226 Indonesia electronic ceramics market revenue, by end-user, (USD Million), 2018 - 2032
- TABLE 227 Malaysia electronic ceramics market estimates and forecast, 2018 - 2032, (Kilo tons) (USD Million)
- TABLE 228 Malaysia ferroelectric ceramics market volume, by end-user, (Kilo tons), 2018 - 2032
- TABLE 229 Malaysia ferroelectric ceramics market revenue, by end-user, (USD Million), 2018 - 2032
- TABLE 230 Malaysia piezoelectric ceramics market volume, by end-user, (Kilo tons), 2018 - 2032
- TABLE 231 Malaysia piezoelectric ceramics market revenue, by end-user, (USD Million), 2018 - 2032
- TABLE 232 Malaysia pyroelectric ceramics market volume, by end-user, (Kilo tons), 2018 - 2032
- TABLE 233 Malaysia pyroelectric ceramics market revenue, by end-user, (USD Million), 2018 - 2032
- TABLE 234 Malaysia other electronic ceramics market volume, by end-user, (Kilo tons), 2018 - 2032
- TABLE 235 Malaysia other electronic ceramics market revenue, by end-user, (USD Million), 2018 - 2032
- TABLE 236 Malaysia electronic ceramics market volume, by end-user, (Kilo tons), 2018 - 2032
- TABLE 237 Malaysia electronic ceramics market revenue, by end-user, (USD Million), 2018 - 2032
- TABLE 238 South Korea electronic ceramics market estimates and forecast, 2018 - 2032, (Kilo tons) (USD Million)
- TABLE 239 South Korea ferroelectric ceramics market volume, by end-user, (Kilo tons), 2018 - 2032
- TABLE 240 South Korea ferroelectric ceramics market revenue, by end-user, (USD Million), 2018 - 2032
- TABLE 241 South Korea piezoelectric ceramics market volume, by end-user, (Kilo tons), 2018 - 2032
- TABLE 242 South Korea piezoelectric ceramics market revenue, by end-user, (USD Million), 2018 - 2032
- TABLE 243 South Korea pyroelectric ceramics market volume, by end-user, (Kilo tons), 2018 - 2032
- TABLE 244 South Korea pyroelectric ceramics market revenue, by end-user, (USD Million), 2018 - 2032
- TABLE 245 South Korea other electronic ceramics market volume, by end-user, (Kilo tons), 2018 - 2032
- TABLE 246 South Korea other electronic ceramics market revenue, by end-user, (USD Million), 2018 - 2032
- TABLE 247 South Korea electronic ceramics market volume, by end-user, (Kilo tons), 2018 - 2032
- TABLE 248 South Korea electronic ceramics market revenue, by end-user, (USD Million), 2018 - 2032
- TABLE 249 Latin America electronic ceramics market estimates and forecast, 2018 - 2032, (Kilo tons) (USD Million)
- TABLE 250 Latin America ferroelectric ceramics market volume, by end-user, (Kilo tons), 2018 - 2032
- TABLE 251 Latin America ferroelectric ceramics market revenue, by end-user, (USD Million), 2018 - 2032
- TABLE 252 Latin America piezoelectric ceramics market volume, by end-user, (Kilo tons), 2018 - 2032
- TABLE 253 Latin America piezoelectric ceramics market revenue, by end-user, (USD Million), 2018 - 2032
- TABLE 254 Latin America pyroelectric ceramics market volume, by end-user, (Kilo tons), 2018 - 2032
- TABLE 255 Latin America pyroelectric ceramics market revenue, by end-user, (USD Million), 2018 - 2032
- TABLE 256 Latin America other electronic ceramics market volume, by end-user, (Kilo tons), 2018 - 2032
- TABLE 257 Latin America other electronic ceramics market revenue, by end-user, (USD Million), 2018 - 2032
- TABLE 258 Latin America electronic ceramics market volume, by end-user, (Kilo tons), 2018 - 2032
- TABLE 259 Latin America Electronic ceramics market revenue, by end-user, (USD Million), 2018 - 2032
- TABLE 260 Brazil electronic ceramics market estimates and forecast, 2018 - 2032, (Kilo tons) (USD Million)
- TABLE 261 Brazil ferroelectric ceramics market volume, by end-user, (Kilo tons), 2018 - 2032
- TABLE 262 Brazil ferroelectric ceramics market revenue, by end-user, (USD Million), 2018 - 2032
- TABLE 263 Brazil piezoelectric ceramics market volume, by end-user, (Kilo tons), 2018 - 2032
- TABLE 264 Brazil piezoelectric ceramics market revenue, by end-user, (USD Million), 2018 - 2032
- TABLE 265 Brazil pyroelectric ceramics market volume, by end-user, (Kilo tons), 2018 - 2032
- TABLE 266 Brazil pyroelectric ceramics market revenue, by end-user, (USD Million), 2018 - 2032
- TABLE 267 Brazil other electronic ceramics market volume, by end-user, (Kilo tons), 2018 - 2032
- TABLE 268 Brazil other electronic ceramics market revenue, by end-user, (USD Million), 2018 - 2032
- TABLE 269 Brazil electronic ceramics market volume, by end-user, (Kilo tons), 2018 - 2032
- TABLE 270 Brazil electronic ceramics market revenue, by end-user, (USD Million), 2018 - 2032
- TABLE 271 Mexico electronic ceramics market estimates and forecast, 2018 - 2032, (Kilo tons) (USD Million)
- TABLE 272 Mexico ferroelectric ceramics market volume, by end-user, (Kilo tons), 2018 - 2032
- TABLE 273 Mexico ferroelectric ceramics market revenue, by end-user, (USD Million), 2018 - 2032
- TABLE 274 Mexico piezoelectric ceramics market volume, by end-user, (Kilo tons), 2018 - 2032
- TABLE 275 Mexico piezoelectric ceramics market revenue, by end-user, (USD Million), 2018 - 2032
- TABLE 276 Mexico pyroelectric ceramics market volume, by end-user, (Kilo tons), 2018 - 2032
- TABLE 277 Mexico pyroelectric ceramics market revenue, by end-user, (USD Million), 2018 - 2032
- TABLE 278 Mexico other electronic ceramics market volume, by end-user, (Kilo tons), 2018 - 2032
- TABLE 279 Mexico other electronic ceramics market revenue, by end-user, (USD Million), 2018 - 2032
- TABLE 280 Mexico electronic ceramics market volume, by end-user, (Kilo tons), 2018 - 2032
- TABLE 281 Mexico electronic ceramics market revenue, by end-user, (USD Million), 2018 - 2032
- TABLE 282 Middle East & Africa electronic ceramics market estimates and forecast, 2018 - 2032, (Kilo tons) (USD Million)
- TABLE 283 Middle East & Africa ferroelectric ceramics market volume, by end-user, (Kilo tons), 2018 - 2032
- TABLE 284 Middle East & Africa ferroelectric ceramics market revenue, by end-user, (USD Million), 2018 - 2032
- TABLE 285 Middle East & Africa piezoelectric ceramics market volume, by end-user, (Kilo tons), 2018 - 2032
- TABLE 286 Middle East & Africa piezoelectric ceramics market revenue, by end-user, (USD Million), 2018 - 2032
- TABLE 287 Middle East & Africa pyroelectric ceramics market volume, by end-user, (Kilo tons), 2018 - 2032
- TABLE 288 Middle East & Africa pyroelectric ceramics market revenue, by end-user, (USD Million), 2018 - 2032
- TABLE 289 Middle East & Africa other electronic ceramics market volume, by end-user, (Kilo tons), 2018 - 2032
- TABLE 290 Middle East & Africa other electronic ceramics market revenue, by end-user, (USD Million), 2018 - 2032
- TABLE 291 Middle East & Africa electronic ceramics market volume, by end-user, (Kilo tons), 2018 - 2032
- TABLE 292 Middle East & Africa Electronic ceramics market revenue, by end-user, (USD Million), 2018 - 2032
- TABLE 293 South Africa electronic ceramics market estimates and forecast, 2018 - 2032, (Kilo tons) (USD Million)
- TABLE 294 South Africa ferroelectric ceramics market volume, by end-user, (Kilo tons), 2018 - 2032
- TABLE 295 South Africa ferroelectric ceramics market revenue, by end-user, (USD Million), 2018 - 2032
- TABLE 296 South Africa piezoelectric ceramics market volume, by end-user, (Kilo tons), 2018 - 2032
- TABLE 297 South Africa piezoelectric ceramics market revenue, by end-user, (USD Million), 2018 - 2032
- TABLE 298 South Africa pyroelectric ceramics market volume, by end-user, (Kilo tons), 2018 - 2032
- TABLE 299 South Africa pyroelectric ceramics market revenue, by end-user, (USD Million), 2018 - 2032
- TABLE 300 South Africa other electronic ceramics market volume, by end-user, (Kilo tons), 2018 - 2032
- TABLE 301 South Africa other electronic ceramics market revenue, by end-user, (USD Million), 2018 - 2032
- TABLE 302 South Africa electronic ceramics market volume, by end-user, (Kilo tons), 2018 - 2032
- TABLE 303 South Africa electronic ceramics market revenue, by end-user, (USD Million), 2018 - 2032
- TABLE 304 Saudi Arabia electronic ceramics market estimates and forecast, 2018 - 2032, (Kilo tons) (USD Million)
- TABLE 305 Saudi Arabia ferroelectric ceramics market volume, by end-user, (Kilo tons), 2018 - 2032
- TABLE 306 Saudi Arabia ferroelectric ceramics market revenue, by end-user, (USD Million), 2018 - 2032
- TABLE 307 Saudi Arabia piezoelectric ceramics market volume, by end-user, (Kilo tons), 2018 - 2032
- TABLE 308 Saudi Arabia piezoelectric ceramics market revenue, by end-user, (USD Million), 2018 - 2032
- TABLE 309 Saudi Arabia pyroelectric ceramics market volume, by end-user, (Kilo tons), 2018 - 2032
- TABLE 310 Saudi Arabia pyroelectric ceramics market revenue, by end-user, (USD Million), 2018 - 2032
- TABLE 311 Saudi Arabia other electronic ceramics market volume, by end-user, (Kilo tons), 2018 - 2032
- TABLE 312 Saudi Arabia other electronic ceramics market revenue, by end-user, (USD Million), 2018 - 2032
- TABLE 313 Saudi Arabia electronic ceramics market volume, by end-user, (Kilo tons), 2018 - 2032
- TABLE 314 Saudi Arabia electronic ceramics market revenue, by end-user, (USD Million), 2018 - 2032
- TABLE 315 UAE electronic ceramics market estimates and forecast, 2018 - 2032, (Kilo tons) (USD Million)
- TABLE 316 UAE ferroelectric ceramics market volume, by end-user, (Kilo tons), 2018 - 2032
- TABLE 317 UAE ferroelectric ceramics market revenue, by end-user, (USD Million), 2018 - 2032
- TABLE 318 UAE piezoelectric ceramics market volume, by end-user, (Kilo tons), 2018 - 2032
- TABLE 319 UAE piezoelectric ceramics market revenue, by end-user, (USD Million), 2018 - 2032
- TABLE 320 UAE pyroelectric ceramics market volume, by end-user, (Kilo tons), 2018 - 2032
- TABLE 321 UAE pyroelectric ceramics market revenue, by end-user, (USD Million), 2018 - 2032
- TABLE 322 UAE other electronic ceramics market volume, by end-user, (Kilo tons), 2018 - 2032
- TABLE 323 UAE other electronic ceramics market revenue, by end-user, (USD Million), 2018 - 2032
- TABLE 324 UAE electronic ceramics market volume, by end-user, (Kilo tons), 2018 - 2032
- TABLE 325 UAE electronic ceramics market revenue, by end-user, (USD Million), 2018 - 2032
- TABLE 326 Kuwait electronic ceramics market estimates and forecast, 2018 - 2032, (Kilo tons) (USD Million)
- TABLE 327 Kuwait ferroelectric ceramics market volume, by end-user, (Kilo tons), 2018 - 2032
- TABLE 328 Kuwait ferroelectric ceramics market revenue, by end-user, (USD Million), 2018 - 2032
- TABLE 329 Kuwait piezoelectric ceramics market volume, by end-user, (Kilo tons), 2018 - 2032
- TABLE 330 Kuwait piezoelectric ceramics market revenue, by end-user, (USD Million), 2018 - 2032
- TABLE 331 Kuwait pyroelectric ceramics market volume, by end-user, (Kilo tons), 2018 - 2032
- TABLE 332 Kuwait pyroelectric ceramics market revenue, by end-user, (USD Million), 2018 - 2032
- TABLE 333 Kuwait other electronic ceramics market volume, by end-user, (Kilo tons), 2018 - 2032
- TABLE 334 Kuwait other electronic ceramics market revenue, by end-user, (USD Million), 2018 - 2032
- TABLE 335 Kuwait electronic ceramics market volume, by end-user, (Kilo tons), 2018 - 2032
- TABLE 336 Kuwait electronic ceramics market revenue, by end-user, (USD Million), 2018 - 2032
Charts & Figures
- FIG. 1 Industry segmentation
- FIG. 2 Global electronic ceramics market, (Kilo Kilo tons) (USD Million), 2018 - 2032
- FIG. 3 Industry ecosystem analysis
- FIG. 4 Asia Pacific and Middle East vehicle sales statistics, (Million Units) 2010 - 2020
- FIG. 5 Growth potential analysis
- FIG. 6 Company market share analysis, 2021
- FIG. 7 Porter's analysis
- FIG. 9 Cost structure analysis
- FIG. 10 Price by form
- FIG. 11 Price by technology
- FIG. 12 PESTEL analysis
- FIG. 13 SWOT analysis, CeramTec Holding GmbH
- FIG. 14 SWOT analysis, Morgan Advanced Materials
- FIG. 15 SWOT analysis, Maruwa Co., Ltd.
- FIG. 16 SWOT analysis, Central Electronics Limited
- FIG. 17 SWOT analysis, Kyocera Corporation
- FIG. 18 SWOT analysis, Murata Manufacturing Co., Ltd.
- FIG. 19 SWOT analysis, PI Ceramics
- FIG. 20 SWOT analysis, Sensor Technology Ltd.
- FIG. 21 SWOT analysis, Vinayak Techno Ceramics
- FIG. 22 SWOT analysis, Sparkler Ceramics Pvt. Ltd.
- FIG. 23 SWOT analysis, APC International, Ltd.
The global electronic ceramics market is slated to expand exponentially through 2032 owing to the increasing demand from end-use markets.
Leading market players are vying for partnerships and acquisitions in the overseas market to expand their product portfolios. However, the industry growth is likely to be challenged due to the adverse environmental and health impacts connected with the product. Moreover, the growing capital investment concerning product manufacturing is also expected to hold back market growth through the analysis timeframe.
The electronic ceramics market has been bifurcated in terms of product, end-user, and region.
Based on product, the pyroelectric ceramics segment is expected to grow at more than 6.5% CAGR from 2023 to 2032. Pyroelectric ceramics are mostly employed in pollution control as well as thermal imaging technology owing to their ability to produce voltage when heated or cooled.
With respect to end-user, the healthcare segment is anticipated to grow substantially through the forecast period. The emergence of chronic diseases and rising investment in the development of innovative therapeutic, diagnostic, and preventative methods are likely to foster the demand for electronic ceramics in the healthcare industry.
Meanwhile, the telecommunication & power transmission segment is poised to flourish positively over the review timeline. The telecommunications and electricity transmission sectors are growing rapidly as a result of favorable policies established by governments in emerging nations. Such regulations aid in the development of adequate infrastructure and the provision of reasonably priced internet and communication services. The aforementioned factors are slated to propel the market expansion through 2032.
From the regional perspective, the North America electronic ceramics market is projected to attain more than $3 billion in revenue by 2032. The regional market growth is estimated to come from the rising car production and a growing trend toward electric vehicles. Additionally, the United States is one of the biggest healthcare markets, which offers the possibility for major growth for electronic ceramics in the region.
On the other hand, the Middle East & Africa electronic ceramics industry is estimated to proliferate over the research timeframe. Several MEA nations are shifting away from an oil-based economy to create opportunities in other economic sectors, which will result in significant investments. As a result, this is expected to generate lucrative opportunities for electronic ceramics industry leaders across the Middle East and Africa region.
The competitive landscape of the electronic ceramics industry is highly established. The companies operating the marketplace are Morgan Advanced Materials, CeramTec Holding GmbH, Central Electronics Limited, Maruwa Co., Ltd., Murata Manufacturing Co., Ltd., Kyocera Corporation, and APC International, Ltd.
Table of Contents
Chapter 1 Methodology and Scope
- 1.1 Market definition
- 1.2 Base estimates & working
- 1.2.1 North America
- 1.2.2 Europe
- 1.2.3 Asia Pacific
- 1.2.4 Latin America
- 1.2.5 Middle East & Africa
- 1.3 Forecast calculations
- 1.3.1 COVID-19 impact calculations on industry forecast
- 1.4 Data Sources
- 1.4.1 Primary
- 1.4.2 Secondary
Chapter 2 Executive Summary
- 2.1 Global electronic ceramics industry 360 degree synopsis, 2018 - 2032
- 2.1.1 Business trends
- 2.1.2 Product trends
- 2.1.3 End-user trends
- 2.1.4 Regional trends
Chapter 3 Electronic Ceramics Industry Insights
- 3.1 Industry segmentation
- 3.2 Industry size and forecast, 2018 - 2032
- 3.2.1 COVID-19 impact on industry landscape
- 3.3 Industry ecosystem analysis
- 3.3.1 Raw material analysis
- 3.3.2 Profit margin analysis
- 3.3.3 Value addition at each stage
- 3.3.4 Distribution channel analysis
- 3.3.5 Vendor matrix
- 3.3.5.1 List of key manufacturers/suppliers
- 3.3.5.2 List of key raw material suppliers
- 3.3.5.3 List of potential customers
- 3.4 Innovation & sustainability
- 3.4.1 Patent analysis
- 3.4.2 Technology landscape
- 3.4.3 Future trends
- 3.5 Industry impact forces
- 3.5.1 Growth drivers
- 3.5.1.1 Growth in the telecommunication sector
- 3.5.1.2 Growing demand from end-use markets
- 3.5.1.3 Stimulating product demand due to the emergence of new technologies
- 3.5.1.4 Rising application of electronic ceramics in medical devices
- 3.5.1.5 Development of low production cost technologies
- 3.5.2 Industry pitfalls & challenges
- 3.5.2.1 Adverse environmental and health impacts associated with the product
- 3.5.2.2 High capital investment associated with the product manufacturing
- 3.5.2.3 High cost of raw material
- 3.5.1 Growth drivers
- 3.6 Regulatory trends
- 3.6.1 U.S.
- 3.6.2 Europe
- 3.6.3 China
- 3.7 Growth potential analysis, 2022
- 3.8 Porter's analysis
- 3.8.1 Supplier power
- 3.8.2 Buyer power
- 3.8.3 Threat of substitutes
- 3.8.4 Threat of new entrants
- 3.8.5 Competitive rivalry
- 3.9 Regional price trends
- 3.9.1 Cost structure analysis
- 3.9.1.1 R&D cost
- 3.9.1.2 Manufacturing & equipment cost
- 3.9.1.3 Raw material cost
- 3.9.1.4 Distribution cost
- 3.9.1.5 Operating cost
- 3.9.1.6 Miscellaneous cost
- 3.9.1 Cost structure analysis
- 3.10 PESTLE analysis
- 3.11 COVID-19 impact on the electronic ceramics industry
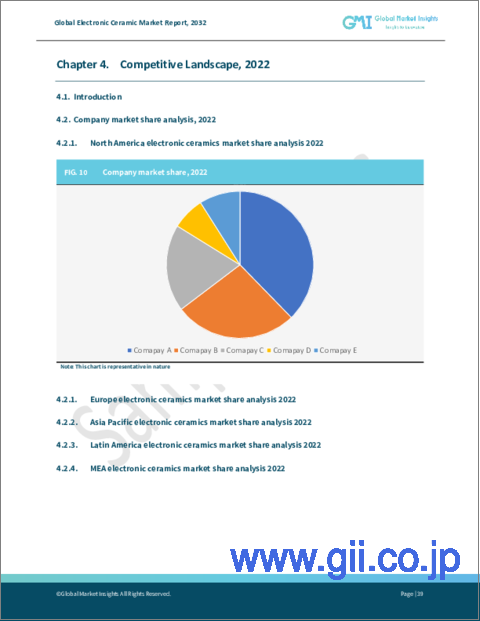
Chapter 4 Competitive Landscape
- 4.1 Introduction
- 4.2 Company market share, 2022
- 4.2.1 North America company market share, 2022
- 4.2.2 Europe company market share, 2022
- 4.2.3 Asia Pacific company market share, 2022
- 4.2.4 Latin America company market share, 2022
- 4.2.5 Middle East & Africa company market share, 2022
- 4.3 Competitive analysis of major market players
- 4.4 Vendor adoption matrix
- 4.5 Strategic dashboard
- 4.6 Top players overview
Chapter 5 Electronic Ceramics Market, By Product
- 5.1 Global electronic ceramics market insights, by product
- 5.2 Ferroelectric ceramics
- 5.2.1 Market estimates and forecasts, 2018 - 2032
- 5.2.2 Market estimates and forecast, product by end-user, 2018 - 2032
- 5.2.3 Market estimates and forecast, by region, 2018 - 2032
- 5.3 Piezoelectric ceramics
- 5.3.1 Market estimates and forecasts, 2018 - 2032
- 5.3.2 Market estimates and forecast, product by end-user, 2018 - 2032
- 5.3.3 Market estimates and forecast, by region, 2018 - 2032
- 5.4 Pyroelectric ceramics
- 5.4.1 Market estimates and forecasts, 2018 - 2032
- 5.4.2 Market estimates and forecast, product by end-user, 2018 - 2032
- 5.4.3 Market estimates and forecast, by region, 2018 - 2032
- 5.5 Others
- 5.5.1 Market estimates and forecasts, 2018 - 2032
- 5.5.2 Market estimates and forecast, product by end-user, 2018 - 2032
- 5.5.3 Market estimates and forecast, by region, 2018 - 2032
Chapter 6 Electronic Ceramics Market, By End-user
- 6.1 Global electronic ceramics market insights, by end-user
- 6.2 Home appliances & consumer electronics
- 6.2.1 Market estimates and forecasts, 2018 - 2032
- 6.2.2 Market estimates and forecast, by region, 2018 - 2032
- 6.3 Healthcare
- 6.3.1 Market estimates and forecasts, 2018 - 2032
- 6.3.2 Market estimates and forecast, by region, 2018 - 2032
- 6.4 Automotive & transportation
- 6.4.1 Market estimates and forecasts, 2018 - 2032
- 6.4.2 Market estimates and forecast, by region, 2018 - 2032
- 6.5 Telecommunication & power transmission
- 6.5.1 Market estimates and forecasts, 2018 - 2032
- 6.5.2 Market estimates and forecast, by region, 2018 - 2032
- 6.6 Others
- 6.6.1 Market estimates and forecasts, 2018 - 2032
- 6.6.2 Market estimates and forecast, by region, 2018 - 2032
Chapter 7 Electronic Ceramics Market, By Region
- 7.1 Global electronic ceramics market regional insights
- 7.2 North America
- 7.2.1 Market estimates and forecast, 2018 - 2032
- 7.2.2 Market estimates and forecast, product by end-user, 2018 - 2032
- 7.2.3 Market estimates and forecast, by end-user, 2018 - 2032
- 7.2.4 U.S.
- 7.2.4.1 Market estimates and forecast, 2018 - 2032
- 7.2.4.2 Market estimates and forecast, product by end-user, 2018 - 2032
- 7.2.4.3 Market estimates and forecast, by end-user, 2018 - 2032
- 7.2.5 Canada
- 7.2.5.1 Market estimates and forecast, 2018 - 2032
- 7.2.5.2 Market estimates and forecast, product by end-user, 2018 - 2032
- 7.2.5.3 Market estimates and forecast, by end-user, 2018 - 2032
- 7.3 Europe
- 7.3.1 Market estimates and forecast, 2018 - 2032
- 7.3.2 Market estimates and forecast, product by end-user, 2018 - 2032
- 7.3.3 Market estimates and forecast, by end-user, 2018 - 2032
- 7.3.4 Germany
- 7.3.4.1 Market estimates and forecast, 2018 - 2032
- 7.3.4.2 Market estimates and forecast, product by end-user, 2018 - 2032
- 7.3.4.3 Market estimates and forecast, by end-user, 2018 - 2032
- 7.3.5 UK
- 7.3.5.1 Market estimates and forecast, 2018 - 2032
- 7.3.5.2 Market estimates and forecast, product by end-user, 2018 - 2032
- 7.3.5.3 Market estimates and forecast, by end-user, 2018 - 2032
- 7.3.6 France
- 7.3.6.1 Market estimates and forecast, 2018 - 2032
- 7.3.6.2 Market estimates and forecast, product by end-user, 2018 - 2032
- 7.3.6.3 Market estimates and forecast, by end-user, 2018 - 2032
- 7.3.7 Spain
- 7.3.7.1 Market estimates and forecast, 2018 - 2032
- 7.3.7.2 Market estimates and forecast, product by end-user, 2018 - 2032
- 7.3.7.3 Market estimates and forecast, by end-user, 2018 - 2032
- 7.3.8 Italy
- 7.3.8.1 Market estimates and forecast, 2018 - 2032
- 7.3.8.2 Market estimates and forecast, product by end-user, 2018 - 2032
- 7.3.8.3 Market estimates and forecast, by end-user, 2018 - 2032
- 7.3.9 Russia
- 7.3.9.1 Market estimates and forecast, 2018 - 2032
- 7.3.9.2 Market estimates and forecast, product by end-user, 2018 - 2032
- 7.3.9.3 Market estimates and forecast, by end-user, 2018 - 2032
- 7.4 Asia Pacific
- 7.4.1 Market estimates and forecast, 2018 - 2032
- 7.4.2 Market estimates and forecast, product by end-user, 2018 - 2032
- 7.4.3 Market estimates and forecast, by end-user, 2018 - 2032
- 7.4.4 China
- 7.4.4.1 Market estimates and forecast, 2018 - 2032
- 7.4.4.2 Market estimates and forecast, product by end-user, 2018 - 2032
- 7.4.4.3 Market estimates and forecast, by end-user, 2018 - 2032
- 7.4.5 India
- 7.4.5.1 Market estimates and forecast, 2018 - 2032
- 7.4.5.2 Market estimates and forecast, product by end-user, 2018 - 2032
- 7.4.5.3 Market estimates and forecast, by end-user, 2018 - 2032
- 7.4.6 Japan
- 7.4.6.1 Market estimates and forecast, 2018 - 2032
- 7.4.6.2 Market estimates and forecast, product by end-user, 2018 - 2032
- 7.4.6.3 Market estimates and forecast, by end-user, 2018 - 2032
- 7.4.7 Australia
- 7.4.7.1 Market estimates and forecast, 2018 - 2032
- 7.4.7.2 Market estimates and forecast, product by end-user, 2018 - 2032
- 7.4.7.3 Market estimates and forecast, by end-user, 2018 - 2032
- 7.4.8 Indonesia
- 7.4.8.1 Market estimates and forecast, 2018 - 2032
- 7.4.8.2 Market estimates and forecast, product by end-user, 2018 - 2032
- 7.4.8.3 Market estimates and forecast, by end-user, 2018 - 2032
- 7.4.9 Malaysia
- 7.4.9.1 Market estimates and forecast, 2018 - 2032
- 7.4.9.2 Market estimates and forecast, product by end-user, 2018 - 2032
- 7.4.9.3 Market estimates and forecast, by end-user, 2018 - 2032
- 7.4.10 South Korea
- 7.4.10.1 Market estimates and forecast, 2018 - 2032
- 7.4.10.2 Market estimates and forecast, product by end-user, 2018 - 2032
- 7.4.10.3 Market estimates and forecast, by end-user, 2018 - 2032
- 7.5 Latin America
- 7.5.1 Market estimates and forecast, 2018 - 2032
- 7.5.2 Market estimates and forecast, product by end-user, 2018 - 2032
- 7.5.3 Market estimates and forecast, by end-user, 2018 - 2032
- 7.5.4 Brazil
- 7.5.4.1 Market estimates and forecast, 2018 - 2032
- 7.5.4.2 Market estimates and forecast, product by end-user, 2018 - 2032
- 7.5.4.3 Market estimates and forecast, by end-user, 2018 - 2032
- 7.5.5 Mexico
- 7.5.5.1 Market estimates and forecast, 2018 - 2032
- 7.5.5.2 Market estimates and forecast, product by end-user, 2018 - 2032
- 7.5.5.3 Market estimates and forecast, by end-user, 2018 - 2032
- 7.6 Middle East & Africa
- 7.6.1 Market estimates and forecast, 2018 - 2032
- 7.6.2 Market estimates and forecast, product by end-user, 2018 - 2032
- 7.6.3 Market estimates and forecast, by end-user, 2018 - 2032
- 7.6.4 South Africa
- 7.6.4.1 Market estimates and forecast, 2018 - 2032
- 7.6.4.2 Market estimates and forecast, product by end-user, 2018 - 2032
- 7.6.4.3 Market estimates and forecast, by end-user, 2018 - 2032
- 7.6.5 UAE
- 7.6.5.1 Market estimates and forecast, 2018 - 2032
- 7.6.5.2 Market estimates and forecast, product by end-user, 2018 - 2032
- 7.6.5.3 Market estimates and forecast, by end-user, 2018 - 2032
- 7.6.6 Saudi Arabia
- 7.6.6.1 Market estimates and forecast, 2018 - 2032
- 7.6.6.2 Market estimates and forecast, product by end-user, 2018 - 2032
- 7.6.6.3 Market estimates and forecast, by end-user, 2018 - 2032
- 7.6.7 Kuwait
- 7.6.7.1 Market estimates and forecast, 2018 - 2032
- 7.6.7.2 Market estimates and forecast, product by end-user, 2018 - 2032
- 7.6.7.3 Market estimates and forecast, by end-user, 2018 - 2032
Chapter 8 Company Profiles
- 8.1 CeramTec Holding GmbH
- 8.1.1 Business Overview
- 8.1.2 Financial Data
- 8.1.3 Product Landscape
- 8.1.4 Strategic Outlook
- 8.1.5 SWOT Analysis
- 8.2 Morgan Advanced Materials
- 8.2.1 Business Overview
- 8.2.2 Financial Data
- 8.2.3 Product Landscape
- 8.2.4 SWOT Analysis
- 8.3 Maruwa Co., Ltd.
- 8.3.1 Business Overview
- 8.3.2 Financial Data
- 8.3.3 Product Landscape
- 8.3.4 Strategic Outlook
- 8.3.5 SWOT Analysis
- 8.4 Central Electronics Limited
- 8.4.1 Business Overview
- 8.4.2 Financial Data
- 8.4.3 Product Landscape
- 8.4.4 SWOT Analysis
- 8.5 Kyocera Corporation
- 8.5.1 Business Overview
- 8.5.2 Financial Data
- 8.5.3 Product Landscape
- 8.5.4 SWOT Analysis
- 8.6 Murata Manufacturing Co., Ltd.
- 8.6.1 Business Overview
- 8.6.2 Financial Data
- 8.6.3 Product Landscape
- 8.6.4 SWOT Analysis
- 8.7 PI Ceramics
- 8.7.1 Business Overview
- 8.7.2 Financial Data
- 8.7.3 Product Landscape
- 8.7.4 Strategic Outlook
- 8.7.5 SWOT Analysis
- 8.8 Sensor Technology Ltd.
- 8.8.1 Business Overview
- 8.8.2 Financial Data
- 8.8.3 Product Landscape
- 8.8.4 Strategic Outlook
- 8.8.5 SWOT Analysis
- 8.9 Vinayak Techno Ceramics
- 8.9.1 Business Overview
- 8.9.2 Financial Data
- 8.9.3 Product Landscape
- 8.9.4 Strategic Outlook
- 8.9.5 SWOT Analysis
- 8.10 Sparkler Ceramics Pvt. Ltd.
- 8.10.1 Business Overview
- 8.10.2 Financial Data
- 8.10.3 Product Landscape
- 8.10.4 Strategic Outlook
- 8.10.5 SWOT Analysis
- 8.11 APC International, Ltd.
- 8.11.1 Business Overview
- 8.11.2 Financial Data
- 8.11.3 Product Landscape
- 8.11.4 Strategic Outlook
- 8.11.5 SWOT Analysis