|
|
市場調査レポート
商品コード
1260684
コラーゲン市場:製品別、供給源別、剤形別、用途別、栄養補助食品、パーソナルケア&化粧品)&予測:2023年~2032年Collagen Market By Product, By Source, By Dosage Form, By Application, Nutraceuticals, Personal care & cosmetics) & Forecast, 2023 - 2032 |
||||||
|
|
|||||||
|
● お客様のご希望に応じて、既存データの加工や未掲載情報(例:国別セグメント)の追加などの対応が可能です。 詳細はお問い合わせください。 |
|||||||


| コラーゲン市場:製品別、供給源別、剤形別、用途別、栄養補助食品、パーソナルケア&化粧品)&予測:2023年~2032年 |
|
出版日: 2023年03月30日
発行: Global Market Insights Inc.
ページ情報: 英文 270 Pages
納期: 2~3営業日
|
- 全表示
- 概要
- 図表
- 目次
世界のコラーゲン市場は、主にパーソナルケア分野の拡大により、2032年まで大幅な成長を遂げると予想されています。
コラーゲン市場は、製品、供給源、形態、用途、地域の観点から二分されています。
製品別では、コラーゲン市場はゼラチンセグメントで特徴付けられると思われます。コラーゲンゼラチンは、タンパク質とアミノ酸の量が多く、機能的に汎用性があり、食品に使用されています。摂取することで肌の弾力をサポートし、脳の働きを高め、体内のコラーゲン量を向上させる。
化粧品、医薬品、調理食品、食品安定剤など幅広く使用されているため、今後、需要が拡大することが予想されます。さらに、グミ、ゼリー、マシュマロ、増粘剤などの需要が急増し、市場の成長をさらに促進すると考えられます。
供給源の観点からは、豚のコラーゲンは市場で大きな需要を示すことになるでしょう。コラーゲンは加工食品に多く使用され、関節や骨、皮膚の健康維持を促進します。健康補助食品と加工食品の需要の増加は、分析期間を通じて市場の成長を促進すると予想されます。
形状別では、カプセルがCAGR7.5%の高成長を遂げると予測されています。カプセルは、錠剤よりも薬物の吸収が良く、効き目が早いなどの利点があります。そのため、コラーゲンを配合したカプセルはより多くの需要が見込まれ、ビジネスに弾みがつくでしょう。
用途別では、ヘルスケア/医薬品分野が2032年まで力強い成長を遂げると予想されています。コラーゲンは、美容整形手術や火傷の患者に広く使用されています。さらに、歯科や整形外科の再建、その他の外科的処置にも幅広く使用されています。医療インフラの増加や拡大が、今後、この分野の成長を促進すると考えられます。
地域別では、北米地域のコラーゲン市場は、分析期間中、CAGR 8.5%の安定した成長率で推移すると思われます。健康的な食生活への志向の高まり、病気の予防、身体能力の向上などにより、栄養補助食品の需要が顕著に増加しており、2023年から2032年の間に市場需要が拡大すると考えられます。
この市場で現在機能している重要な企業には、Nutra Food Ingredients、Connoils LLC、Nitta Gelatin、Gelnex、PB Leiner、Titan Biotech Ltd.、Vital Proteins LLC、Gelita AG、Nippi Inc、Lapi Gelatine SPA、Kenny &Ross Ltd、Weishardt Holding SA、Vinh Hoan Corporation、Amicogen Inc、RousselotおよびCrescent Biotechなどがあります。
目次
第1章 調査手法とスコープ
第2章 エグゼクティブサマリー
第3章 コラーゲン業界洞察
- 業界別セグメンテーション
- 産業規模と予測、2018年~2032年
- 産業エコシステム分析
- 原材料の仕入れ先
- メーカー
- 利益率の動向
- ベンダーマトリクス
- 流通チャネル分析
- コラボレーション/パートナーシップ
- 販売店
- COVID-19が業界のバリューチェーンに与える影響
- 原材料の分析
- COVID-19原料への影響
- テクノロジー情勢
- 規制状況について
- 業界のベストプラクティスと主要な購入基準
- イノベーションとサステナビリティ
- 成長ポテンシャル分析
- 新たなビジネスモデル
- 価格分析
- COVID-19価格動向への影響
- コスト構造分析
- 業界への影響要因
- 促進要因
- 北米:ヘルスケア分野の拡大が業界の成長を促進する
- アジア太平洋地域の飲食品需要の拡大が市場成長を刺激する
- 欧州パーソナルケア分野の拡大が製品需要を喚起する
- 業界の潜在的リスク&課題
- 動物の殺処分に関する厳格な規則が業界の成長を制限する可能性がある
- 促進要因
- 競合情勢、2020年
- 会社別マーケットシェア
- COVIDが消費者の購買行動に与える影響
- 戦略ダッシュボード
- 主要な利害関係者
- ポーターズ分析
- PESTEL分析
- COVID-19のコラーゲン需要への影響(用途別
- 飲食品
- ヘルスケア
- パーソナルケア
- COVID-19の世界経済への影響
第4章 競合情勢、2021年
- イントロダクション
- 地域別企業シェア分析、2021年
- 主要市場プレイヤーの競合分析
- ベンダー採用マトリクス
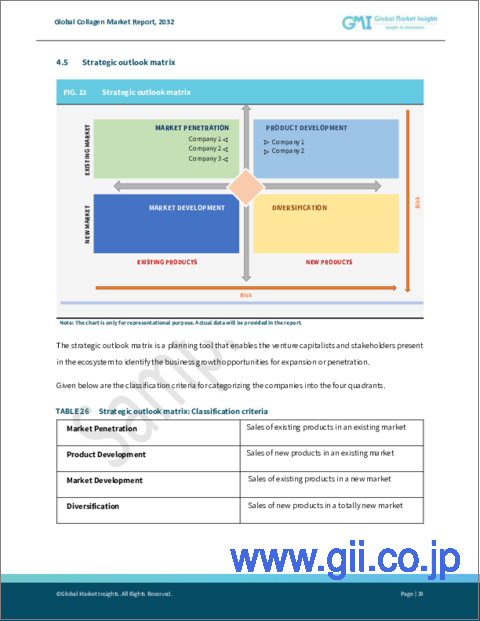
- 戦略的展望マトリクス
第5章 コラーゲン市場:製品別
- 主な製品動向
- ゼラチン
- 世界のコラーゲンの推定・予測、ゼラチン別、2018年~2032年
- 世界のコラーゲンの推定・予測、ゼラチン別、地域別、2018年~2032年
- ペプチド
- 世界のコラーゲンの推定・予測、ペプチド別、2018年~2032年
- 世界のコラーゲンの推定・予測、ペプチド別、地域別、2018年~2032年
第6章 コラーゲン市場:供給元別
- 主な製品動向
- ウシ
- 世界のコラーゲンの推定・予測、ウシ別、2018年~2032年
- 世界のコラーゲンの推定・予測、ウシ別、地域別、2018年~2032年
- ポーシャイン
- 世界のコラーゲンの推定・予測、ブタ別、2018年~2032年
- 世界のコラーゲンの推定・予測、豚肉別、地域別、2018年~2032年
- マリン
- 世界のコラーゲンの推定・予測、海洋別、2018年~2032年
- 世界のコラーゲンの推定・予測、海洋別、地域別、2018年~2032年
- その他
- 世界のコラーゲンの推定・予測、その他別、2018年~2032年
- 世界のコラーゲンの推定・予測、その他別、地域別、2018年~2032年
第7章 コラーゲン市場:剤形別
- 主な剤形動向
- パウダー
- 世界のコラーゲンの推定・予測(粉末別)、2018年~2032年
- 世界のコラーゲンの推定・予測、粉末別、地域別、2018年~2032年
- リキッド
- 世界のコラーゲン推定・予測、液体別、2018年~2032年
- 世界のコラーゲンの推定・予測、液体別、地域別、2018年~2032年
- カプセル
- 世界のコラーゲン推定・予測、カプセル別、2018年~2032年
- 世界のコラーゲンの推定・予測、カプセル別、地域別、2018年~2032年
- その他
- 世界のコラーゲンの推定・予測、その他別、2018年~2032年
- 世界のコラーゲンの推定・予測、その他別、地域別、2018年~2032年
第8章 コラーゲン市場:アプリケーション別
- 主なアプリケーション動向
- 食品
- ヘルスケア
- ニュートラシューティカルズ
- パーソナルケア&コスメティック
- その他
第9章 コラーゲン市場:地域別
- 主な地域動向
- 北米
- 北米コラーゲンの推定・予測、2018年~2032年
- 北米コラーゲンの製品別推定・予測(2018年~2032年
- 北米コラーゲンの推定・予測(供給源別)、2018年~2032年
- 北米コラーゲンの推定・予測(剤形別):2018年~2032年
- 北米コラーゲンの用途別推定・予測(2018年~2032年
- 北米コラーゲンの推定・予測(食品別)、2018年~2032年
- 北米コラーゲンの推定・予測(ヘルスケア別):2018年~2032年
- 北米コラーゲンの推定・予測(栄養補助食品別):2018年~2032年
- 北米コラーゲン推定・予測(パーソナルケア&化粧品別):2018年~2032年
- 欧州
- 欧州コラーゲンの推定・予測、2018年~2032年
- 欧州コラーゲンの製品別推定・予測(2018年~2032年
- 欧州コラーゲンの推定・予測(供給源別)、2018年~2032年
- 欧州コラーゲンの推定・予測(剤形別):2018年~2032年
- 欧州コラーゲンの用途別推定・予測(2018年~2032年
- 欧州コラーゲン食品別推定・予測(2018年~2032年
- 欧州コラーゲンの推定・予測(ヘルスケア別)、2018年~2032年
- 欧州コラーゲンの推定・予測(栄養補助食品別)、2018年~2032年
- 欧州コラーゲン推定・予測(パーソナルケア&化粧品別):2018年~2032年
- アジア太平洋地域
- アジア太平洋コラーゲンの推定・予測、2018年~2032年
- アジア太平洋コラーゲンの製品別推定・予測(2018年~2032年
- アジア太平洋コラーゲンの推定・予測(供給源別)、2018年~2032年
- アジア太平洋コラーゲンの推定・予測、剤形別、2018年~2032年
- アジア太平洋コラーゲンの用途別推定・予測(2018年~2032年
- アジア太平洋コラーゲンの推定・予測(食品別)、2018年~2032年
- アジア太平洋コラーゲンの推定・予測(ヘルスケア別)、2018年~2032年
- アジア太平洋コラーゲンの推定・予測(栄養補助食品別):2018年~2032年
- アジア太平洋コラーゲンの推定・予測(パーソナルケア&化粧品別):2018年~2032年
- ラテンアメリカ
- ラテンアメリカコラーゲンの推定・予測、2018年~2032年
- ラテンアメリカコラーゲンの製品別推定・予測(2018年~2032年
- ラテンアメリカコラーゲンの推定・予測(供給源別):2018年~2032年
- ラテンアメリカコラーゲンの推定・予測(剤形別):2018年~2032年
- ラテンアメリカコラーゲンの用途別推定・予測(2018年~2032年
- ラテンアメリカコラーゲンの推定・予測(食品別):2018年~2032年
- ラテンアメリカコラーゲンの推定・予測(ヘルスケア別):2018年~2032年
- ラテンアメリカコラーゲンの推定・予測(栄養補助食品別):2018年~2032年
- ラテンアメリカコラーゲンの推定・予測(パーソナルケア&化粧品別):2018年~2032年
- 中東・アフリカ地域
- 中東・アフリカコラーゲンの推定・予測、2018年~2032年
- 中東・アフリカコラーゲンの製品別推定・予測(2018年~2032年
- 中東・アフリカコラーゲンの推定・予測(供給源別)、2018年~2032年
- 中東・アフリカコラーゲンの推定・予測(剤形別):2018年~2032年
- 中東・アフリカコラーゲンの用途別推定・予測(2018年~2032年
- 中東・アフリカ食品別コラーゲン推定・予測(2018年~2032年
- 中東・アフリカコラーゲンの推定・予測(ヘルスケア別):2018年~2032年
- 中東・アフリカコラーゲンの推定・予測(栄養補助食品別):2018年~2032年
- 中東・アフリカパーソナルケア・化粧品別コラーゲン推定・予測(2018年~2032年
第10章 企業プロファイル
- Gelita AG
- Nitta Gelatine, Inc
- Weishardt Group
- Darling Ingredients
- Nippi Inc.
- Vinh Hoan Corporation
- JuncàGelatines, S.L
- Connoils
- Nutra Food Ingredients
- Vital Proteins
- Gelnex
- Rousselot International
- Amicogen, Inc
- ChinaTech Peptide Co. Ltd.
- Norland Products
Data Tables
- TABLE 1 Collagen 360 degree synopsis, 2023 - 2032
- TABLE 2 Global Collagen estimates & forecast, 2018 - 2032, (Kilo Tons) (USD Million)
- TABLE 3 Global Collagen volume estimates & forecast, by region, 2018 - 2032 (Kilo Tons)
- TABLE 4 Global Collagen revenue estimates & forecast, by region, 2018 - 2032 (USD Million)
- TABLE 5 Global Collagen volume estimates & forecast, by product, 2018 - 2032 (Kilo Tons)
- TABLE 6 Global Collagen revenue estimates & forecast, by product, 2018 - 2032 (USD Million)
- TABLE 7 Global Collagen volume estimates & forecast, by source, 2018 - 2032, (Kilo Tons)
- TABLE 8 Global Collagen revenue estimates & forecast, by source, 2018 - 2032 (USD Million)
- TABLE 9 Global Collagen volume estimates & forecast, by dosage form, 2018 - 2032, (Kilo Tons)
- TABLE 10 Global Collagen revenue estimates & forecast, by dosage form, 2018 - 2032 (USD Million)
- TABLE 11 Global Collagen volume estimates & forecast, by application, 2018 - 2032, (Kilo Tons)
- TABLE 12 Global Collagen revenue estimates & forecast, by application, 2018 - 2032 (USD Million)
- TABLE 13 Global Collagen volume estimates & forecast, by food, 2018 - 2032, (Kilo Tons)
- TABLE 14 Global Collagen revenue estimates & forecast, by food, 2018 - 2032 (USD Million)
- TABLE 15 Global Collagen volume estimates & forecast, by healthcare, 2018 - 2032, (Kilo Tons)
- TABLE 16 Global Collagen revenue estimates & forecast, by healthcare, 2018 - 2032 (USD Million)
- TABLE 17 Global Collagen volume estimates & forecast, by nutraceuticals, 2018 - 2032, (Kilo Tons)
- TABLE 18 Global Collagen revenue estimates & forecast, by nutraceuticals, 2018 - 2032 (USD Million)
- TABLE 19 Global Collagen volume estimates & forecast, by personal care & cosmetics, 2018 - 2032, (Kilo Tons)
- TABLE 20 Global Collagen revenue estimates & forecast, by personal care & cosmetics, 2018 - 2032 (USD Million)
- TABLE 23 Strategy dashboard
- TABLE 24 Key stakeholders
- TABLE 25 Global Collagen estimates and forecasts, by gelatin, 2018 - 2032, (Kilo Tons) (USD Million)
- TABLE 26 Global Collagen volume estimates & forecast, by gelatin, by region 2018 - 2032, (Kilo Tons)
- TABLE 27 Global Collagen revenue estimates & forecast, by gelatin by region, 2018 - 2032, (USD Million)
- TABLE 28 Global Collagen estimates and forecasts, 2018 - 2032,by peptides (Kilo Tons) (USD Million)
- TABLE 29 Global Collagen volume estimates & forecast, by peptides, by region, 2018 - 2032, (Kilo Tons)
- TABLE 30 Global Collagen revenue estimates & forecast, by peptides, by region, 2018 - 2032, (USD Million)
- TABLE 31 Global Collagen estimates and forecasts, by bovine, 2018 - 2032, (Kilo Tons) (USD Million)
- TABLE 32 Global Collagen volume estimates & forecast, by bovine, by region 2018 - 2032, (Kilo Tons)
- TABLE 33 Global Collagen revenue estimates & forecast, by bovine by region, 2018 - 2032, (USD Million)
- TABLE 34 Global Collagen estimates and forecasts, 2018 - 2032,by porcine (Kilo Tons) (USD Million)
- TABLE 35 Global Collagen volume estimates & forecast, by porcine, by region, 2018 - 2032, (Kilo Tons)
- TABLE 36 Global Collagen revenue estimates & forecast, by porcine, by region, 2018 - 2032, (USD Million)
- TABLE 37 Global Collagen estimates and forecasts, 2018 - 2032,by marine (Kilo Tons) (USD Million)
- TABLE 38 Global Collagen volume estimates & forecast, by marine, by region, 2018 - 2032, (Kilo Tons)
- TABLE 39 Global Collagen revenue estimates & forecast, by porcine, by marine, 2018 - 2032, (USD Million)
- TABLE 40 Global Collagen estimates and forecasts, 2018 - 2032,by others (Kilo Tons) (USD Million)
- TABLE 41 Global Collagen volume estimates & forecast, by others, by region, 2018 - 2032, (Kilo Tons)
- TABLE 42 Global Collagen revenue estimates & forecast, by others, by region, 2018 - 2032, (USD Million)
- TABLE 43 Global Collagen estimates and forecasts, by powder, 2018 - 2032, (Kilo Tons) (USD Million)
- TABLE 44 Global Collagen volume estimates & forecast, by powder, by region 2018 - 2032, (Kilo Tons)
- TABLE 45 Global Collagen revenue estimates & forecast, by powder by region, 2018 - 2032, (USD Million)
- TABLE 46 Global Collagen estimates and forecasts, 2018 - 2032,by liquid (Kilo Tons) (USD Million)
- TABLE 47 Global Collagen volume estimates & forecast, by liquid, by region, 2018 - 2032, (Kilo Tons)
- TABLE 48 Global Collagen revenue estimates & forecast, by liquid, by region, 2018 - 2032, (USD Million)
- TABLE 49 Global Collagen estimates and forecasts, 2018 - 2032,by capsule (Kilo Tons) (USD Million)
- TABLE 50 Global Collagen volume estimates & forecast, by capsule, by region, 2018 - 2032, (Kilo Tons)
- TABLE 51 Global Collagen revenue estimates & forecast, by capsule, by marine, 2018 - 2032, (USD Million)
- TABLE 52 Global Collagen estimates and forecasts, 2018 - 2032,by others (Kilo Tons) (USD Million)
- TABLE 53 Global Collagen volume estimates & forecast, by others, by region, 2018 - 2032, (Kilo Tons)
- TABLE 54 Global Collagen revenue estimates & forecast, by region, by others, 2018 - 2032, (USD Million)
- TABLE 55 Global collagen market estimates and forecasts, by food, 2018 - 2032, (Kilo Tons) (USD Million)
- TABLE 56 Global collagen market estimates and forecasts, by region, by food 2018 - 2032, (Kilo Tons)
- TABLE 57 Global collagen market estimates and forecasts, by food, by region, 2018 - 2032, (USD Million)
- TABLE 58 Global collagen market estimates and forecasts, by snacks & cereals,2018 - 2032, (Kilo Tons) (USD Million)
- TABLE 59 Global collagen market estimates and forecasts, by snacks & cereals, by region, 2018 - 2032, (Kilo Tons)
- TABLE 60 Global collagen market estimates and forecasts, by snacks & cereals, by region, 2018 - 2032, (USD Million)
- TABLE 61 Global collagen market estimates and forecasts, by dairy products,2018 - 2032, (Kilo Tons) (USD Million)
- TABLE 62 Global collagen market estimates and forecasts, by dairy products, by region, 2018 - 2032, (Kilo Tons)
- TABLE 63 Global collagen market estimates and forecasts, by dairy products, by region, 2018 - 2032, (USD Million)
- TABLE 64 Global collagen market estimates and forecasts, by bakery & confectionary,2018 - 2032, (Kilo Tons) (USD Million)
- TABLE 65 Global collagen market estimates and forecasts, by bakery & confectionary, by region, 2018 - 2032, (Kilo Tons)
- TABLE 66 Global collagen market estimates and forecasts, by bakery & confectionary, by region, 2018 - 2032, (USD Million)
- TABLE 67 Global collagen market estimates and forecasts, by others,2018 - 2032, (Kilo Tons) (USD Million)
- TABLE 68 Global collagen market estimates and forecasts, by others, by region, 2018 - 2032, (Kilo Tons)
- TABLE 69 Global collagen market estimates and forecasts, by others, by region, 2018 - 2032, (USD Million)
- TABLE 70 Global collagen market estimates and forecasts, by healthcare, 2018 - 2032, (Kilo Tons) (USD Million)
- TABLE 71 Global collagen market estimates and forecasts, by region, by healthcare 2018 - 2032, (Kilo Tons)
- TABLE 72 Global collagen market estimates and forecasts, by healthcare, by region, 2018 - 2032, (USD Million)
- TABLE 73 Global collagen market estimates and forecasts, by orthopedic,2018 - 2032, (Kilo Tons) (USD Million)
- TABLE 74 Global collagen market estimates and forecasts, by orthopedic, by region, 2018 - 2032, (Kilo Tons)
- TABLE 75 Global collagen market estimates and forecasts, by orthopedic, by region, 2018 - 2032, (USD Million)
- TABLE 76 Global collagen market estimates and forecasts, by dental,2018 - 2032, (Kilo Tons) (USD Million)
- TABLE 77 Global collagen market estimates and forecasts, by dental, by region, 2018 - 2032, (Kilo Tons)
- TABLE 78 Global collagen market estimates and forecasts, by dental, by region, 2018 - 2032, (USD Million)
- TABLE 79 Global collagen market estimates and forecasts, by wound care ,2018 - 2032, (Kilo Tons) (USD Million)
- TABLE 80 Global collagen market estimates and forecasts, by wound care, by region, 2018 - 2032, (Kilo Tons)
- TABLE 81 Global collagen market estimates and forecasts, by wound care, by region, 2018 - 2032, (USD Million)
- TABLE 82 Global collagen market estimates and forecasts, by others,2018 - 2032, (Kilo Tons) (USD Million)
- TABLE 83 Global collagen market estimates and forecasts, by others, by region, 2018 - 2032, (Kilo Tons)
- TABLE 84 Global collagen market estimates and forecasts, by others, by region, 2018 - 2032, (USD Million)
- TABLE 85 Global collagen market estimates and forecasts, by nutraceuticals, 2018 - 2032, (Kilo Tons) (USD Million)
- TABLE 86 Global collagen market estimates and forecasts, by region, by nutraceuticals 2018 - 2032, (Kilo Tons)
- TABLE 87 Global collagen market estimates and forecasts, by nutraceuticals, by region, 2018 - 2032, (USD Million)
- TABLE 88 Global collagen market estimates and forecasts, by dietary supplements,2018 - 2032, (Kilo Tons) (USD Million)
- TABLE 89 Global collagen market estimates and forecasts, by dietary supplements, by region, 2018 - 2032, (Kilo Tons)
- TABLE 90 Global collagen market estimates and forecasts, by dietary supplements, by region, 2018 - 2032, (USD Million)
- TABLE 91 Global collagen market estimates and forecasts, by functional food,2018 - 2032, (Kilo Tons) (USD Million)
- TABLE 92 Global collagen market estimates and forecasts, by functional food, by region, 2018 - 2032, (Kilo Tons)
- TABLE 93 Global collagen market estimates and forecasts, by functional food, by region, 2018 - 2032, (USD Million)
- TABLE 94 Global collagen market estimates and forecasts, by others,2018 - 2032, (Kilo Tons) (USD Million)
- TABLE 95 Global collagen market estimates and forecasts, by others, by region, 2018 - 2032, (Kilo Tons)
- TABLE 96 Global collagen market estimates and forecasts, by others, by region, 2018 - 2032, (USD Million)
- TABLE 97 Global collagen market estimates and forecasts, by personal care & cosmetics, 2018 - 2032, (Kilo Tons) (USD Million)
- TABLE 98 Global collagen market estimates and forecasts, by region, by personal care & cosmetics 2018 - 2032, (Kilo Tons)
- TABLE 99 Global collagen market estimates and forecasts, by personal care & cosmetics, by region, 2018 - 2032, (USD Million)
- TABLE 100 Global collagen market estimates and forecasts, by skin care,2018 - 2032, (Kilo Tons) (USD Million)
- TABLE 101 Global collagen market estimates and forecasts, by skin care, by region, 2018 - 2032, (Kilo Tons)
- TABLE 102 Global collagen market estimates and forecasts, by skin care, by region, 2018 - 2032, (USD Million)
- TABLE 103 Global collagen market estimates and forecasts, by hair care,2018 - 2032, (Kilo Tons) (USD Million)
- TABLE 104 Global collagen market estimates and forecasts, by hair care, by region, 2018 - 2032, (Kilo Tons)
- TABLE 105 Global collagen market estimates and forecasts, by hair care, by region, 2018 - 2032, (USD Million)
- TABLE 106 Global collagen market from personal care & cosmetics estimates and forecasts, by others,2018 - 2032, (Kilo Tons) (USD Million)
- TABLE 107 Global collagen market from personal care & cosmetics estimates and forecasts, by others, by region, 2018 - 2032, (Kilo Tons)
- TABLE 108 Global collagen market from personal care & cosmetics estimates and forecasts, by others, by region, 2018 - 2032, (USD Million)
- TABLE 109 Global collagen market estimates and forecasts, by others, 2018 - 2032, (Kilo Tons) (USD Million)
- TABLE 110 Global collagen market estimates and forecasts, by region, by others 2018 - 2032, (Kilo Tons)
- TABLE 111 Global collagen market estimates and forecasts, by others, by region, 2018 - 2032, (USD Million)
- TABLE 112 North America Collagen estimates and forecast, 2018 - 2032, (Kilo Tons) (USD Million)
- TABLE 113 North America Collagen volume estimates & forecast, by product, 2018 - 2032, (Kilo Tons)
- TABLE 114 North America Collagen revenue estimates & forecast, by product, 2018 - 2032, (USD Million)
- TABLE 115 North America Collagen volume estimates & forecast, by source, 2018 - 2032, (Kilo Tons)
- TABLE 116 North America Collagen revenue estimates & forecast, by source, 2018 - 2032, (USD Million)
- TABLE 117 North America Collagen volume estimates & forecast, by dosage form, 2018 - 2032, (Kilo Tons)
- TABLE 118 North America Collagen revenue estimates & forecast, by dosage form, 2018 - 2032, (USD Million)
- TABLE 119 North America Collagen volume estimates & forecast, by application, 2018 - 2032, (Kilo Tons)
- TABLE 120 North America Collagen revenue estimates & forecast, by application, 2018 - 2032, (USD Million)
- TABLE 121 North America Collagen volume estimates & forecast, by food, 2018 - 2032, (Kilo Tons)
- TABLE 122 North America Collagen revenue estimates & forecast, by food, 2018 - 2032, (USD Million)
- TABLE 123 North America Collagen volume estimates & forecast, by healthcare, 2018 - 2032, (Kilo Tons)
- TABLE 124 North America Collagen revenue estimates & forecast, by healthcare, 2018 - 2032, (USD Million)
- TABLE 125 North America Collagen volume estimates & forecast, by nutraceuticals, 2018 - 2032, (Kilo Tons)
- TABLE 126 North America Collagen revenue estimates & forecast, by nutraceuticals, 2018 - 2032, (USD Million)
- TABLE 127 North America Collagen volume estimates & forecast, by personal care & cosmetics, 2018 - 2032, (Kilo Tons)
- TABLE 128 North America Collagen revenue estimates & forecast, by personal care & cosmetics, 2018 - 2032, (USD Million)
- TABLE 129 Europe Collagen estimates and forecast, 2018 - 2032, (Kilo Tons) (USD Million)
- TABLE 130 Europe Collagen volume estimates & forecast, by product, 2018 - 2032, (Kilo Tons)
- TABLE 131 Europe Collagen revenue estimates & forecast, by product, 2018 - 2032, (USD Million)
- TABLE 132 Europe Collagen volume estimates & forecast, by source, 2018 - 2032, (Kilo Tons)
- TABLE 133 Europe Collagen revenue estimates & forecast, by source, 2018 - 2032, (USD Million)
- TABLE 134 Europe Collagen volume estimates & forecast, by dosage form, 2018 - 2032, (Kilo Tons)
- TABLE 135 Europe Collagen revenue estimates & forecast, by dosage form, 2018 - 2032, (USD Million)
- TABLE 136 Europe Collagen volume estimates & forecast, by application, 2018 - 2032, (Kilo Tons)
- TABLE 137 Europe Collagen revenue estimates & forecast, by application, 2018 - 2032, (USD Million)
- TABLE 138 Europe Collagen volume estimates & forecast, by food, 2018 - 2032, (Kilo Tons)
- TABLE 139 Europe Collagen revenue estimates & forecast, by food, 2018 - 2032, (USD Million)
- TABLE 140 Europe Collagen volume estimates & forecast, by healthcare, 2018 - 2032, (Kilo Tons)
- TABLE 141 Europe Collagen revenue estimates & forecast, by healthcare, 2018 - 2032, (USD Million)
- TABLE 142 Europe Collagen volume estimates & forecast, by nutraceuticals, 2018 - 2032, (Kilo Tons)
- TABLE 143 Europe Collagen revenue estimates & forecast, by nutraceuticals, 2018 - 2032, (USD Million)
- TABLE 144 Europe Collagen volume estimates & forecast, by personal care & cosmetics, 2018 - 2032, (Kilo Tons)
- TABLE 145 Europe Collagen revenue estimates & forecast, by personal care & cosmetics, 2018 - 2032, (USD Million)
- TABLE 146 Asia Pacific Collagen estimates and forecast, 2018 - 2032, (Kilo Tons) (USD Million)
- TABLE 147 Asia Pacific Collagen volume estimates & forecast, by product, 2018 - 2032, (Kilo Tons)
- TABLE 148 Asia Pacific Collagen revenue estimates & forecast, by product, 2018 - 2032, (USD Million)
- TABLE 149 Asia Pacific Collagen volume estimates & forecast, by source, 2018 - 2032, (Kilo Tons)
- TABLE 150 Asia Pacific Collagen revenue estimates & forecast, by source, 2018 - 2032, (USD Million)
- TABLE 151 Asia Pacific Collagen volume estimates & forecast, by dosage form, 2018 - 2032, (Kilo Tons)
- TABLE 152 Asia Pacific Collagen revenue estimates & forecast, by dosage form, 2018 - 2032, (USD Million)
- TABLE 153 Asia Pacific Collagen volume estimates & forecast, by application, 2018 - 2032, (Kilo Tons)
- TABLE 154 Asia Pacific Collagen revenue estimates & forecast, by application, 2018 - 2032, (USD Million)
- TABLE 155 Asia Pacific Collagen volume estimates & forecast, by food, 2018 - 2032, (Kilo Tons)
- TABLE 156 Asia Pacific Collagen revenue estimates & forecast, by food, 2018 - 2032, (USD Million)
- TABLE 157 Asia Pacific Collagen volume estimates & forecast, by healthcare, 2018 - 2032, (Kilo Tons)
- TABLE 158 Asia Pacific Collagen revenue estimates & forecast, by healthcare, 2018 - 2032, (USD Million)
- TABLE 159 Asia Pacific Collagen volume estimates & forecast, by nutraceuticals, 2018 - 2032, (Kilo Tons)
- TABLE 160 Asia Pacific Collagen revenue estimates & forecast, by nutraceuticals, 2018 - 2032, (USD Million)
- TABLE 161 Asia Pacific Collagen volume estimates & forecast, by personal care & cosmetics, 2018 - 2032, (Kilo Tons)
- TABLE 162 Asia Pacific Collagen revenue estimates & forecast, by personal care & cosmetics, 2018 - 2032, (USD Million)
- TABLE 163 Latin America Collagen estimates and forecast, 2018 - 2032, (Kilo Tons) (USD Million)
- TABLE 164 Latin America Collagen volume estimates & forecast, by product, 2018 - 2032, (Kilo Tons)
- TABLE 165 Latin America Collagen revenue estimates & forecast, by product, 2018 - 2032, (USD Million)
- TABLE 166 Latin America Collagen volume estimates & forecast, by source, 2018 - 2032, (Kilo Tons)
- TABLE 167 Latin America Collagen revenue estimates & forecast, by source, 2018 - 2032, (USD Million)
- TABLE 168 Latin America Collagen volume estimates & forecast, by dosage form, 2018 - 2032, (Kilo Tons)
- TABLE 169 Latin America Collagen revenue estimates & forecast, by dosage form, 2018 - 2032, (USD Million)
- TABLE 170 Latin America Collagen volume estimates & forecast, by application, 2018 - 2032, (Kilo Tons)
- TABLE 171 Latin America Collagen revenue estimates & forecast, by application, 2018 - 2032, (USD Million)
- TABLE 172 Latin America Collagen volume estimates & forecast, by food, 2018 - 2032, (Kilo Tons)
- TABLE 173 Latin America Collagen revenue estimates & forecast, by food, 2018 - 2032, (USD Million)
- TABLE 174 Latin America Collagen volume estimates & forecast, by healthcare, 2018 - 2032, (Kilo Tons)
- TABLE 175 Latin America Collagen revenue estimates & forecast, by healthcare, 2018 - 2032, (USD Million)
- TABLE 176 Latin America Collagen volume estimates & forecast, by nutraceuticals, 2018 - 2032, (Kilo Tons)
- TABLE 177 Latin America Collagen revenue estimates & forecast, by nutraceuticals, 2018 - 2032, (USD Million)
- TABLE 178 Latin America Collagen volume estimates & forecast, by personal care & cosmetics, 2018 - 2032, (Kilo Tons)
- TABLE 179 Latin America Collagen revenue estimates & forecast, by personal care & cosmetics, 2018 - 2032, (USD Million)
- TABLE 180 Middle East & Africa Collagen estimates and forecast, 2018 - 2032, (Kilo Tons) (USD Million)
- TABLE 181 Middle East & Africa Collagen volume estimates & forecast, by product, 2018 - 2032, (Kilo Tons)
- TABLE 182 Middle East & Africa Collagen revenue estimates & forecast, by product, 2018 - 2032, (USD Million)
- TABLE 183 Middle East & Africa Collagen volume estimates & forecast, by source, 2018 - 2032, (Kilo Tons)
- TABLE 184 Middle East & Africa Collagen revenue estimates & forecast, by source, 2018 - 2032, (USD Million)
- TABLE 185 Middle East & Africa Collagen volume estimates & forecast, by dosage form, 2018 - 2032, (Kilo Tons)
- TABLE 186 Middle East & Africa Collagen revenue estimates & forecast, by dosage form, 2018 - 2032, (USD Million)
- TABLE 187 Middle East & Africa Collagen volume estimates & forecast, by application, 2018 - 2032, (Kilo Tons)
- TABLE 188 Middle East & Africa Collagen revenue estimates & forecast, by application, 2018 - 2032, (USD Million)
- TABLE 189 Middle East & Africa Collagen volume estimates & forecast, by food, 2018 - 2032, (Kilo Tons)
- TABLE 190 Middle East & Africa Collagen revenue estimates & forecast, by food, 2018 - 2032, (USD Million)
- TABLE 191 Middle East & Africa Collagen volume estimates & forecast, by healthcare, 2018 - 2032, (Kilo Tons)
- TABLE 192 Middle East & Africa Collagen revenue estimates & forecast, by healthcare, 2018 - 2032, (USD Million)
- TABLE 193 Middle East & Africa Collagen volume estimates & forecast, by nutraceuticals, 2018 - 2032, (Kilo Tons)
- TABLE 194 Middle East & Africa Collagen revenue estimates & forecast, by nutraceuticals, 2018 - 2032, (USD Million)
- TABLE 195 Middle East & Africa Collagen volume estimates & forecast, by personal care & cosmetics, 2018 - 2032, (Kilo Tons)
- TABLE 196 Middle East & Africa Collagen revenue estimates & forecast, by personal care & cosmetics, 2018 - 2032, (USD Million)
Charts & Figures
- FIG. 1 Industry segmentation
- FIG. 2 Global Collagen market estimates and forecast, (KT) (USD Million), 2018 - 2032
- FIG. 4 Cost structure analysis
- FIG. 5 Company Market Share, 2019
- FIG. 6 Porters analysis
- FIG. 7 PESTEL analysis
- FIG. 8 SWOT Analysis, Gelita AG
- FIG. 9 SWOT Analysis, Nitta Gelatine, Inc
- FIG. 10 SWOT Analysis, Weishardt Group
- FIG. 11 SWOT Analysis, Darling Ingredients
- FIG. 12 SWOT Analysis, Nippi Inc.
- FIG. 13 SWOT Analysis, Vinh Hoan Corporation
- FIG. 14 SWOT Analysis, Juncà Gelatines, S.L
- FIG. 15 SWOT Analysis, Connoils
- FIG. 16 SWOT Analysis, Nutra Food Ingredients
- FIG. 17 SWOT Analysis, Vital Proteins
- FIG. 18 SWOT Analysis, Gelnex
- FIG. 19 SWOT Analysis, Rousselot International
- FIG. 20 SWOT Analysis, Amicogen Inc
- FIG. 21 SWOT Analysis, ChinaTech Peptide Co. Ltd
- FIG. 22 SWOT Analysis, Norland Products Inc
Global collagen market is set to witness substantial growth through 2032 primarily owing to the expanding personal care sector.
Overall, the collagen market has been bifurcated in terms of product, source, form, application, and region.
On the basis of product, the collagen market is likely to be characterized by the gelatin segment. Collagen gelatins have a good amount of protein and amino acid and are functionally versatile and used in food products. Its consumption supports skin elasticity, boosts brain function, and improves the amount of collagen in the body.
Since it is widely used in cosmetics, medicines, food preparation, and food stabilizer, the demand for this segment is likely to be bolstered in the upcoming time. Moreover, a recognizable surge in the demand for gummies, jellies, marshmallows, and thickening agents would further propel the market progression.
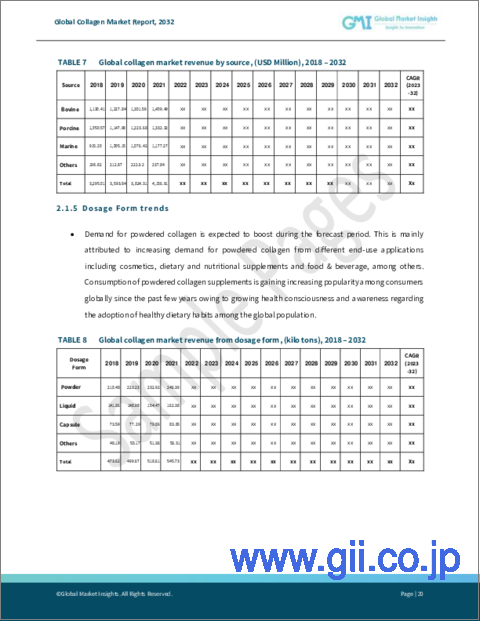
In terms of source, the porcine collagen segment is set to witness huge demand in the market. It is mostly used in processed food products and promotes healthy joints, bones, and skin. Increasing demand for health supplements and processed food is expected to spur market growth through the analysis timeframe.
Based on form, the capsules segment is set to witness robust growth of 7.5% CAGR through the projected timespan. Capsules have certain advantages including faster reliefs and better drug absorption and are more effective than tablets. Hence, collagen-infused capsules will witness more demand, thereby providing impetus to the business.
In the context of application, the healthcare/pharmaceutical segment is set to witness strong growth through 2032. Collagen is extensively used in cosmetic surgery and with burn patients. Additionally, they are also used in a range of dental and orthopedic reconstructions and in other surgical procedures. Increasing and expanding medical infrastructure is going to foster the segmental growth in the upcoming time.
In the regional context, the collagen market in the North America region is likely to grow at a steady rate of 8.5% CAGR through the analyzed timeframe. There is a noticeable increase in the demand for nutraceutical products due to a rising inclination toward healthy food habits, prevention of diseases, and a boost in physical performance, which will augment the market demand between 2023 and 2032.
Some of the important companies, that are currently functioning in this market are Nutra Food Ingredients, Connoils LLC, Nitta Gelatin, Gelnex, PB Leiner, Titan Biotech Ltd., Vital Proteins LLC, Gelita AG, Nippi Inc, Lapi Gelatine SPA, Kenny & Ross Ltd, Weishardt Holding SA, Vinh Hoan Corporation, Amicogen Inc, Rousselot, and Crescent Biotech.
Table of Contents
Chapter 1 Methodology & Scope
- 1.1 Market Definitions
- 1.2 Base Estimates & Calculations
- 1.3 Data Sources
- 1.3.1 Primary
- 1.3.2 Secondary
- 1.3.2.1 Paid Sources
- 1.3.2.2 Public Sources
Chapter 2 Executive Summary
- 2.1 Collagen 360 degree synopsis, 2021 - 2027
- 2.1.1 Business trends
- 2.1.2 Regional trends
- 2.1.3 Product trends
- 2.1.4 Source trends
- 2.1.5 Dosage form trends
- 2.1.6 Application trends
Chapter 3 Collagen Industry Insights
- 3.1 Industry segmentation
- 3.2 Industry size and forecast, 2018 - 2032
- 3.3 Industry ecosystem analysis
- 3.3.1 Raw material suppliers
- 3.3.2 Manufacturers
- 3.3.3 Profit margin trends
- 3.3.4 Vendor Matrix
- 3.3.5 Distribution channel analysis
- 3.3.5.1 Collaborations/Partnerships
- 3.3.5.2 Distributors
- 3.3.6 Impact of COVID-19 on industry value chain
- 3.4 Raw Material Analysis
- 3.4.1 COVID-19 Impact on raw materials
- 3.5 Technology landscape
- 3.6 Regulatory Landscape
- 3.7 Industry best practices & key buying criteria
- 3.8 Innovation & sustainability
- 3.9 Growth Potential Analysis
- 3.9.1 Emerging business models
- 3.10 Pricing Analysis
- 3.10.1 COVID-19 Impact on pricing trends
- 3.10.2 Cost structure analysis
- 3.11 Industry impact forces
- 3.11.1 Growth drivers
- 3.11.1.1 North America: Rising healthcare sector will foster industry growth
- 3.11.1.2 Asia Pacific: Growing food and beverage demand will stimulate market growth
- 3.11.1.3 Europe: Growing personal care sector will stimulate product demand
- 3.11.2 Industry challenges & pitfalls
- 3.11.2.1 Stringent rules for animal killing may restrict industry growth
- 3.11.1 Growth drivers
- 3.12 Competitive landscape, 2020
- 3.12.1 Company Market Share
- 3.12.2 Impact of COVID on consumer buying behaviour
- 3.12.3 Strategy dashboard
- 3.12.4 Key stakeholders
- 3.13 Porters analysis
- 3.14 PESTEL analysis
- 3.15 Impact of COVID-19 on collagen demand, by application
- 3.15.1 Food & Beverage
- 3.15.2 Healthcare
- 3.15.3 Personal Care
- 3.16 Impact of COVID-19 on world economy
Chapter 4 Competitive Landscape, 2021
- 4.1 Introduction
- 4.2 Company market share analysis by region, 2021
- 4.3 Competitive analysis of major market players
- 4.4 Vendor adoption matrix
- 4.5 Strategic outlook matrix
Chapter 5 Collagen Market, By Product
- 5.1 Key product trends
- 5.2 Gelatin
- 5.2.1 Global collagen estimates and forecasts, by gelatin, 2018 - 2032, (Kilo Tons) (USD Million)
- 5.2.2 Global Collagen estimates and forecasts, by gelatin, by region, 2018 - 2032, (Kilo Tons) (USD Million)
- 5.3 Peptides
- 5.3.1 Global Collagen estimates and forecasts, by peptides, 2018 - 2032, (Kilo Tons) (USD Million)
- 5.3.2 Global Collagen estimates and forecasts, by peptides, by region, 2018 - 2032, (Kilo Tons) (USD Million)
Chapter 6 Collagen Market, By Source
- 6.1 Key product trends
- 6.2 Bovine
- 6.2.1 Global collagen estimates and forecasts, by bovine, 2018 - 2032, (Kilo Tons) (USD Million)
- 6.2.2 Global Collagen estimates and forecasts, by bovine, by region, 2018 - 2032, (Kilo Tons) (USD Million)
- 6.3 Porcine
- 6.3.1 Global Collagen estimates and forecasts, by porcine, 2018 - 2032, (Kilo Tons) (USD Million)
- 6.3.2 Global Collagen estimates and forecasts, by porcine, by region, 2018 - 2032, (Kilo Tons) (USD Million)
- 6.4 Marine
- 6.4.1 Global Collagen estimates and forecasts, by marine, 2018 - 2032, (Kilo Tons) (USD Million)
- 6.4.2 Global Collagen estimates and forecasts, by marine, by region, 2018 - 2032, (Kilo Tons) (USD Million)
- 6.5 Others
- 6.5.1 Global Collagen estimates and forecasts, by others, 2018 - 2032, (Kilo Tons) (USD Million)
- 6.5.2 Global Collagen estimates and forecasts, by others, by region, 2018 - 2032, (Kilo Tons) (USD Million)
Chapter 7 Collagen Market, By Dosage Form
- 7.1 Key dosage form trends
- 7.2 Powder
- 7.2.1 Global collagen estimates and forecasts, by powder, 2018 - 2032, (Kilo Tons) (USD Million)
- 7.2.2 Global Collagen estimates and forecasts, by powder, by region, 2018 - 2032, (Kilo Tons) (USD Million)
- 7.3 Liquid
- 7.3.1 Global Collagen estimates and forecasts, by liquid, 2018 - 2032, (Kilo Tons) (USD Million)
- 7.3.2 Global Collagen estimates and forecasts, by liquid, by region, 2018 - 2032, (Kilo Tons) (USD Million)
- 7.4 Capsule
- 7.4.1 Global Collagen estimates and forecasts, by capsule, 2018 - 2032, (Kilo Tons) (USD Million)
- 7.4.2 Global Collagen estimates and forecasts, by capsule, by region, 2018 - 2032, (Kilo Tons) (USD Million)
- 7.5 Others
- 7.5.1 Global Collagen estimates and forecasts, by others, 2018 - 2032, (Kilo Tons) (USD Million)
- 7.5.2 Global Collagen estimates and forecasts, by others, by region, 2018 - 2032, (Kilo Tons) (USD Million)
Chapter 8 Collagen Market, By Application
- 8.1 Key application trends
- 8.2 Food
- 8.2.1 Global collagen market estimates and forecasts, by food 2018 - 2032, (Kilo Tons) (USD Million)
- 8.2.2 Global collagen market estimates and forecasts, by region, by food 2018 - 2032, (Kilo Tons) (USD Million)
- 8.2.2.1 Global collagen market estimates and forecasts, by snacks & cereals, 2018 - 2032, (Kilo Tons) (USD Million)
- 8.2.2.2 Global collagen market estimates and forecasts, by snacks & cereals, by region, 2018 - 2032, (Kilo Tons) (USD Million)
- 8.2.2.3 Global collagen market estimates and forecasts, by dairy products, 2018 - 2032, (Kilo Tons) (USD Million)
- 8.2.2.4 Global collagen market estimates and forecasts, by dairy products, by region, 2018 - 2032, (Kilo Tons) (USD Million)
- 8.2.2.5 Global collagen market estimates and forecasts, by bakery & confectionary, 2018 - 2032, (Kilo Tons) (USD Million)
- 8.2.2.6 Global collagen market estimates and forecasts, by bakery & confectionary, by region, 2018 - 2032, (Kilo Tons) (USD Million)
- 8.2.2.7 Global collagen market estimates and forecasts, by others, 2018 - 2032, (Kilo Tons) (USD Million)
- 8.2.2.8 Global collagen market estimates and forecasts, by others, by region, 2018 - 2032, (Kilo Tons) (USD Million)
- 8.3 Healthcare
- 8.3.1 Global collagen market estimates and forecasts, by healthcare 2018 - 2032, (Kilo Tons) (USD Million)
- 8.3.2 Global collagen market estimates and forecasts, by region, by healthcare 2018 - 2032, (Kilo Tons) (USD Million)
- 8.3.2.1 Global collagen market estimates and forecasts, by orthopedic, 2018 - 2032, (Kilo Tons) (USD Million)
- 8.3.2.2 Global collagen market estimates and forecasts, by orthopedic, by region, 2018 - 2032, (Kilo Tons) (USD Million)
- 8.3.2.3 Global collagen market estimates and forecasts, by dental, 2018 - 2032, (Kilo Tons) (USD Million)
- 8.3.2.4 Global collagen market estimates and forecasts, by dental, by region, 2018 - 2032, (Kilo Tons) (USD Million)
- 8.3.2.5 Global collagen market estimates and forecasts, by wound care, 2018 - 2032, (Kilo Tons) (USD Million)
- 8.3.2.6 Global collagen market estimates and forecasts, by wound care, by region, 2018 - 2032, (Kilo Tons) (USD Million)
- 8.3.2.7 Global collagen market estimates and forecasts, by others, 2018 - 2032, (Kilo Tons) (USD Million)
- 8.3.2.8 Global collagen market estimates and forecasts, by others, by region, 2018 - 2032, (Kilo Tons) (USD Million)
- 8.4 Nutraceuticals
- 8.4.1 Global collagen market estimates and forecasts, by nutraceuticals, 2018 - 2032, (Kilo Tons) (USD Million)
- 8.4.2 Global collagen market estimates and forecasts, by region, by nutraceuticals 2018 - 2032, (Kilo Tons) (USD Million)
- 8.4.2.1 Global collagen market estimates and forecasts, by dietary supplements, 2018 - 2032, (Kilo Tons) (USD Million)
- 8.4.2.2 Global collagen market estimates and forecasts, by dietary supplements, by region, 2018 - 2032, (Kilo Tons) (USD Million)
- 8.4.2.3 Global collagen market estimates and forecasts, by functional food, 2018 - 2032, (Kilo Tons) (USD Million)
- 8.4.2.4 Global collagen market estimates and forecasts, by functional food, by region, 2018 - 2032, (Kilo Tons) (USD Million)
- 8.4.2.5 Global collagen market estimates and forecasts, by others, 2018 - 2032, (Kilo Tons) (USD Million)
- 8.4.2.6 Global collagen market estimates and forecasts, by others, by region, 2018 - 2032, (Kilo Tons) (USD Million)
- 8.5 Personal Care & Cosmetics
- 8.5.1 Global collagen market estimates and forecasts, by personal care & cosmetics, 2018 - 2032, (Kilo Tons) (USD Million)
- 8.5.2 Global collagen market estimates and forecasts, by region, by personal care & cosmetics 2018 - 2032, (Kilo Tons) (USD Million)
- 8.5.2.1 Global collagen market estimates and forecasts, by skin care, 2018 - 2032, (Kilo Tons) (USD Million)
- 8.5.2.2 Global collagen market estimates and forecasts, by skin care, by region, 2018 - 2032, (Kilo Tons) (USD Million)
- 8.5.2.3 Global collagen market estimates and forecasts, by hair care, 2018 - 2032, (Kilo Tons) (USD Million)
- 8.5.2.4 Global collagen market estimates and forecasts, by hair care, by region, 2018 - 2032, (Kilo Tons) (USD Million)
- 8.5.2.5 Global collagen market from personal care & cosmetics estimates and forecasts, by others, 2018 - 2032, (Kilo Tons) (USD Million)
- 8.5.2.6 Global collagen market from personal care & cosmetics estimates and forecasts, by others, by region, 2018 - 2032, (Kilo Tons) (USD Million)
- 8.6 Others
- 8.6.1 Global collagen market estimates and forecasts, by others, 2018 - 2032, (Kilo Tons) (USD Million)
- 8.6.2 Global collagen market estimates and forecasts, by region, by others 2018 - 2032, (Kilo Tons) (USD Million)
Chapter 9 Collagen market, By Region
- 9.1 Key regional trends
- 9.2 North America
- 9.2.1 North America Collagen estimates and forecast, 2018 - 2032, (Kilo Tons) (USD Million)
- 9.2.2 North America Collagen estimates and forecast, by product, 2018 - 2032, (Kilo Tons) (USD Million)
- 9.2.3 North America Collagen estimates and forecast, by source, 2018 - 2032, (Kilo Tons) (USD Million)
- 9.2.4 North America Collagen estimates and forecast, by dosage form, 2018 - 2032, (Kilo Tons) (USD Million)
- 9.2.5 North America Collagen estimates and forecast, by application, 2018 - 2032, (Kilo Tons) (USD Million)
- 9.2.5.1 North America Collagen estimates and forecast, by food, 2018 - 2032, (Kilo Tons) (USD Million)
- 9.2.5.2 North America Collagen estimates and forecast, by healthcare, 2018 - 2032, (Kilo Tons) (USD Million)
- 9.2.5.3 North America Collagen estimates and forecast, by nutraceuticals, 2018 - 2032, (Kilo Tons) (USD Million)
- 9.2.5.4 North America Collagen estimates and forecast, by personal care & cosmetics, 2018 - 2032, (Kilo Tons) (USD Million)
- 9.3 Europe
- 9.3.1 Europe Collagen estimates and forecast, 2018 - 2032, (Kilo Tons) (USD Million)
- 9.3.2 Europe Collagen estimates and forecast, by product, 2018 - 2032, (Kilo Tons) (USD Million)
- 9.3.3 Europe Collagen estimates and forecast, by source, 2018 - 2032, (Kilo Tons) (USD Million)
- 9.3.4 Europe Collagen estimates and forecast, by dosage form, 2018 - 2032, (Kilo Tons) (USD Million)
- 9.3.5 Europe Collagen estimates and forecast, by application, 2018 - 2032, (Kilo Tons) (USD Million)
- 9.3.5.1 Europe Collagen estimates and forecast, by food, 2018 - 2032, (Kilo Tons) (USD Million)
- 9.3.5.2 Europe Collagen estimates and forecast, by healthcare, 2018 - 2032, (Kilo Tons) (USD Million)
- 9.3.5.3 Europe Collagen estimates and forecast, by nutraceuticals, 2018 - 2032, (Kilo Tons) (USD Million)
- 9.3.5.4 Europe Collagen estimates and forecast, by personal care & cosmetics, 2018 - 2032, (Kilo Tons) (USD Million)
- 9.4 Asia Pacific
- 9.4.1 Asia Pacific Collagen estimates and forecast, 2018 - 2032, (Kilo Tons) (USD Million)
- 9.4.2 Asia Pacific Collagen estimates and forecast, by product, 2018 - 2032, (Kilo Tons) (USD Million)
- 9.4.3 Asia Pacific Collagen estimates and forecast, by source, 2018 - 2032, (Kilo Tons) (USD Million)
- 9.4.4 Asia Pacific Collagen estimates and forecast, by dosage form, 2018 - 2032, (Kilo Tons) (USD Million)
- 9.4.5 Asia Pacific Collagen estimates and forecast, by application, 2018 - 2032, (Kilo Tons) (USD Million)
- 9.4.5.1 Asia Pacific Collagen estimates and forecast, by food, 2018 - 2032, (Kilo Tons) (USD Million)
- 9.4.5.2 Asia Pacific Collagen estimates and forecast, by healthcare, 2018 - 2032, (Kilo Tons) (USD Million)
- 9.4.5.3 Asia Pacific Collagen estimates and forecast, by nutraceuticals, 2018 - 2032, (Kilo Tons) (USD Million)
- 9.4.5.4 Asia Pacific Collagen estimates and forecast, by personal care & cosmetics, 2018 - 2032, (Kilo Tons) (USD Million)
- 9.5 Latin America
- 9.5.1 Latin America Collagen estimates and forecast, 2018 - 2032, (Kilo Tons) (USD Million)
- 9.5.2 Latin America Collagen estimates and forecast, by product, 2018 - 2032, (Kilo Tons) (USD Million)
- 9.5.3 Latin America Collagen estimates and forecast, by source, 2018 - 2032, (Kilo Tons) (USD Million)
- 9.5.4 Latin America Collagen estimates and forecast, by dosage form, 2018 - 2032, (Kilo Tons) (USD Million)
- 9.5.5 Latin America Collagen estimates and forecast, by application, 2018 - 2032, (Kilo Tons) (USD Million)
- 9.5.5.1 Latin America Collagen estimates and forecast, by food, 2018 - 2032, (Kilo Tons) (USD Million)
- 9.5.5.2 Latin America Collagen estimates and forecast, by healthcare, 2018 - 2032, (Kilo Tons) (USD Million)
- 9.5.5.3 Latin America Collagen estimates and forecast, by nutraceuticals, 2018 - 2032, (Kilo Tons) (USD Million)
- 9.5.5.4 Latin America Collagen estimates and forecast, by personal care & cosmetics, 2018 - 2032, (Kilo Tons) (USD Million)
- 9.6 Middle East & Africa
- 9.6.1 Middle East & Africa Collagen estimates and forecast, 2018 - 2032, (Kilo Tons) (USD Million)
- 9.6.2 Middle East & Africa Collagen estimates and forecast, by product, 2018 - 2032, (Kilo Tons) (USD Million)
- 9.6.3 Middle East & Africa Collagen estimates and forecast, by source, 2018 - 2032, (Kilo Tons) (USD Million)
- 9.6.4 Middle East & Africa Collagen estimates and forecast, by dosage form, 2018 - 2032, (Kilo Tons) (USD Million)
- 9.6.5 Middle East & Africa Collagen estimates and forecast, by application, 2018 - 2032, (Kilo Tons) (USD Million)
- 9.6.5.1 Middle East & Africa Collagen estimates and forecast, by food, 2018 - 2032, (Kilo Tons) (USD Million)
- 9.6.5.2 Middle East & Africa Collagen estimates and forecast, by healthcare, 2018 - 2032, (Kilo Tons) (USD Million)
- 9.6.5.3 Middle East & Africa Collagen estimates and forecast, by nutraceuticals, 2018 - 2032, (Kilo Tons) (USD Million)
- 9.6.5.4 Middle East & Africa Collagen estimates and forecast, by personal care & cosmetics, 2018 - 2032, (Kilo Tons) (USD Million)
Chapter 10 Company Profiles
- 10.1 Gelita AG
- 10.1.1 Business Overview
- 10.1.2 Financial Data
- 10.1.3 Product Landscape
- 10.1.4 SWOT Analysis
- 10.2 Nitta Gelatine, Inc
- 10.2.1 Business Overview
- 10.2.2 Financial Data
- 10.2.3 Product Landscape
- 10.2.4 SWOT Analysis
- 10.2.5 Strategic Outlook
- 10.3 Weishardt Group
- 10.3.1 Business Overview
- 10.3.2 Financial Data
- 10.3.3 Product Landscape
- 10.3.4 SWOT Analysis
- 10.3.5 Strategic Outlook
- 10.4 Darling Ingredients
- 10.4.1 Business Overview
- 10.4.2 Financial Data
- 10.4.3 Product Landscape
- 10.4.4 SWOT Analysis
- 10.4.5 Strategic Outlook
- 10.5 Nippi Inc.
- 10.5.1 Business Overview
- 10.5.2 Financial Data
- 10.5.3 Product Landscape
- 10.5.4 SWOT Analysis
- 10.6 Vinh Hoan Corporation
- 10.6.1 Business Overview
- 10.6.2 Financial Data
- 10.6.3 Product Landscape
- 10.6.4 SWOT Analysis
- 10.6.5 Strategic Outlook
- 10.7 Juncà Gelatines, S.L
- 10.7.1 Business Overview
- 10.7.2 Financial Data
- 10.7.3 Product Landscape
- 10.7.4 SWOT Analysis
- 10.8 Connoils
- 10.8.1 Business Overview
- 10.8.2 Financial Data
- 10.8.3 Product Landscape
- 10.8.4 SWOT Analysis
- 10.10 Nutra Food Ingredients
- 10.10.1 Business Overview
- 10.10.2 Financial Data
- 10.10.3 Product Landscape
- 10.10.4 SWOT Analysis
- 10.10 Vital Proteins
- 10.10.1 Business Overview
- 10.10.2 Financial Data
- 10.10.3 Product Landscape
- 10.10.4 SWOT Analysis
- 10.10.5 Strategic Dashboard
- 10.11 Gelnex
- 10.11.1 Business Overview
- 10.11.2 Financial Data
- 10.11.3 Product Landscape
- 10.11.4 SWOT Analysis
- 10.11.5 Strategic Outlook
- 10.12 Rousselot International
- 10.12.1 Business Overview
- 10.12.2 Financial Data
- 10.12.3 Product Landscape
- 10.12.4 SWOT Analysis
- 10.12.5 Strategic Outlook
- 10.13 Amicogen, Inc
- 10.13.1 Business Overview
- 10.13.2 Financial Data
- 10.13.3 Product Landscape
- 10.13.4 SWOT Analysis
- 10.13.5 Strategic Outlook
- 10.14 ChinaTech Peptide Co. Ltd.
- 10.14.1 Business Overview
- 10.14.2 Financial Data
- 10.14.3 Product Landscape
- 10.14.4 SWOT Analysis
- 10.14.5 Strategic Outlook
- 10.15 Norland Products
- 10.15.1 Business Overview
- 10.15.2 Financial Data
- 10.15.3 Product Landscape
- 10.15.4 SWOT Analysis
- 10.15.5 Strategic Outlook