|
|
市場調査レポート
商品コード
1077129
航空燃料市場の規模・シェア・産業分析 (2022-2028年):グレード・エンドユーザー・地域別の展望・用途の潜在性・市場シェア・予測Aviation Fuel Market Size, Share and Industry Analysis Report by Grade and End-use Sector, Regional Outlook, Growth Potential, Competitive Market Share & Forecast, 2022 - 2028 |
||||||
|
|
|||||||
|
● お客様のご希望に応じて、既存データの加工や未掲載情報(例:国別セグメント)の追加などの対応が可能です。 詳細はお問い合わせください。 |
|||||||


| 航空燃料市場の規模・シェア・産業分析 (2022-2028年):グレード・エンドユーザー・地域別の展望・用途の潜在性・市場シェア・予測 |
|
出版日: 2022年04月25日
発行: Global Market Insights Inc.
ページ情報: 英文 200 Pages
納期: 2~3営業日
|
- 全表示
- 概要
- 図表
- 目次
航空燃料の市場は、製品における顕著な技術的進歩により、2028年にかけて大きく成長すると予測されています。
また、燃料開発技術の向上や化石燃料の環境負荷低減に向けた投資の増加、可処分所得の増加による航空旅客数の増加なども予測期間を通じて市場の成長をさらに促進させるものと思われます。
当レポートでは、世界の航空燃料の市場を調査し、市場の定義と概要、新型コロナウイルス感染症 (COVID-19) およびその他の市場影響因子の分析、法規制環境、イノベーション・技術の情勢、市場規模の推移・予測、各種区分・主要国別の内訳、競合環境、主要企業のプロファイルなどをまとめています。
目次
第1章 調査手法・調査範囲
第2章 エグゼクティブサマリー
第3章 航空燃料産業の考察
- 産業の分類
- 産業情勢
- 産業のエコシステム分析
- 価格分析(COVID-19の影響を含む)
- 技術情勢
- 規制状況
- 産業への影響要因
- 成長要因
- 潜在的リスク&課題
- 成長の可能性
- ポーターの分析
- PESTEL分析
第4章 競合情勢
- 企業の市場シェア分析
- 戦略ダッシュボード
第5章 航空燃料市場:グレード別
- 市場シェア
- ジェット燃料
- 航空ガソリン
- バイオケロシン
第6章 航空燃料市場:エンドユーザー別
- 市場シェア
- 商用機
- ナローボディ機
- ワイドボディ機
- リージョナル機
- ビジネス機
- ヘリコプター
- 軍用機
第7章 航空燃料市場:地域別
- 市場シェア
- 北米
- 欧州
- アジア太平洋
- ラテンアメリカ
- 中東・アフリカ
第8章 企業プロファイル
- Total
- ExxonMobil
- Chevron
- British Petroleum(BP)
- Shell
- Gazprom
- Vitol
- World Fuel Services
- Mercury Air Group
- China Aviation Oil
- Reliance Petroleum
- Indian Oil Corporation Limited
- Bharat Petroleum Corporation Limited(BPCL)
- HPCL
- Virent, Inc.
Data Tables
- TABLE 1 Aviation fuel industry 360 degree synopsis, 2018 - 2028
- TABLE 2 Aviation fuel market estimates and forecast, 2018 - 2028, (Million Barrels Per Year) (USD Million)
- TABLE 3 Aviation fuel market estimates and forecast by grade, 2018 - 2028 (Million Barrels Per Year)
- TABLE 4 Aviation fuel market estimates and forecast by grade, 2018 - 2028 (USD Million)
- TABLE 5 Aviation fuel market volume estimates and forecast by end-user, 2018 - 2028 (Million Barrels Per Year)
- TABLE 6 Aviation fuel market revenue estimates and forecast by end-user, 2018 - 2028 (USD Million)
- TABLE 7 Aviation fuel market volume estimates and forecast by component, 2018 - 2028 (Million Barrels Per Year)
- TABLE 8 Aviation fuel market revenue estimates and forecast by component, 2018 - 2028 (USD Million)
- TABLE 9 Aviation fuel market volume estimates and forecast by region, 2018 - 2028 (Million Barrels Per Year)
- TABLE 10 Aviation fuel market revenue estimates and forecast by region, 2018 - 2028 (USD Million)
- TABLE 11 Vendor matrix
- TABLE 12 Pricing for North America
- TABLE 13 Pricing for Europe
- TABLE 14 Pricing for Asia Pacific
- TABLE 15 Pricing for Latin America
- TABLE 16 Pricing for MEA
- TABLE 17 Cost Structure
- TABLE 18 Growth drivers
- TABLE 19 Industry pitfall and challenges
- TABLE 20 Strategic dashboard
- TABLE 21 Jet Fuel market estimates and forecast, 2018 - 2028, (Million Barrels Per Year) (USD Million)
- TABLE 22 Jet fuel market estimates and forecast, by region, 2018 - 2028, (Million Barrels Per Year)
- TABLE 23 Jet fuel market estimates and forecast, by region, 2018 - 2028, (USD Million)
- TABLE 24 Aviation gasoline market estimates and forecast, 2018 - 2028, (Million Barrels Per Year) (USD Million)
- TABLE 25 Aviation gasoline market estimates and forecast, by region, 2018 - 2028, (Million Barrels Per Year)
- TABLE 26 Aviation gasoline market estimates and forecast, by region, 2018 - 2028, (USD Million)
- TABLE 27 Biokerosene market estimates and forecast, 2018 - 2028, (Million Barrels Per Year) (USD Million)
- TABLE 28 Biokerosene jets market estimates and forecast, 2018 - 2028, (Million Barrels Per Year)
- TABLE 29 Biokerosene market estimates and forecast, by region, 2018- 2028, (Million Barrels Per Year)
- TABLE 30 Biokerosene market estimates and forecast, by region, 2018 - 2028, (USD Million)
- TABLE 31 Commercial aircraft market estimates and forecast, 2018 - 2028, (Million Barrels Per Year) (USD Million)
- TABLE 32 Commercial aircraft market estimates and forecast, by region, 2018 - 2028, (Million Barrels Per Year)
- TABLE 33 Commercial aircraft market estimates and forecast, by region, 2018 - 2028, (USD Million)
- TABLE 34 Narrow-body aircraft market estimates and forecast, 2018 - 2028, (Million Barrels Per Year) (USD Million)
- TABLE 35 Narrow-body aircraft market estimates and forecast, by region, 2018 - 2028, (Million Barrels Per Year)
- TABLE 36 Narrow-body aircraft market estimates and forecast, by region, 2018 - 2028, (USD Million)
- TABLE 37 Wide-body aircraft market estimates and forecast, 2018 - 2028, (Million Barrels Per Year) (USD Million)
- TABLE 38 Wide-body aircraft market estimates and forecast, by region, 2018 - 2028, (Million Barrels Per Year)
- TABLE 39 Wide-body market estimates and forecast, by region, 2018 - 2028, (USD Million)
- TABLE 40 Regional jet market estimates and forecast, 2018 - 2028, (Million Barrels Per Year) (USD Million)
- TABLE 41 Regional jet market estimates and forecast, by region, 2018 - 2028, (Million Barrels Per Year)
- TABLE 42 Regional jet market estimates and forecast, by region, 2018 - 2028, (USD Million)
- TABLE 43 Business jet market estimates and forecast, 2018 - 2028, (Million Barrels Per Year) (USD Million)
- TABLE 44 Business jet market estimates and forecast, by region, 2018 - 2028, (Million Barrels Per Year)
- TABLE 45 Business jet market estimates and forecast, by region, 2018 - 2028, (USD Million)
- TABLE 46 Helicopter market estimates and forecast, 2018 - 2028, (Million Barrels Per Year) (USD Million)
- TABLE 47 Helicopter market estimates and forecast, by region, 2018 - 2028, (Million Barrels Per Year)
- TABLE 48 Helicopter market estimates and forecast, by region, 2018 - 2028, (USD Million)
- TABLE 49 Military market estimates and forecast, 2018 - 2028, (Million Barrels Per Year) (USD Million)
- TABLE 50 Military market estimates and forecast, by region, 2018 - 2028, (Million Barrels Per Year)
- TABLE 51 Military market estimates and forecast, by region, 2018 - 2028, (USD Million)
- TABLE 52 North America market estimates & forecast, 2018 - 2028, (Million Barrels Per Year) (USD Million)
- TABLE 53 North America market volume estimates & forecast, by grade, 2018 - 2028, (Million Barrels Per Year)
- TABLE 54 North America market revenue estimates & forecast, by grade, 2018 - 2028, (USD Million)
- TABLE 55 North America market volume estimates & forecast, by end-user, 2018 - 2028, (Million Barrels Per Year)
- TABLE 56 North America market revenue estimates & forecast, by end-user, 2018 - 2028, (USD Million)
- TABLE 57 U.S. market estimates & forecast, 2018 - 2028, (Million Barrels Per Year) (USD Million)
- TABLE 58 U.S. market volume estimates & forecast, by grade, 2018 - 2028, (Million Barrels Per Year)
- TABLE 59 U.S. market revenue estimates & forecast, by grade, 2018 - 2028, (USD Million)
- TABLE 60 U.S. market volume estimates & forecast, by end-user, 2018 - 2028, (Million Barrels Per Year)
- TABLE 61 U.S. market revenue estimates & forecast, by end-user, 2018 - 2028, (USD Million)
- TABLE 62 Canada market estimates & forecast, 2018 - 2028, (Million Barrels Per Year) (USD Million)
- TABLE 63 Canada market volume estimates & forecast, by grade, 2018 - 2028, (Million Barrels Per Year)
- TABLE 64 Canada market revenue estimates & forecast, by grade, 2018 - 2028, (USD Million)
- TABLE 65 Canada market volume estimates & forecast, by end-user, 2018 - 2028, (Million Barrels Per Year)
- TABLE 66 Canada market revenue estimates & forecast, by end-user, 2018 - 2028, (USD Million)
- TABLE 67 Europe market estimates & forecast, 2018 - 2028, (Million Barrels Per Year) (USD Million)
- TABLE 68 Europe market volume estimates & forecast, by grade, 2018 - 2028, (Million Barrels Per Year)
- TABLE 69 Europe market revenue estimates & forecast, by grade, 2018 - 2028, (USD Million)
- TABLE 70 Europe market volume estimates & forecast, by end-user, 2018 - 2028, (Million Barrels Per Year)
- TABLE 71 Europe market revenue estimates & forecast, by end-user, 2018 - 2028, (USD Million)
- TABLE 72 Germany market estimates & forecast, 2018 - 2028, (Million Barrels Per Year) (USD Million)
- TABLE 73 Germany market volume estimates & forecast, by grade, 2018 - 2028, (Million Barrels Per Year)
- TABLE 74 Germany market revenue estimates & forecast, by grade, 2018 - 2028, (USD Million)
- TABLE 75 Germany market volume estimates & forecast, by end-user, 2018 - 2028, (Million Barrels Per Year)
- TABLE 76 Germany market revenue estimates & forecast, by end-user, 2018 - 2028, (USD Million)
- TABLE 77 France market estimates & forecast, 2018 - 2028, (Million Barrels Per Year) (USD Million)
- TABLE 78 France market volume estimates & forecast, by grade, 2018 - 2028, (Million Barrels Per Year)
- TABLE 79 France market revenue estimates & forecast, by grade, 2018 - 2028, (USD Million)
- TABLE 80 France market volume estimates & forecast, by end-user, 2018 - 2028, (Million Barrels Per Year)
- TABLE 81 France market revenue estimates & forecast, by end-user, 2018 - 2028, (USD Million)
- TABLE 82 UK market estimates & forecast, 2018 - 2028, (Million Barrels Per Year) (USD Million)
- TABLE 83 UK market volume estimates & forecast, by grade, 2018 - 2028, (Million Barrels Per Year)
- TABLE 84 UK market revenue estimates & forecast, by grade, 2018 - 2028, (USD Million)
- TABLE 85 UK market volume estimates & forecast, by end-user, 2018 - 2028, (Million Barrels Per Year)
- TABLE 86 UK market revenue estimates & forecast, by end-user, 2018 - 2028, (USD Million)
- TABLE 87 Italy market estimates & forecast, 2018 - 2028, (Million Barrels Per Year) (USD Million)
- TABLE 88 Italy market volume estimates & forecast, by grade, 2018 - 2028, (Million Barrels Per Year)
- TABLE 89 Italy market revenue estimates & forecast, by grade, 2018 - 2028, (USD Million)
- TABLE 90 Italy market volume estimates & forecast, by end-user, 2018 - 2028, (Million Barrels Per Year)
- TABLE 91 Italy market revenue estimates & forecast, by end-user, 2018 - 2028, (USD Million)
- TABLE 92 Russia market estimates & forecast, 2018 - 2028, (Million Barrels Per Year) (USD Million)
- TABLE 93 Russia market volume estimates & forecast, by grade, 2018 - 2028, (Million Barrels Per Year)
- TABLE 94 Russia market revenue estimates & forecast, by grade, 2018 - 2028, (USD Million)
- TABLE 95 Russia market volume estimates & forecast, by end-user, 2018 - 2028, (Million Barrels Per Year)
- TABLE 96 Russia market revenue estimates & forecast, by end-user, 2018 - 2028, (USD Million)
- TABLE 97 Spain market estimates & forecast, 2018 - 2028, (Million Barrels Per Year) (USD Million)
- TABLE 98 Spain market volume estimates & forecast, by grade, 2018 - 2028, (Million Barrels Per Year)
- TABLE 99 Spain market revenue estimates & forecast, by grade, 2018 - 2028, (USD Million)
- TABLE 100 Spain market volume estimates & forecast, by end-user, 2018 - 2028, (Million Barrels Per Year)
- TABLE 101 Spain market revenue estimates & forecast, by end-user, 2018 - 2028, (USD Million)
- TABLE 102 Netherlands market estimates & forecast, 2018 - 2028, (Million Barrels Per Year) (USD Million)
- TABLE 103 Netherlands market volume estimates & forecast, by grade, 2018 - 2028, (Million Barrels Per Year)
- TABLE 104 Netherlands market revenue estimates & forecast, by grade, 2018 - 2028, (USD Million)
- TABLE 105 Netherlands market volume estimates & forecast, by end-user, 2018 - 2028, (Million Barrels Per Year)
- TABLE 106 Netherlands market revenue estimates & forecast, by end-user, 2018 - 2028, (USD Million)
- TABLE 107 Switzerland market estimates & forecast, 2018 - 2028, (Million Barrels Per Year) (USD Million)
- TABLE 108 Switzerland market volume estimates & forecast, by grade, 2018 - 2028, (Million Barrels Per Year)
- TABLE 109 Switzerland market revenue estimates & forecast, by grade, 2018 - 2028, (USD Million)
- TABLE 110 Switzerland market volume estimates & forecast, by end-user, 2018 - 2028, (Million Barrels Per Year)
- TABLE 111 Switzerland market revenue estimates & forecast, by end-user, 2018 - 2028, (USD Million)
- TABLE 112 Asia Pacific market estimates & forecast, 2018 - 2028, (Million Barrels Per Year) (USD Million)
- TABLE 113 Asia Pacific market volume estimates & forecast, by grade, 2018 - 2028, (Million Barrels Per Year)
- TABLE 114 Asia Pacific market revenue estimates & forecast, by grade, 2018 - 2028, (USD Million)
- TABLE 115 Asia Pacific market volume estimates & forecast, by end-user, 2018 - 2028, (Million Barrels Per Year)
- TABLE 116 Asia Pacific market revenue estimates & forecast, by end-user, 2018 - 2028, (USD Million)
- TABLE 117 China market estimates & forecast, 2018 - 2028, (Million Barrels Per Year) (USD Million)
- TABLE 118 China market volume estimates & forecast, by grade, 2018 - 2028, (Million Barrels Per Year)
- TABLE 119 China market revenue estimates & forecast, by grade, 2018 - 2028, (USD Million)
- TABLE 120 China market volume estimates & forecast, by end-user, 2018 - 2028, (Million Barrels Per Year)
- TABLE 121 China market revenue estimates & forecast, by end-user, 2018 - 2028, (USD Million)
- TABLE 122 Japan market estimates & forecast, 2018 - 2028, (Million Barrels Per Year) (USD Million)
- TABLE 123 Japan market volume estimates & forecast, by grade, 2018 - 2028, (Million Barrels Per Year)
- TABLE 124 Japan market revenue estimates & forecast, by grade, 2018 - 2028, (USD Million)
- TABLE 125 Japan market volume estimates & forecast, by end-user, 2018 - 2028, (Million Barrels Per Year)
- TABLE 126 Japan market revenue estimates & forecast, by end-user, 2018 - 2028, (USD Million)
- TABLE 127 Australia market estimates & forecast, 2018 - 2028, (Million Barrels Per Year) (USD Million)
- TABLE 128 Australia market volume estimates & forecast, by grade, 2018 - 2028, (Million Barrels Per Year)
- TABLE 129 Australia market revenue estimates & forecast, by grade, 2018 - 2028, (USD Million)
- TABLE 130 Australia market volume estimates & forecast, by end-user, 2018 - 2028, (Million Barrels Per Year)
- TABLE 131 Australia market revenue estimates & forecast, by end-user, 2018 - 2028, (USD Million)
- TABLE 132 Indonesia market estimates & forecast, 2018 - 2028, (Million Barrels Per Year) (USD Million)
- TABLE 133 Indonesia market volume estimates & forecast, by grade, 2018 - 2028, (Million Barrels Per Year)
- TABLE 134 Indonesia market revenue estimates & forecast, by grade, 2018 - 2028, (USD Million)
- TABLE 135 Indonesia market volume estimates & forecast, by end-user, 2018 - 2028, (Million Barrels Per Year)
- TABLE 136 Indonesia market revenue estimates & forecast, by end-user, 2018 - 2028, (USD Million)
- TABLE 137 India market estimates & forecast, 2018 - 2028, (Million Barrels Per Year) (USD Million)
- TABLE 138 India market volume estimates & forecast, by grade, 2018 - 2028, (Million Barrels Per Year)
- TABLE 139 India market revenue estimates & forecast, by grade, 2018 - 2028, (USD Million)
- TABLE 140 India market volume estimates & forecast, by end-user, 2018 - 2028, (Million Barrels Per Year)
- TABLE 141 India market revenue estimates & forecast, by end-user, 2018 - 2028, (USD Million)
- TABLE 142 South Korea market estimates & forecast, 2018 - 2028, (Million Barrels Per Year) (USD Million)
- TABLE 143 South Korea market volume estimates & forecast, by grade, 2018 - 2028, (Million Barrels Per Year)
- TABLE 144 South Korea market revenue estimates & forecast, by grade, 2018 - 2028, (USD Million)
- TABLE 145 South Korea market volume estimates & forecast, by end-user, 2018 - 2028, (Million Barrels Per Year)
- TABLE 146 South Korea market revenue estimates & forecast, by end-user, 2018 - 2028, (USD Million)
- TABLE 147 Thailand market estimates & forecast, 2018 - 2028, (Million Barrels Per Year) (USD Million)
- TABLE 148 Thailand market volume estimates & forecast, by grade, 2018 - 2028, (Million Barrels Per Year)
- TABLE 149 Thailand market revenue estimates & forecast, by grade, 2018 - 2028, (USD Million)
- TABLE 150 Thailand market volume estimates & forecast, by end-user, 2018 - 2028, (Million Barrels Per Year)
- TABLE 151 Thailand market revenue estimates & forecast, by end-user, 2018 - 2028, (USD Million)
- TABLE 152 Hong Kong market estimates & forecast, 2018 - 2028, (Million Barrels Per Year) (USD Million)
- TABLE 153 Hong Kong market volume estimates & forecast, by grade, 2018 - 2028, (Million Barrels Per Year)
- TABLE 154 Hong Kong market revenue estimates & forecast, by grade, 2018 - 2028, (USD Million)
- TABLE 155 Hong Kong market volume estimates & forecast, by end-user, 2018 - 2028, (Million Barrels Per Year)
- TABLE 156 Hong Kong market revenue estimates & forecast, by end-user, 2018 - 2028, (USD Million)
- TABLE 157 Singapore market estimates & forecast, 2018 - 2028, (Million Barrels Per Year) (USD Million)
- TABLE 158 Singapore market volume estimates & forecast, by grade, 2018 - 2028, (Million Barrels Per Year)
- TABLE 159 Singapore market revenue estimates & forecast, by grade, 2018 - 2028, (USD Million)
- TABLE 160 Singapore market volume estimates & forecast, by end-user, 2018 - 2028, (Million Barrels Per Year)
- TABLE 161 Singapore market revenue estimates & forecast, by end-user, 2018 - 2028, (USD Million)
- TABLE 162 Latin America market estimates & forecast, 2018 - 2028, (Million Barrels Per Year) (USD Million)
- TABLE 163 Latin America market volume estimates & forecast, by grade, 2018 - 2028, (Million Barrels Per Year)
- TABLE 164 Latin America market revenue estimates & forecast, by grade, 2018 - 2028, (USD Million)
- TABLE 165 Latin America market volume estimates & forecast, by end-user, 2018 - 2028, (Million Barrels Per Year)
- TABLE 166 Latin America market revenue estimates & forecast, by end-user, 2018 - 2028, (USD Million)
- TABLE 167 Brazil market estimates & forecast, 2018 - 2028, (Million Barrels Per Year) (USD Million)
- TABLE 168 Brazil market volume estimates & forecast, by grade, 2018 - 2028, (Million Barrels Per Year)
- TABLE 169 Brazil market revenue estimates & forecast, by grade, 2018 - 2028, (USD Million)
- TABLE 170 Brazil market volume estimates & forecast, by end-user, 2018 - 2028, (Million Barrels Per Year)
- TABLE 171 Brazil market revenue estimates & forecast, by end-user, 2018 - 2028, (USD Million)
- TABLE 172 Mexico market estimates & forecast, 2018 - 2028, (Million Barrels Per Year) (USD Million)
- TABLE 173 Mexico market volume estimates & forecast, by grade, 2018 - 2028, (Million Barrels Per Year)
- TABLE 174 Mexico market revenue estimates & forecast, by grade, 2018 - 2028, (USD Million)
- TABLE 175 Mexico market volume estimates & forecast, by end-user, 2018 - 2028, (Million Barrels Per Year)
- TABLE 176 Mexico market revenue estimates & forecast, by end-user, 2018 - 2028, (USD Million)
- TABLE 177 Argentina market estimates & forecast, 2018 - 2028, (Million Barrels Per Year) (USD Million)
- TABLE 178 Argentina market volume estimates & forecast, by grade, 2018 - 2028, (Million Barrels Per Year)
- TABLE 179 Argentina market revenue estimates & forecast, by grade, 2018 - 2028, (USD Million)
- TABLE 180 Argentina market volume estimates & forecast, by end-user, 2018 - 2028, (Million Barrels Per Year)
- TABLE 181 Argentina market revenue estimates & forecast, by end-user, 2018 - 2028, (USD Million)
- TABLE 182 Chile market estimates & forecast, 2018 - 2028, (Million Barrels Per Year) (USD Million)
- TABLE 183 Chile market volume estimates & forecast, by grade, 2018 - 2028, (Million Barrels Per Year)
- TABLE 184 Chile market revenue estimates & forecast, by grade, 2018 - 2028, (USD Million)
- TABLE 185 Chile market volume estimates & forecast, by end-user, 2018 - 2028, (Million Barrels Per Year)
- TABLE 186 Chile market revenue estimates & forecast, by end-user, 2018 - 2028, (USD Million)
- TABLE 187 Colombia market estimates & forecast, 2018 - 2028, (Million Barrels Per Year) (USD Million)
- TABLE 188 Colombia market volume estimates & forecast, by grade, 2018 - 2028, (Million Barrels Per Year)
- TABLE 189 Colombia market revenue estimates & forecast, by grade, 2018 - 2028, (USD Million)
- TABLE 190 Colombia market volume estimates & forecast, by end-user, 2018 - 2028, (Million Barrels Per Year)
- TABLE 191 Colombia market revenue estimates & forecast, by end-user, 2018 - 2028, (USD Million)
- TABLE 192 Middle East & Africa market estimates & forecast, 2018 - 2028, (Million Barrels Per Year) (USD Million)
- TABLE 193 Middle East & Africa market volume estimates & forecast, by grade, 2018 - 2028, (Million Barrels Per Year)
- TABLE 194 Middle East & Africa market revenue estimates & forecast, by grade, 2018 - 2028, (USD Million)
- TABLE 195 Middle East & Africa market volume estimates & forecast, by end-user, 2018 - 2028, (Million Barrels Per Year)
- TABLE 196 Middle East & Africa market revenue estimates & forecast, by end-user, 2018 - 2028, (USD Million)
- TABLE 197 Saudi Arabia market estimates & forecast, 2018 - 2028, (Million Barrels Per Year) (USD Million)
- TABLE 198 Saudi Arabia market volume estimates & forecast, by grade, 2018 - 2028, (Million Barrels Per Year)
- TABLE 199 Saudi Arabia market revenue estimates & forecast, by grade, 2018 - 2028, (USD Million)
- TABLE 200 Saudi Arabia market volume estimates & forecast, by end-user, 2018 - 2028, (Million Barrels Per Year)
- TABLE 201 Saudi Arabia market revenue estimates & forecast, by end-user, 2018 - 2028, (USD Million)
- TABLE 202 UAE market estimates & forecast, 2018 - 2028, (Million Barrels Per Year) (USD Million)
- TABLE 203 UAE market volume estimates & forecast, by grade, 2018 - 2028, (Million Barrels Per Year)
- TABLE 204 UAE market revenue estimates & forecast, by grade, 2018 - 2028, (USD Million)
- TABLE 205 UAE market volume estimates & forecast, by end-user, 2018 - 2028, (Million Barrels Per Year)
- TABLE 206 UAE market revenue estimates & forecast, by end-user, 2018 - 2028, (USD Million)
- TABLE 207 Turkey market estimates & forecast, 2018 - 2028, (Million Barrels Per Year) (USD Million)
- TABLE 208 Turkey market volume estimates & forecast, by grade, 2018 - 2028, (Million Barrels Per Year)
- TABLE 209 Turkey market revenue estimates & forecast, by grade, 2018 - 2028, (USD Million)
- TABLE 210 Turkey market volume estimates & forecast, by end-user, 2018 - 2028, (Million Barrels Per Year)
- TABLE 211 Turkey market revenue estimates & forecast, by end-user, 2018 - 2028, (USD Million)
- TABLE 212 South Africa market estimates & forecast, 2018 - 2028, (Million Barrels Per Year) (USD Million)
- TABLE 213 South Africa market volume estimates & forecast, by grade, 2018 - 2028, (Million Barrels Per Year)
- TABLE 214 South Africa market revenue estimates & forecast, by grade, 2018 - 2028, (USD Million)
- TABLE 215 South Africa market volume estimates & forecast, by end-user, 2018 - 2028, (Million Barrels Per Year)
- TABLE 216 South Africa market revenue estimates & forecast, by end-user, 2018 - 2028, (USD Million)
Charts & Figures
- FIG 1 Industry segmentation
- FIG 2 Industry landscape, 2018 - 2028 (Million Barrels Per Year) (USD Million)
- FIG 3 Industry ecosystem analysis
- FIG 4 Growth potential analysis, 2018
- FIG 5 Porter's analysis
- FIG 6 PESTEL analysis
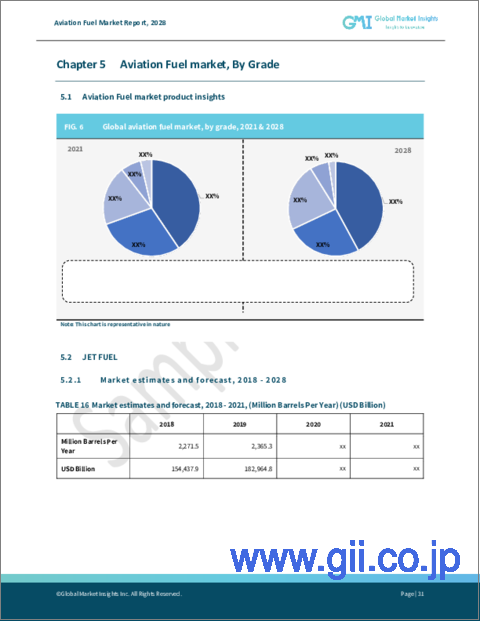
- FIG 7 Aviation fuel market share by grade, 2018 & 2028
- FIG 8 Aviation fuel market share by end-user, 2018 & 2028
- FIG 9 Aviation fuel market share by region, 2018 & 2028
- FIG 10 SWOT Analysis, Total
- FIG 11 SWOT Analysis, ExxonMobil
- FIG 12 SWOT Analysis, Chevron
- FIG 13 SWOT Analysis, British Petroleum (BP)
- FIG 14 SWOT Analysis, Shell
- FIG 15 SWOT Analysis, Gazprom
- FIG 16 SWOT Analysis, World Fuel Services
- FIG 17 SWOT Analysis, Mercury Air Group
- FIG 18 SWOT Analysis, China Aviation Oil
- FIG 19 SWOT Analysis, Reliance Petroleum
- FIG 20 SWOT Analysis, Indian Oil Corporation Limited
- FIG 21 SWOT Analysis, Bharat Petroleum Corporation Limited (BPCL)
- FIG 22 SWOT Analysis, HPCL
- FIG 23 SWOT Analysis, Virent, Inc.
- FIG 24 SWOT Analysis, Vitol
The aviation fuel market is anticipated to grow significantly by 2028 driven by notable technological advancements in the product. In addition, increasing investments towards enhancing fuel development techniques as well as reducing the environmental influence of fossil fuels, coupled with rising number of air passengers due to growing disposable income, are likely to further facilitate market growth through the forecast timeframe.
Notably, increased emphasis on green initiatives has encouraged industry players to invest in sustainable fuel solutions along with forming strategic partnerships with airline operators to innovate technologies to expand their business presence, which has been favorable for aviation fuel market growth. For instance, in January 2021, BP, a British oil & gas company, announced a strategic alliance with Qantas Airways Ltd., an Australian airline, to advance their shared net-zero ambitions. The alliance was intended to allow both companies to work together on opportunities to lower carbon emissions.
To quote an instance, in September 2021, Shell, a leading British oil company, announced a final investment decision to build a biofuel facility with an 820,000-tons-a-year capacity at the Shell Energy and Chemicals Park Rotterdam refinery. The facility was aimed to be one of Europe's biggest production facilities for renewable diesel and sustainable aviation fuel (SAF). Furthermore, in April 2022, Shell was chosen to supply fuel for Asia's first major sustainable aviation fuel (SAF) program launched by Cathay Pacific, a Hong Kong airline.
In another instance, in September 2021, Chevron, an American multinational energy corporation, and Gevo, Inc., a leading producer of hydrocarbons and chemicals, collaborated to produce sustainable aviation fuel from processed inedible corn. The resulting new facilities were purposed to produce proteins and corn oil.
Similarly, in September 2021, Gazprom, a leading player in the industry, joined forces with Aeroflot, the largest airline of Russia, to make Russia's first minimum carbon-footprint SAF. Likewise, in February 2022, ExxonMobil, a U.S.-based oil & gas corporation, was selected as the official supplier of SAF, produced from cooking oil and waste animal fats, by the Civil Aviation Authority of Singapore (CAAS), Temasek, a Singapore-based global investment company, and Singapore Airlines (SIA).
The aviation fuel market has been bifurcated based on grade, end-user, and region. In terms of end-user, the market has been further divided into regional, commercial, business, military, and helicopter.
The business segment is estimated to garner a revenue share of over 10% by the end of the analysis timespan. The aviation fuel market share from the helicopter segment is slated to grow with a CAGR of nearly 7.6% through the review period.
With respect to region, the Middle East & Africa aviation fuel industry accounted for around 8% volume share in 2021 and is slated to progress at a robust pace over 2022-2028. Meanwhile, the Latin America aviation fuel market is anticipated to grow at a CAGR of roughly 8.5% through the study timeframe.
Table of Contents
Chapter 1 Methodology and Scope
- 1.1 Market definitions
- 1.2 Base estimation & working
- 1.2.1 North America
- 1.2.2 Europe
- 1.2.3 Asia Pacific (APAC)
- 1.2.4 Latin America (LATAM)
- 1.2.5 Middle East & Africa (MEA)
- 1.3 Forecast calculations
- 1.3.1 COVID-19 impact calculations on industry forecast
- 1.4 Data Sources
- 1.4.1 Primary
- 1.4.2 Secondary
Chapter 2 Executive Summary
- 2.1 Aviation fuel industry 360 degree synopsis, 2018 - 2028
- 2.1.1 Business trends
- 2.1.2 Regional trends
- 2.1.3 Grade trends
- 2.1.4 End-use sector trends
Chapter 3 Aviation Fuel Industry Insights
- 3.1 Industry segmentation
- 3.2 Industry landscape, 2018 - 2028
- 3.3 Industry ecosystem analysis
- 3.3.1 Distribution channel analysis
- 3.3.2 Vendor matrix
- 3.4 Pricing analysis (including COVID-19 impact)
- 3.4.1 Regional pricing
- 3.4.1.1 North America
- 3.4.1.2 Europe
- 3.4.1.3 Asia Pacific
- 3.4.1.4 Latin America
- 3.4.1.5 Middle East & Africa
- 3.4.2 Cost structure analysis
- 3.4.1 Regional pricing
- 3.5 Technology landscape
- 3.6 Regulatory landscape
- 3.7 Industry impact forces
- 3.7.1 Growth drivers
- 3.7.1.1 Proliferating demand for air travel owing to low-cost carriers
- 3.7.1.2 Increasing production and deliveries of aircraft
- 3.7.1.3 Construction and expansion of airports
- 3.7.1.4 Booming trade activities and proliferating e-commerce industry
- 3.7.1.5 Expanding middle class population and proliferating tourism industry
- 3.7.1.6 Supporting regulatory norms and rising demand for green and sustainable fuel
- 3.7.2 Industry pitfalls & challenges
- 3.7.2.1 Volatile crude oil pricing and geopolitical issues
- 3.7.2.2 Rising preference for hybrid and electric aircraft
- 3.7.2.3 Capacity constraints and congestion related issues
- 3.7.1 Growth drivers
- 3.8 Growth potential analysis, 2021
- 3.9 Porter's analysis
- 3.10 PESTEL analysis
Chapter 4 Competitive landscape
- 4.1 Company market share analysis, 2021
- 4.2 Strategy dashboard
Chapter 5 Aviation Fuel Market, By Grade
- 5.1 Global aviation fuel market share by grade, 2018 & 2028
- 5.2 Jet Fuel
- 5.2.1 Global market estimates and forecasts, 2018 - 2028
- 5.3 Aviation Gasoline
- 5.3.1 Global market estimates and forecasts, 2018 - 2028
- 5.4 Biokerosene
- 5.4.1 Global market estimates and forecasts, 2018 - 2028
Chapter 6 Aviation Fuel Market, By End-use Sector
- 6.1 Global aviation fuel market share by end-use sector, 2018 & 2028
- 6.2 Commercial
- 6.2.1 Global market estimates and forecasts, 2018 - 2028
- 6.2.2 Narrow-body
- 6.2.2.1 Global market estimates and forecasts, 2018 - 2028
- 6.2.3 Wide-body
- 6.2.3.1 Global market estimates and forecasts, 2018 - 2028
- 6.3 Regional
- 6.3.1 Global market estimates and forecasts, 2018 - 2028
- 6.4 Business
- 6.4.1 Global market estimates and forecasts, 2018 - 2028
- 6.5 Helicopter
- 6.5.1 Global market estimates and forecasts, 2018 - 2028
- 6.6 Military
- 6.6.1 Global market estimates and forecasts, 2018 - 2028
Chapter 7 Aviation Fuel Market, By Region
- 7.1 Global aviation fuel market share by region, 2018 & 2028
- 7.2 North America
- 7.2.1 Market estimates and forecast, 2018 - 2028
- 7.2.2 Market estimates and forecast by grade, 2018 - 2028
- 7.2.3 Market estimates and forecast by end-use sector, 2018 - 2028
- 7.2.4 U.S.
- 7.2.4.1 Market estimates and forecast, 2018 - 2028
- 7.2.4.2 Market estimates and forecast by grade, 2018 - 2028
- 7.2.4.3 Market estimates and forecast by end-use sector, 2018 - 2028
- 7.2.5 Canada
- 7.2.5.1 Market estimates and forecast, 2018 - 2028
- 7.2.5.2 Market estimates and forecast by grade, 2018 - 2028
- 7.2.5.3 Market estimates and forecast by end-use sector, 2018 - 2028
- 7.3 Europe
- 7.3.1 Market estimates and forecast, 2018 - 2028
- 7.3.2 Market estimates and forecast by grade, 2018 - 2028
- 7.3.3 Market estimates and forecast by end-use sector, 2018 - 2028
- 7.3.4 Germany
- 7.3.4.1 Market estimates and forecast, 2018 - 2028
- 7.3.4.2 Market estimates and forecast by grade, 2018 - 2028
- 7.3.4.3 Market estimates and forecast by end-use sector, 2018 - 2028
- 7.3.5 France
- 7.3.5.1 Market estimates and forecast, 2018 - 2028
- 7.3.5.2 Market estimates and forecast by grade, 2018 - 2028
- 7.3.5.3 Market estimates and forecast by end-use sector, 2018 - 2028
- 7.3.6 UK
- 7.3.6.1 Market estimates and forecast, 2018 - 2028
- 7.3.6.2 Market estimates and forecast by grade, 2018 - 2028
- 7.3.6.3 Market estimates and forecast by end-use sector, 2018 - 2028
- 7.3.7 Italy
- 7.3.7.1 Market estimates and forecast, 2018 - 2028
- 7.3.7.2 Market estimates and forecast by grade, 2018 - 2028
- 7.3.7.3 Market estimates and forecast by end-use sector, 2018 - 2028
- 7.3.8 Russia
- 7.3.8.1 Market estimates and forecast, 2018 - 2028
- 7.3.8.2 Market estimates and forecast by grade, 2018 - 2028
- 7.3.8.3 Market estimates and forecast by end-use sector, 2018 - 2028
- 7.3.9 Spain
- 7.3.9.1 Market estimates and forecast, 2018 - 2028
- 7.3.9.2 Market estimates and forecast by grade, 2018 - 2028
- 7.3.9.3 Market estimates and forecast by end-use sector, 2018 - 2028
- 7.3.10 Netherlands
- 7.3.10.1 Market estimates and forecast, 2018 - 2028
- 7.3.10.2 Market estimates and forecast by grade, 2018 - 2028
- 7.3.10.3 Market estimates and forecast by end-use sector, 2018 - 2028
- 7.3.11 Switzerland
- 7.3.11.1 Market estimates and forecast, 2018 - 2028
- 7.3.11.2 Market estimates and forecast by grade, 2018 - 2028
- 7.3.11.3 Market estimates and forecast by end-use sector, 2018 - 2028
- 7.4 Asia Pacific
- 7.4.1 Market estimates and forecast, 2018 - 2028
- 7.4.2 Market estimates and forecast by grade, 2018 - 2028
- 7.4.3 Market estimates and forecast by end-use sector, 2018 - 2028
- 7.4.4 China
- 7.4.4.1 Market estimates and forecast, 2018 - 2028
- 7.4.4.2 Market estimates and forecast by grade, 2018 - 2028
- 7.4.4.3 Market estimates and forecast by end-use sector, 2018 - 2028
- 7.4.5 Japan
- 7.4.5.1 Market estimates and forecast, 2018 - 2028
- 7.4.5.2 Market estimates and forecast by grade, 2018 - 2028
- 7.4.5.3 Market estimates and forecast by end-use sector, 2018 - 2028
- 7.4.6 Australia
- 7.4.6.1 Market estimates and forecast, 2018 - 2028
- 7.4.6.2 Market estimates and forecast by grade, 2018 - 2028
- 7.4.6.3 Market estimates and forecast by end-use sector, 2018 - 2028
- 7.4.7 Indonesia
- 7.4.7.1 Market estimates and forecast, 2018 - 2028
- 7.4.7.2 Market estimates and forecast by grade, 2018 - 2028
- 7.4.7.3 Market estimates and forecast by end-use sector, 2018 - 2028
- 7.4.8 India
- 7.4.8.1 Market estimates and forecast, 2018 - 2028
- 7.4.8.2 Market estimates and forecast by grade, 2018 - 2028
- 7.4.8.3 Market estimates and forecast by end-use sector, 2018 - 2028
- 7.4.9 South Korea
- 7.4.9.1 Market estimates and forecast, 2018 - 2028
- 7.4.9.2 Market estimates and forecast by grade, 2018 - 2028
- 7.4.9.3 Market estimates and forecast by end-use sector, 2018 - 2028
- 7.4.10 Thailand
- 7.4.10.1 Market estimates and forecast, 2018 - 2028
- 7.4.10.2 Market estimates and forecast by grade, 2018 - 2028
- 7.4.10.3 Market estimates and forecast by end-use sector, 2018 - 2028
- 7.4.11 Hong Kong
- 7.4.11.1 Market estimates and forecast, 2018 - 2028
- 7.4.11.2 Market estimates and forecast by grade, 2018 - 2028
- 7.4.11.3 Market estimates and forecast by end-use sector, 2018 - 2028
- 7.4.12 Singapore
- 7.4.12.1 Market estimates and forecast, 2018 - 2028
- 7.4.12.2 Market estimates and forecast by grade, 2018 - 2028
- 7.4.12.3 Market estimates and forecast by end-use sector, 2018 - 2028
- 7.5 Latin America
- 7.5.1 Market estimates and forecast, 2018 - 2028
- 7.5.2 Market estimates and forecast by grade, 2018 - 2028
- 7.5.3 Market estimates and forecast by end-use sector, 2018 - 2028
- 7.5.4 Brazil
- 7.5.4.1 Market estimates and forecast, 2018 - 2028
- 7.5.4.2 Market estimates and forecast by grade, 2018 - 2028
- 7.5.4.3 Market estimates and forecast by end-use sector, 2018 - 2028
- 7.5.5 Mexico
- 7.5.5.1 Market estimates and forecast, 2018 - 2028
- 7.5.5.2 Market estimates and forecast by grade, 2018 - 2028
- 7.5.5.3 Market estimates and forecast by end-use sector, 2018 - 2028
- 7.5.6 Argentina
- 7.5.6.1 Market estimates and forecast, 2018 - 2028
- 7.5.6.2 Market estimates and forecast by grade, 2018 - 2028
- 7.5.6.3 Market estimates and forecast by end-use sector, 2018 - 2028
- 7.5.7 Chile
- 7.5.7.1 Market estimates and forecast, 2018 - 2028
- 7.5.7.2 Market estimates and forecast by grade, 2018 - 2028
- 7.5.7.3 Market estimates and forecast by end-use sector, 2018 - 2028
- 7.5.8 Colombia
- 7.5.8.1 Market estimates and forecast, 2018 - 2028
- 7.5.8.2 Market estimates and forecast by grade, 2018 - 2028
- 7.5.8.3 Market estimates and forecast by end-use sector, 2018 - 2028
- 7.6 Middle East & Africa
- 7.6.1 Market estimates and forecast, 2018 - 2028
- 7.6.2 Market estimates and forecast by grade, 2018 - 2028
- 7.6.3 Market estimates and forecast by end-use sector, 2018 - 2028
- 7.6.4 Saudi Arabia
- 7.6.4.1 Market estimates and forecast, 2018 - 2028
- 7.6.4.2 Market estimates and forecast by grade, 2018 - 2028
- 7.6.4.3 Market estimates and forecast by end-use sector, 2018 - 2028
- 7.6.5 UAE
- 7.6.5.1 Market estimates and forecast, 2018 - 2028
- 7.6.5.2 Market estimates and forecast by grade, 2018 - 2028
- 7.6.5.3 Market estimates and forecast by end-use sector, 2018 - 2028
- 7.6.6 Turkey
- 7.6.6.1 Market estimates and forecast, 2018 - 2028
- 7.6.6.2 Market estimates and forecast by grade, 2018 - 2028
- 7.6.6.3 Market estimates and forecast by end-use sector, 2018 - 2028
- 7.6.7 South Africa
- 7.6.7.1 Market estimates and forecast, 2018 - 2028
- 7.6.7.2 Market estimates and forecast by grade, 2018 - 2028
- 7.6.7.3 Market estimates and forecast by end-use sector, 2018 - 2028
Chapter 8 Company Profiles
- 8.1 Total
- 8.1.1 Business Overview
- 8.1.2 Financial Data
- 8.1.3 Product Landscape
- 8.1.4 Strategic Outlook
- 8.1.5 SWOT Analysis
- 8.2 ExxonMobil
- 8.2.1 Business Overview
- 8.2.2 Financial Data
- 8.2.3 Product Landscape
- 8.2.4 Strategic Outlook
- 8.2.5 SWOT Analysis
- 8.3 Chevron
- 8.3.1 Business Overview
- 8.3.2 Financial Data
- 8.3.3 Product Landscape
- 8.3.4 Strategic Outlook
- 8.3.5 SWOT Analysis
- 8.4 British Petroleum (BP)
- 8.4.1 Business Overview
- 8.4.2 Financial Data
- 8.4.3 Product Landscape
- 8.4.4 Strategic Outlook
- 8.4.5 SWOT Analysis
- 8.5 Shell
- 8.5.1 Business Overview
- 8.5.2 Financial Data
- 8.5.3 Product Landscape
- 8.5.4 Strategic Outlook
- 8.5.5 SWOT Analysis
- 8.6 Gazprom
- 8.6.1 Business Overview
- 8.6.2 Financial Data
- 8.6.3 Product Landscape
- 8.6.4 Strategic Outlook
- 8.6.5 SWOT Analysis
- 8.7 Vitol
- 8.7.1 Business Overview
- 8.7.2 Financial Data
- 8.7.3 Product Landscape
- 8.7.4 Strategic Outlook
- 8.7.5 SWOT Analysis
- 8.8 World Fuel Services
- 8.8.1 Business Overview
- 8.8.2 Financial Data
- 8.8.3 Product Landscape
- 8.8.4 Strategic Outlook
- 8.8.5 SWOT Analysis
- 8.9 Mercury Air Group
- 8.9.1 Business Overview
- 8.9.2 Financial Data
- 8.9.3 Product Landscape
- 8.9.4 Strategic Outlook
- 8.9.5 SWOT Analysis
- 8.10 China Aviation Oil
- 8.10.1 Business Overview
- 8.10.2 Financial Data
- 8.10.3 Product Landscape
- 8.10.4 Strategic Outlook
- 8.10.5 SWOT Analysis
- 8.11 Reliance Petroleum
- 8.11.1 Business Overview
- 8.11.2 Financial Data
- 8.11.3 Product Landscape
- 8.11.4 Strategic Outlook
- 8.11.5 SWOT Analysis
- 8.12 Indian Oil Corporation Limited
- 8.12.1 Business Overview
- 8.12.2 Financial Data
- 8.12.3 Product Landscape
- 8.12.4 Strategic Outlook
- 8.12.5 SWOT Analysis
- 8.13 Bharat Petroleum Corporation Limited (BPCL)
- 8.13.1 Business Overview
- 8.13.2 Financial Data
- 8.13.3 Product Landscape
- 8.13.4 Strategic Outlook
- 8.13.5 SWOT Analysis
- 8.14 HPCL
- 8.14.1 Business Overview
- 8.14.2 Financial Data
- 8.14.3 Product Landscape
- 8.14.4 Strategic Outlook
- 8.14.5 SWOT Analysis
- 8.15 Virent, Inc.
- 8.15.1 Business Overview
- 8.15.2 Financial Data
- 8.15.3 Product Landscape
- 8.15.4 Strategic Outlook
- 8.15.5 SWOT Analysis