|
|
市場調査レポート
商品コード
1402415
血漿分画製剤(PDT)市場:製品別、用途別、世界予測、2023-2032年Plasma Derived Therapy Market - By Product (Immunoglobulins, Coagulation Factors, Albumin), Application (Hemophilia, Primary Immunodeficiency Diseases, Idiopathic/Immune Thrombocytopenic Purpura (ITP)), Global Forecast, 2023-2032 |
||||||
|
|
|||||||
|
● お客様のご希望に応じて、既存データの加工や未掲載情報(例:国別セグメント)の追加などの対応が可能です。 詳細はお問い合わせください。 |
|||||||


| 血漿分画製剤(PDT)市場:製品別、用途別、世界予測、2023-2032年 |
|
出版日: 2023年11月28日
発行: Global Market Insights Inc.
ページ情報: 英文 90 Pages
納期: 2~3営業日
|
- 全表示
- 概要
- 図表
- 目次
世界の血漿分画製剤(PDT)市場は、血漿採取センターと製造施設のネットワーク拡大により、2023年から2032年にかけてCAGR 7.5%で成長すると予想されます。
これらのインフラ要素の継続的な成長は、血漿分画製剤(PDT)に対する需要の高まりに対応しています。血漿へのアクセスが向上することで、市場は治療製品の生産を後押しし、より強固なサプライチェーンが確保されます。この拡大は、血漿分画製剤(PDT)に対する世界の需要の高まりに対応する上で極めて重要な役割を果たし、市場全体の発展に大きく貢献します。
例えば、日本のバイオ医薬品会社である武田薬品工業は2023年、血漿分画製剤(PDT)を製造する国内最大規模の最新鋭施設を大阪に建設します。この戦略的な取り組みにより、武田薬品の製造・供給能力を強化し、PDTに対する世界の需要の高まりに対応するとともに、日本のみならず世界各国における患者さんのニーズの高まりに応えていきます。武田薬品は、血漿分画製剤(PDT)市場の強化、世界の需要に対応した生産能力の増強、患者ニーズの高まりへの対応に大きく貢献してまいります」と述べています。
血漿分画製剤(PDT)業界は、製品、用途、地域によって細分化されています。
アルブミンセグメントは、多様な用途と様々な医療介入におけるアルブミンの重要な役割に後押しされ、2032年までに大きな市場基盤を確立すると思われます。クリティカルケア、外科手術、外傷を含む広範な治療用途を持つ重要な血漿タンパク質として、アルブミンはその不可欠な価値で際立つと思われます。アルブミンベースの治療に対する需要が高まる中、このセグメントは血漿分画製剤(PDT)産業の展望を形成する上で極めて重要な役割を果たすと思われます。
特発性/免疫性血小板減少性紫斑病(ITP)セグメントは、2032年まで大幅な成長を遂げると思われます。ITPの発症率が上昇し、血漿分画製剤(PDT)が効果的な治療法として認知されつつあるためです。自己免疫疾患、特にITPへの取り組みに注目が集まる中、標的を絞った信頼性の高い治療法に対する需要が高まっています。医学研究と治療技術革新の継続的な進歩により、ITPセグメントは血漿分画製剤(PDT)の拡大における重要な貢献者となり、重要な医療ニーズに対応することになると思われます。
欧州は、その先進的な医療インフラと強固な研究開発努力により、2023年から2032年にかけて顕著なCAGRを記録すると予想されます。血漿関連疾患の有病率が上昇していることも、この動向に拍車をかけています。欧州の医療情勢は、技術の進歩と医療技術革新へのコミットメントによって特徴付けられ、血漿分画製剤(PDT)産業の軌道を形成する上で極めて重要な役割を担っており、業界の成長と発展に大きく寄与しています。
目次
第1章 調査手法と調査範囲
第2章 エグゼクティブサマリー
第3章 血漿分画製剤(PDT)市場の洞察
- 産業区分
- 業界情勢
- 業界への影響要因
- 促進要因
- 希少疾患の増加
- 遺伝性疾患治療のための先端治療への需要の高まり
- 世界各地での血漿採取センターの増加
- 全国的な免疫グロブリン採用の増加
- 業界の潜在的リスク&課題
- 厳しい規制政策
- 促進要因
- 成長可能性分析
- COVID-19影響分析
- 規制状況
- 米国
- 欧州
- ポーター分析
- PESTEL分析
第4章 競合情勢
- イントロダクション
- 企業マトリックス分析
- 主要市場プレーヤーの競合分析
- 競合のポジショニングマトリックス
- 戦略ダッシュボード
第5章 血漿分画製剤(PDT)市場推定・予測:製品別、2018年~2032年
- 主要動向:製品別
- 免疫グロブリン
- 凝固因子
- アルブミン
- その他
第6章 血漿分画製剤(PDT)市場推定・予測:用途別、2018年~2032年
- 主要動向:用途別
- 血友病
- 原発性免疫不全症
- 免疫性/特発性血小板減少性紫斑病(ITP)
- その他
第7章 血漿分画製剤(PDT)市場推定・予測:地域別、2018年~2032年
- 主要動向:地域別
- 北米
- 米国
- カナダ
- 欧州
- ドイツ
- 英国
- フランス
- スペイン
- イタリア
- その他欧州
- アジア太平洋
- 中国
- 日本
- インド
- オーストラリア
- その他アジア太平洋地域
- ラテンアメリカ
- ブラジル
- メキシコ
- アルゼンチン
- その他ラテンアメリカ
- 中東・アフリカ
- 南アフリカ
- サウジアラビア
- アラブ首長国連邦
- その他中東・アフリカ
第8章 企業プロファイル
- CSL Behring
- Takeda Pharmaceutical Company Limited
- Biotest AG
- Octapharma
- BPL
- ADMA Biologics
- Grifols, SA
- Kedrion
- Kamada Pharmaceuticals
- SK Plasma
- Pfizer, Inc.
Data Tables
- TABLE 1. Market revenue, by product (2022)
- TABLE 2. Market revenue, by application (2022)
- TABLE 3. Market share, by region (2022)
- TABLE 4. Global plasma derived therapy market, 2018 - 2022 (USD Million)
- TABLE 5. Global plasma derived therapy market, 2023 - 2032 (USD Million)
- TABLE 6. Global plasma derived therapy market, by product, 2018 - 2022(USD Million)
- TABLE 7. Global plasma derived therapy market, by product, 2023 - 2032 (USD Million)
- TABLE 8. Global plasma derived therapy market, by application, 2018 - 2022(USD Million)
- TABLE 9. Global plasma derived therapy market, by application, 2023 - 2032 (USD Million)
- TABLE 10. Global plasma derived therapy market, by region, 2018 - 2022 (USD Million)
- TABLE 11. Global plasma derived therapy market, by region, 2023 - 2032 (USD Million)
- TABLE 12. Industry impact forces
- TABLE 13. Coagulation factors market size, by region, 2018 - 2022 (USD Million)
- TABLE 14. Coagulation factors market size, by region, 2023 - 2032 (USD Million)
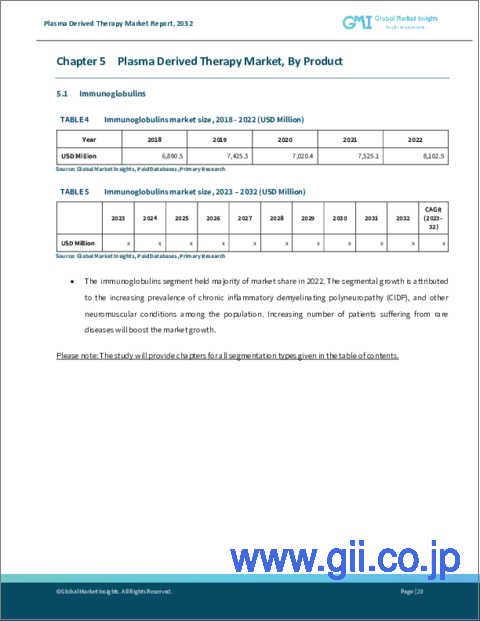
- TABLE 15. Immunoglobulins market size, by region, 2018 - 2022 (USD Million)
- TABLE 16. Immunoglobulins market size, by region, 2023 - 2032 (USD Million)
- TABLE 17. Albumin market size, by region, 2018 - 2022 (USD Million)
- TABLE 18. Albumin market size, by region, 2023 - 2032 (USD Million)
- TABLE 19. Other products market size, by region, 2018 - 2022 (USD Million)
- TABLE 20. Other products market size, by region, 2023 - 2032 (USD Million)
- TABLE 21. Primary immunodeficiency diseases market size, by region, 2018 - 2022 (USD Million)
- TABLE 22. Primary immunodeficiency diseases market size, by region, 2023 - 2032 (USD Million)
- TABLE 23. Hemophilia market size, by region, 2018 - 2022 (USD Million)
- TABLE 24. Hemophilia market size, by region, 2023 - 2032 (USD Million)
- TABLE 25. Idiopathic thrombocytopenic purpura (ITP) market size, by region, 2018 - 2022 (USD Million)
- TABLE 26. Idiopathic thrombocytopenic purpura (ITP) market size, by region, 2023 - 2032 (USD Million)
- TABLE 27. Other applications market size, by region, 2018 - 2022 (USD Million)
- TABLE 28. Other applications market size, by region, 2023 - 2032 (USD Million)
- TABLE 29. North America market, by country, 2018 - 2022(USD Million)
- TABLE 30. North America market, by country, 2023 - 2032 (USD Million)
- TABLE 31. North America plasma derived therapy market, by product, 2018 - 2022(USD Million)
- TABLE 32. North America plasma derived therapy market, by product, 2023 - 2032 (USD Million)
- TABLE 33. North America plasma derived therapy market, by application, 2018 - 2022(USD Million)
- TABLE 34. North America plasma derived therapy market, by application, 2023 - 2032 (USD Million)
- TABLE 35. U.S. plasma derived therapy market, by product, 2018 - 2022(USD Million)
- TABLE 36. U.S. plasma derived therapy market, by product, 2023 - 2032 (USD Million)
- TABLE 37. U.S. plasma derived therapy market, by application, 2018 - 2022(USD Million)
- TABLE 38. U.S. plasma derived therapy market, by application, 2023 - 2032 (USD Million)
- TABLE 39. Canada plasma derived therapy market, by product, 2018 - 2022(USD Million)
- TABLE 40. Canada plasma derived therapy market, by product, 2023 - 2032 (USD Million)
- TABLE 41. Canada plasma derived therapy market, by application, 2018 - 2022(USD Million)
- TABLE 42. Canada plasma derived therapy market, by application, 2023 - 2032 (USD Million)
- TABLE 43. Europe market, by country, 2018 - 2022(USD Million)
- TABLE 44. Europe market, by country, 2023 - 2032 (USD Million)
- TABLE 45. Europe plasma derived therapy market, by product, 2018 - 2022(USD Million)
- TABLE 46. Europe plasma derived therapy market, by product, 2023 - 2032 (USD Million)
- TABLE 47. Europe plasma derived therapy market, by application, 2018 - 2022(USD Million)
- TABLE 48. Europe plasma derived therapy market, by application, 2023 - 2032 (USD Million)
- TABLE 49. Germany plasma derived therapy market, by product, 2018 - 2022(USD Million)
- TABLE 50. Germany plasma derived therapy market, by product, 2023 - 2032 (USD Million)
- TABLE 51. Germany plasma derived therapy market, by application, 2018 - 2022(USD Million)
- TABLE 52. Germany plasma derived therapy market, by application, 2023 - 2032 (USD Million)
- TABLE 53. UK plasma derived therapy market, by product, 2018 - 2022(USD Million)
- TABLE 54. UK plasma derived therapy market, by product, 2023 - 2032 (USD Million)
- TABLE 55. UK plasma derived therapy market, by application, 2018 - 2022(USD Million)
- TABLE 56. UK plasma derived therapy market, by application, 2023 - 2032 (USD Million)
- TABLE 57. France plasma derived therapy market, by product, 2018 - 2022(USD Million)
- TABLE 58. France plasma derived therapy market, by product, 2023 - 2032 (USD Million)
- TABLE 59. France plasma derived therapy market, by application, 2018 - 2022(USD Million)
- TABLE 60. France plasma derived therapy market, by application, 2023 - 2032 (USD Million)
- TABLE 61. Italy plasma derived therapy market, by product, 2018 - 2022(USD Million)
- TABLE 62. Italy plasma derived therapy market, by product, 2023 - 2032 (USD Million)
- TABLE 63. Italy plasma derived therapy market, by application, 2018 - 2022(USD Million)
- TABLE 64. Italy plasma derived therapy market, by application, 2023 - 2032 (USD Million)
- TABLE 65. Spain plasma derived therapy market, by product, 2018 - 2022(USD Million)
- TABLE 66. Spain plasma derived therapy market, by product, 2023 - 2032 (USD Million)
- TABLE 67. Spain plasma derived therapy market, by application, 2018 - 2022(USD Million)
- TABLE 68. Spain plasma derived therapy market, by application, 2023 - 2032 (USD Million)
- TABLE 69. Rest of Europe plasma derived therapy market, by product, 2018 - 2022(USD Million)
- TABLE 70. Rest of Europe plasma derived therapy market, by product, 2023 - 2032 (USD Million)
- TABLE 71. Rest of Europe plasma derived therapy market, by application, 2018 - 2022(USD Million)
- TABLE 72. Rest of Europe plasma derived therapy market, by application, 2023 - 2032 (USD Million)
- TABLE 73. Asia Pacific market size, by country, 2018 - 2022(USD Million)
- TABLE 74. Asia Pacific market size, by country, 2023 - 2032 (USD Million)
- TABLE 75. Asia Pacific plasma derived therapy market, by product, 2018 - 2022(USD Million)
- TABLE 76. Asia Pacific plasma derived therapy market, by product, 2023 - 2032 (USD Million)
- TABLE 77. Asia Pacific plasma derived therapy market, by application, 2018 - 2022(USD Million)
- TABLE 78. Asia Pacific plasma derived therapy market, by application, 2023 - 2032 (USD Million)
- TABLE 79. Japan plasma derived therapy market, by product, 2018 - 2022(USD Million)
- TABLE 80. Japan plasma derived therapy market, by product, 2023 - 2032 (USD Million)
- TABLE 81. Japan plasma derived therapy market, by application, 2018 - 2022(USD Million)
- TABLE 82. Japan plasma derived therapy market, by application, 2023 - 2032 (USD Million)
- TABLE 83. China plasma derived therapy market, by product, 2018 - 2022(USD Million)
- TABLE 84. China plasma derived therapy market, by product, 2023 - 2032 (USD Million)
- TABLE 85. China plasma derived therapy market, by application, 2018 - 2022(USD Million)
- TABLE 86. China plasma derived therapy market, by application, 2023 - 2032 (USD Million)
- TABLE 87. India plasma derived therapy market, by product, 2018 - 2022(USD Million)
- TABLE 88. India plasma derived therapy market, by product, 2023 - 2032 (USD Million)
- TABLE 89. India plasma derived therapy market, by application, 2018 - 2022(USD Million)
- TABLE 90. India plasma derived therapy market, by application, 2023 - 2032 (USD Million)
- TABLE 91. Australia plasma derived therapy market, by product, 2018 - 2022(USD Million)
- TABLE 92. Australia plasma derived therapy market, by product, 2023 - 2032 (USD Million)
- TABLE 93. Australia plasma derived therapy market, by application, 2018 - 2022(USD Million)
- TABLE 94. Australia plasma derived therapy market, by application, 2023 - 2032 (USD Million)
- TABLE 95. Rest of Asia Pacific plasma derived therapy market, by product, 2018 - 2022(USD Million)
- TABLE 96. Rest of Asia Pacific plasma derived therapy market, by product, 2023 - 2032 (USD Million)
- TABLE 97. Rest of Asia Pacific plasma derived therapy market, by application, 2018 - 2022(USD Million)
- TABLE 98. Rest of Asia Pacific plasma derived therapy market, by application, 2023 - 2032 (USD Million)
- TABLE 99. Latin America market size, by country, 2018 - 2022(USD Million)
- TABLE 100. Latin America market size, by country, 2023 - 2032 (USD Million)
- TABLE 101. Latin America plasma derived therapy market, by product, 2018 - 2022(USD Million)
- TABLE 102. Latin America plasma derived therapy market, by product, 2023 - 2032 (USD Million)
- TABLE 103. Latin America plasma derived therapy market, by application, 2018 - 2022(USD Million)
- TABLE 104. Latin America plasma derived therapy market, by application, 2023 - 2032 (USD Million)
- TABLE 105. Brazil plasma derived therapy market, by product, 2018 - 2022(USD Million)
- TABLE 106. Brazil plasma derived therapy market, by product, 2023 - 2032 (USD Million)
- TABLE 107. Brazil plasma derived therapy market, by application, 2018 - 2022(USD Million)
- TABLE 108. Brazil plasma derived therapy market, by application, 2023 - 2032 (USD Million)
- TABLE 109. Mexico plasma derived therapy market, by product, 2018 - 2022(USD Million)
- TABLE 110. Mexico plasma derived therapy market, by product, 2023 - 2032 (USD Million)
- TABLE 111. Mexico plasma derived therapy market, by application, 2018 - 2022(USD Million)
- TABLE 112. Mexico plasma derived therapy market, by application, 2023 - 2032 (USD Million)
- TABLE 113. Argentina plasma derived therapy market, by product, 2018 - 2022(USD Million)
- TABLE 114. Argentina plasma derived therapy market, by product, 2023 - 2032 (USD Million)
- TABLE 115. Argentina plasma derived therapy market, by application, 2018 - 2022(USD Million)
- TABLE 116. Argentina plasma derived therapy market, by application, 2023 - 2032 (USD Million)
- TABLE 117. Rest of Latin America plasma derived therapy market, by product, 2018 - 2022(USD Million)
- TABLE 118. Rest of Latin America plasma derived therapy market, by product, 2023 - 2032 (USD Million)
- TABLE 119. Rest of Latin America plasma derived therapy market, by application, 2018 - 2022(USD Million)
- TABLE 120. Rest of Latin America plasma derived therapy market, by application, 2023 - 2032 (USD Million)
- TABLE 121. Middle East & Africa market size, by country, 2018 - 2022(USD Million)
- TABLE 122. Middle East & Africa market size, by country, 2023 - 2032 (USD Million)
- TABLE 123. Middle East & Africa plasma derived therapy market, by product, 2018 - 2022(USD Million)
- TABLE 124. Middle East & Africa plasma derived therapy market, by product, 2023 - 2032 (USD Million)
- TABLE 125. Middle East & Africa plasma derived therapy market, by application, 2018 - 2022(USD Million)
- TABLE 126. Middle East & Africa plasma derived therapy market, by application, 2023 - 2032 (USD Million)
- TABLE 127. South Africa plasma derived therapy market, by product, 2018 - 2022(USD Million)
- TABLE 128. South Africa plasma derived therapy market, by product, 2023 - 2032 (USD Million)
- TABLE 129. South Africa plasma derived therapy market, by application, 2018 - 2022(USD Million)
- TABLE 130. South Africa plasma derived therapy market, by application, 2023 - 2032 (USD Million)
- TABLE 131. Saudi Arabia plasma derived therapy market, by product, 2018 - 2022(USD Million)
- TABLE 132. Saudi Arabia plasma derived therapy market, by product, 2023 - 2032 (USD Million)
- TABLE 133. Saudi Arabia plasma derived therapy market, by application, 2018 - 2022(USD Million)
- TABLE 134. Saudi Arabia plasma derived therapy market, by application, 2023 - 2032 (USD Million)
- TABLE 135. UAE plasma derived therapy market, by product, 2018 - 2022(USD Million)
- TABLE 136. UAE plasma derived therapy market, by product, 2023 - 2032 (USD Million)
- TABLE 137. UAE plasma derived therapy market, by application, 2018 - 2022(USD Million)
- TABLE 138. UAE plasma derived therapy market, by application, 2023 - 2032 (USD Million)
- TABLE 139. Rest of Middle East & Africa plasma derived therapy market, by product, 2018 - 2022(USD Million)
- TABLE 140. Rest of Middle East & Africa plasma derived therapy market, by product, 2023 - 2032 (USD Million)
- TABLE 141. Rest of Middle East & Africa plasma derived therapy market, by application, 2018 - 2022(USD Million)
- TABLE 142. Rest of Middle East & Africa plasma derived therapy market, by application, 2023 - 2032 (USD Million)
Charts & Figures
- FIG 1 GMI report coverage: Critical research elements
- FIG 2 Top-down approach
- FIG 3 Market estimation and forecast methodology
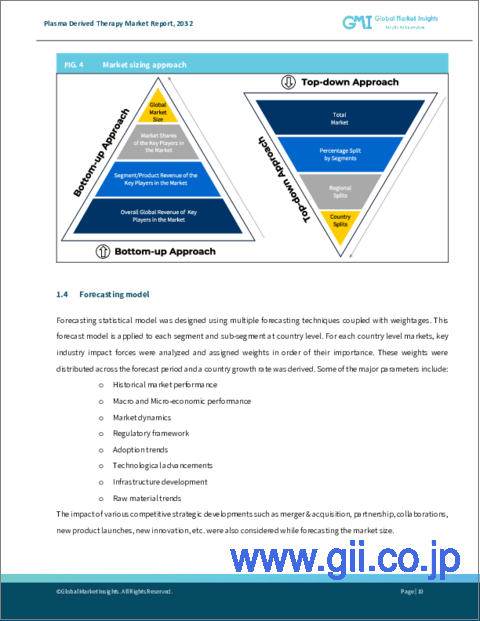
- FIG 4 Market forecasting methodology
- FIG 5 Breakdown of primary participants
- FIG 6 Plasma derived therapy industry 360 degree synopsis, 2018 - 2032
- FIG 7 Growth potential analysis, by product
- FIG 8 Growth potential analysis, by application
- FIG 9 Porter's analysis
- FIG 10 PESTEL analysis
- FIG 11 Company matrix analysis, 2022
- FIG 12 Competitive analysis of major market players, 2022
- FIG 13 Competitive positioning matrix, 2022
- FIG 14 Strategic dashboard, 2022
Global Plasma Derived Therapy Market will grow at a 7.5% CAGR between 2023 and 2032, owing to the expanding network of plasma collection centers and manufacturing facilities. The continuous growth of these infrastructure elements addresses the escalating demand for plasma-derived therapies. With increased accessibility to plasma, the market experiences a boost in the production of therapeutic products, ensuring a more robust supply chain. This expansion will play a pivotal role in meeting the growing global demand for plasma-derived therapies and will significantly contribute to the market's overall development.
For instance, in 2023, Takeda Pharmaceutical, a Japanese biopharmaceutical company, is constructing a state-of-the-art facility in Osaka, the largest of its kind in Japan, to manufacture plasma-derived therapies (PDTs). This strategic initiative enhances Takeda's manufacturing and supply capabilities, meeting the growing global demand for PDTs and addressing increased patient needs in Japan and beyond. This move marks Takeda's significant contribution to strengthening the plasma-derived therapy market, augmenting production capabilities to meet global demand, and addressing increasing patient needs.
The plasma derived therapy industry is fragmented based on product, application, and region.
The albumin segment will establish a significant market foothold by 2032, fueled by the versatile applications and essential role of albumin in various medical interventions. As a crucial plasma protein with widespread therapeutic uses, including in critical care, surgery, and trauma, albumin will stand out for its indispensable value. With a rising demand for albumin-based therapies, this segment will play a pivotal role in shaping the plasma derived therapy industry outlook.
The plasma derived therapy market size idiopathic/immune thrombocytopenic purpura (ITP) segment will witness substantial growth through 2032, attributed to the escalating incidence of ITP and the growing recognition of plasma-derived therapies as effective interventions. With an increasing focus on addressing autoimmune disorders, particularly ITP, the demand for targeted and reliable therapies is rising. Ongoing advancements in medical research and therapeutic innovation will further position the ITP segment as a key contributor to the expanding landscape of plasma-derived therapies, addressing critical healthcare needs.
Europe will register a notable CAGR during 2023 and 2032 due to its advanced healthcare infrastructure and robust research and development efforts. The rising prevalence of plasma-related disorders adds momentum to this trend. Europe's healthcare landscape, marked by technological advancements and a commitment to medical innovation, underscores its pivotal role in shaping the trajectory of the plasma derived therapy industry, making it a primary contributor to the industry growth and development.
Table of Contents
Chapter 1 Methodology & Scope
- 1.1 Market definition
- 1.2 Base estimates & calculations
- 1.3 Forecast calculation
- 1.1 Covid-19 impact analysis at global level
- 1.2 Data validation
- 1.3 Data sources
- 1.3.1 Primary
- 1.3.2 Secondary
- 1.3.2.1 Paid sources
- 1.3.2.2 Public sources
Chapter 2 Executive Summary
- 2.1 Plasma derived therapy industry 360 degree synopsis, 2018 - 2032
- 2.1.1 Business trends
- 2.1.2 Product trends
- 2.1.3 Application trends
- 2.1.4 Regional trends
Chapter 3 Plasma Derived Therapy Market Insights
- 3.1 Industry segmentation
- 3.2 Industry landscape, 2018 - 2032 (USD Million)
- 3.3 Industry impact forces
- 3.3.1 Growth drivers
- 3.3.1.1 Increasing prevalence of rare diseases
- 3.3.1.2 Growing demand for advanced therapeutic for treatment of genetic disorders
- 3.3.1.3 Increase in number of plasma collection centers across the globe
- 3.3.1.4 Rising adoption of immunoglobulins across the nation
- 3.3.2 Industry pitfalls and challenges
- 3.3.2.1 Stringent regulatory policies
- 3.3.1 Growth drivers
- 3.4 Growth potential analysis
- 3.4.1 By product
- 3.4.2 By application
- 3.5 COVID-19 impact analysis
- 3.6 Regulatory landscape
- 3.6.1 U.S.
- 3.6.2 Europe
- 3.7 Porter's analysis
- 3.8 PESTEL analysis
Chapter 4 Competitive Landscape, 2022
- 4.1 Introduction
- 4.2 Company matrix analysis, 2022
- 4.3 Competitive analysis of major market players, 2022
- 4.4 Competitive positioning matrix, 2022
- 4.5 Strategic dashboard, 2022
Chapter 5 Plasma Derived Therapy Market Estimates and Forecast, By Product, 2018-2032 (USD Million)
- 5.1 Key trends, by product
- 5.2 Immunoglobulins
- 5.3 Coagulation factors
- 5.4 Albumin
- 5.5 Other products
Chapter 6 Plasma Derived Therapy Market Estimates and Forecast, By Application, 2018-2032 (USD Million)
- 6.1 Key trends, by application
- 6.2 Hemophilia
- 6.3 Primary immunodeficiency diseases
- 6.4 Idiopathic/Immune thrombocytopenic purpura (ITP)
- 6.5 Other applications
Chapter 7 Plasma Derived Therapy Market Estimates and Forecast, By Region, 2018 - 2032 (USD Million)
- 7.1 Key trends, by region
- 7.2 North America
- 7.2.1 U.S.
- 7.2.2 Canada
- 7.3 Europe
- 7.3.1 Germany
- 7.3.2 UK
- 7.3.3 France
- 7.3.4 Spain
- 7.3.5 Italy
- 7.3.6 Rest of Europe
- 7.4 Asia Pacific
- 7.4.1 China
- 7.4.2 Japan
- 7.4.3 India
- 7.4.4 Australia
- 7.4.5 Rest of Asia Pacific
- 7.5 Latin America
- 7.5.1 Brazil
- 7.5.2 Mexico
- 7.5.3 Argentina
- 7.5.4 Rest of Latin America
- 7.6 Middle East & Africa
- 7.6.1 South Africa
- 7.6.2 Saudi Arabia
- 7.6.3 UAE
- 7.6.4 Rest of Middle East & Africa
Chapter 8 Company Profiles
- 8.1 CSL Behring
- 8.2 Takeda Pharmaceutical Company Limited.
- 8.3 Biotest AG
- 8.4 Octapharma
- 8.5 BPL
- 8.6 ADMA Biologics
- 8.7 Grifols, SA
- 8.8 Kedrion
- 8.9 Kamada Pharmaceuticals.
- 8.10 SK Plasma
- 8.11 Pfizer, Inc.