|
|
市場調査レポート
商品コード
1176535
ヘルスケア向けAR (拡張現実)・VR (仮想現実) の世界市場 (2023年~2032年):市場規模 (技術・コンポーネント・用途・エンドユーザー別)・地域的展望・成長の潜在性・競合市場シェア・予測Augmented and Virtual Reality in Healthcare Market Size By Technology, By Component, By Application By End-use, Industry Analysis Report, Regional Outlook, Growth Potential, Competitive Market Share & Forecast, 2023 - 2032 |
||||||
|
|
|||||||
|
● お客様のご希望に応じて、既存データの加工や未掲載情報(例:国別セグメント)の追加などの対応が可能です。 詳細はお問い合わせください。 |
|||||||


| ヘルスケア向けAR (拡張現実)・VR (仮想現実) の世界市場 (2023年~2032年):市場規模 (技術・コンポーネント・用途・エンドユーザー別)・地域的展望・成長の潜在性・競合市場シェア・予測 |
|
出版日: 2022年12月08日
発行: Global Market Insights Inc.
ページ情報: 英文 154 Pages
納期: 2~3営業日
|
- 全表示
- 概要
- 図表
- 目次
ヘルスケア向けAR (拡張現実)・VR (仮想現実) の市場は、ヘルスケア分野におけるAR・VR用途のR&Dへの投資が増加していることから、2032年にかけて大きな成長を示すと予測されています。
また、AR・VR技術と統合された遠隔健康プラットフォームの採用が増加しており、産業の拡大をさらに後押しすると予想されています。
技術別で見ると、ロボット手術、手術シミュレーション、技能訓練などの分野で広く応用されていることから、VRの部門が飛躍的に成長すると予想されています。また、コンポーネント別では、サービスの部門が2032年にかけて17%のCAGRで成長すると予測されています。この成長は、さまざまなベンダーが提供するデジタルヘルスサービスの導入と認知度の上昇に起因しています。
当レポートでは、世界のヘルスケア向けAR (拡張現実)・VR (仮想現実) の市場を調査し、市場概要、市場成長への各種影響因子の分析、法規制環境、技術・イノベーションの情勢、特許動向、市場規模の推移・予測、各種区分・地域/主要国別の内訳、競合環境、主要企業のプロファイルなどをまとめています。
目次
第1章 調査手法・調査範囲
第2章 エグゼクティブサマリー
第3章 ヘルスケア向けAR (拡張現実)・VR (仮想現実) 産業の考察
- 産業の分類
- 産業情勢
- 産業への影響要因
- 促進要因
- 潜在的リスク&課題
- 成長性分析
- COVID-19影響分析
- バリューチェーン分析
- 技術ロードマップ
- 製品ライフサイクル分析
- ポーターの分析
- PESTEL分析
第4章 競合情勢
- 企業マトリックス分析
- 戦略ダッシュボード
第5章 ヘルスケア向けAR (拡張現実)・VR (仮想現実) 市場:技術別
- 主要動向
- AR (拡張現実)
- VR (仮想現実)
第6章 ヘルスケア向けAR (拡張現実)・VR (仮想現実) 市場:コンポーネント別
- 主要動向
- ハードウェア
- ソフトウェア
- サービス
第7章 ヘルスケア向けAR (拡張現実)・VR (仮想現実) 市場:用途別
- 主要動向
- 手術
- トレーニングと教育
- 行動療法
- 医療画像処理
- その他
第8章 ヘルスケア向けAR (拡張現実)・VR (仮想現実) 市場:エンドユーザー別
- 主要動向
- 学術機関
- 病院
- クリニック/ 歯科医
- その他
第9章 ヘルスケア向けAR (拡張現実)・VR (仮想現実) 市場:地域別
- 主な地域動向
- 北米
- 欧州
- アジア太平洋
- ラテンアメリカ
- 中東・アフリカ
第10章 企業プロファイル
- Augmedics
- Augmedix, Inc.
- FundamentalVR
- Hologic Inc.
- Intuitive Surgical, Inc.
- Karuna Labs Inc.
- Medical Augmented Intelligence(MAI)
- MindMaze
- Amelia Virtual Care
- Surgical Theater, Inc
Data Tables
- TABLE 1. Global augmented and virtual reality in healthcare market size, 2018 - 2022 (USD Million)
- TABLE 2. Global augmented and virtual reality in healthcare market size, 2023 - 2032 (USD Million)
- TABLE 3. Global augmented and virtual reality in healthcare market, by technology, 2018 - 2022 (USD Million)
- TABLE 4. Global augmented and virtual reality in healthcare market, by technology, 2023 - 2032 (USD Million)
- TABLE 5. Global augmented and virtual reality in healthcare market, by component, 2018 - 2022 (USD Million)
- TABLE 6. Global augmented and virtual reality in healthcare market, by component, 2023 - 2032 (USD Million)
- TABLE 7. Global augmented and virtual reality in healthcare market, by application, 2018 - 2022 (USD Million)
- TABLE 8. Global augmented and virtual reality in healthcare market, by application, 2023 - 2032 (USD Million)
- TABLE 9. Global augmented and virtual reality in healthcare market, by end-use, 2018 - 2022 (USD Million)
- TABLE 10. Global augmented and virtual reality in healthcare market, by end-use, 2023 - 2032 (USD Million)
- TABLE 11. Global augmented and virtual reality in healthcare market, by region, 2018 - 2022 (USD Million)
- TABLE 12. Global augmented and virtual reality in healthcare market, by region, 2023 - 2032 (USD Million)
- TABLE 13. Industry impact forces
- TABLE 14. Augmented reality market size, by region, 2018 - 2022, (USD Million)
- TABLE 15. Augmented reality market size, by region, 2023 - 2032, (USD Million)
- TABLE 16. Virtual reality market size, by region, 2018 - 2022, (USD Million)
- TABLE 17. Virtual reality market size, by region, 2023-2032, (USD Million)
- TABLE 18. Hardware market size, by region, 2018 - 2022, (USD Million)
- TABLE 19. Hardware market size, by region, 2023-2032, (USD Million)
- TABLE 20. Software market size, by region, 2018 - 2022, (USD Million)
- TABLE 21. Software market size, by region, 2023-2032, (USD Million)
- TABLE 22. Services market size, by region, 2018 - 2022, (USD Million)
- TABLE 23. Services market size, by region, 2023-2032, (USD Million)
- TABLE 24. Surgery market size, by region, 2018 - 2022, (USD Million)
- TABLE 25. Surgery market size, by region, 2023-2032, (USD Million)
- TABLE 26. Training & education market size, by region, 2018 - 2022, (USD Million)
- TABLE 27. Training & education market size, by region, 2023-2032, (USD Million)
- TABLE 28. Behavioural therapy market size, by region, 2018 - 2022, (USD Million)
- TABLE 29. Behavioural therapy market size, by region, 2023-2032, (USD Million)
- TABLE 30. Medical imaging market size, by region, 2018 - 2022, (USD Million)
- TABLE 31. Medical imaging market size, by region, 2023-2032, (USD Million)
- TABLE 32. Others market, by region, 2018 - 2022, (USD Million)
- TABLE 33. Others market, by region, 2023-2032, (USD Million)
- TABLE 34. Academic Institutions market size, by region, 2018 - 2022, (USD Million)
- TABLE 35. Academic Institutions market size, by region, 2023-2032, (USD Million)
- TABLE 36. Hospitals market size, by region, 2018 - 2022, (USD Million)
- TABLE 37. Hospitals market size, by region, 2023-2032, (USD Million)
- TABLE 38. Clinics / Dentist market size, by region, 2018 - 2022, (USD Million)
- TABLE 39. Clinics / Dentist market size, by region, 2023-2032, (USD Million)
- TABLE 40. Others market, by region, 2018 - 2022, (USD Million)
- TABLE 41. Others market, by region, 2023-2032, (USD Million)
- TABLE 42. North America augmented and virtual reality in healthcare market size, by country, 2018-2022, (USD Million)
- TABLE 43. North America augmented and virtual reality in healthcare market size, by country, 2023-2032, (USD Million)
- TABLE 44. North America augmented and virtual reality in healthcare market size, by technology, 2018-2022, (USD Million)
- TABLE 45. North America augmented and virtual reality in healthcare market size, by technology, 2023-2032, (USD Million)
- TABLE 46. North America augmented and virtual reality in healthcare market size, by component, 2018-2022, (USD Million)
- TABLE 47. North America augmented and virtual reality in healthcare market size, by component, 2023-2032, (USD Million)
- TABLE 48. North America augmented and virtual reality in healthcare market size, by application, 2018-2022, (USD Million)
- TABLE 49. North America augmented and virtual reality in healthcare market size, by application, 2023-2032, (USD Million)
- TABLE 50. North America augmented and virtual reality in healthcare market size, by end-use, 2018-2022, (USD Million)
- TABLE 51. North America augmented and virtual reality in healthcare market size, by end-use, 2023-2032, (USD Million)
- TABLE 52. U.S. augmented and virtual reality in healthcare market size, by technology, 2018-2022, (USD Million)
- TABLE 53. U.S. augmented and virtual reality in healthcare market size, by technology, 2023-2032, (USD Million)
- TABLE 54. U.S. augmented and virtual reality in healthcare market size, by component, 2018-2022, (USD Million)
- TABLE 55. U.S. augmented and virtual reality in healthcare market size, by component, 2023-2032, (USD Million)
- TABLE 56. U.S. augmented and virtual reality in healthcare market size, by application, 2018-2022, (USD Million)
- TABLE 57. U.S. augmented and virtual reality in healthcare market size, by application, 2023-2032, (USD Million)
- TABLE 58. U.S. augmented and virtual reality in healthcare market size, by end-use, 2018-2022, (USD Million)
- TABLE 59. U.S. augmented and virtual reality in healthcare market size, by end-use, 2023-2032, (USD Million)
- TABLE 60. Canada augmented and virtual reality in healthcare market size, by technology, 2018-2022, (USD Million)
- TABLE 61. Canada augmented and virtual reality in healthcare market size, by technology, 2023-2032, (USD Million)
- TABLE 62. Canada augmented and virtual reality in healthcare market size, by component, 2018-2022, (USD Million)
- TABLE 63. Canada augmented and virtual reality in healthcare market size, by component, 2023-2032, (USD Million)
- TABLE 64. Canada augmented and virtual reality in healthcare market size, by application, 2018-2022, (USD Million)
- TABLE 65. Canada augmented and virtual reality in healthcare market size, by application, 2023-2032, (USD Million)
- TABLE 66. Canada augmented and virtual reality in healthcare market size, by end-use, 2018-2022, (USD Million)
- TABLE 67. Canada augmented and virtual reality in healthcare market size, by end-use, 2023-2032, (USD Million)
- TABLE 68. Europe augmented and virtual reality in healthcare market size, by country, 2018-2022, (USD Million)
- TABLE 69. Europe augmented and virtual reality in healthcare market size, by country, 2023-2032, (USD Million)
- TABLE 70. Europe augmented and virtual reality in healthcare market size, by technology, 2018-2022, (USD Million)
- TABLE 71. Europe augmented and virtual reality in healthcare market size, by technology, 2023-2032, (USD Million)
- TABLE 72. Europe augmented and virtual reality in healthcare market size, by component, 2018-2022, (USD Million)
- TABLE 73. Europe augmented and virtual reality in healthcare market size, by component, 2023-2032, (USD Million)
- TABLE 74. Europe augmented and virtual reality in healthcare market size, by application, 2018-2022, (USD Million)
- TABLE 75. Europe augmented and virtual reality in healthcare market size, by application, 2023-2032, (USD Million)
- TABLE 76. Europe augmented and virtual reality in healthcare market size, by end-use, 2018-2022, (USD Million)
- TABLE 77. Europe augmented and virtual reality in healthcare market size, by end-use, 2023-2032, (USD Million)
- TABLE 78. UK augmented and virtual reality in healthcare market size, by technology, 2018-2022, (USD Million)
- TABLE 79. UK augmented and virtual reality in healthcare market size, by technology, 2023-2032, (USD Million)
- TABLE 80. UK augmented and virtual reality in healthcare market size, by component, 2018-2022, (USD Million)
- TABLE 81. UK augmented and virtual reality in healthcare market size, by component, 2023-2032, (USD Million)
- TABLE 82. UK augmented and virtual reality in healthcare market size, by application, 2018-2022, (USD Million)
- TABLE 83. UK augmented and virtual reality in healthcare market size, by application, 2023-2032, (USD Million)
- TABLE 84. UK augmented and virtual reality in healthcare market size, by end-use, 2018-2022, (USD Million)
- TABLE 85. UK augmented and virtual reality in healthcare market size, by end-use, 2023-2032, (USD Million)
- TABLE 86. France augmented and virtual reality in healthcare market size, by technology, 2018-2022, (USD Million)
- TABLE 87. France augmented and virtual reality in healthcare market size, by technology, 2023-2032, (USD Million)
- TABLE 88. France augmented and virtual reality in healthcare market size, by component, 2018-2022, (USD Million)
- TABLE 89. France augmented and virtual reality in healthcare market size, by component, 2023-2032, (USD Million)
- TABLE 90. France augmented and virtual reality in healthcare market size, by application, 2018-2022, (USD Million)
- TABLE 91. France augmented and virtual reality in healthcare market size, by application, 2023-2032, (USD Million)
- TABLE 92. France augmented and virtual reality in healthcare market size, by end-use, 2018-2022, (USD Million)
- TABLE 93. France augmented and virtual reality in healthcare market size, by end-use, 2023-2032, (USD Million)
- TABLE 94. Germany augmented and virtual reality in healthcare market size, by technology, 2018-2022, (USD Million)
- TABLE 95. Germany augmented and virtual reality in healthcare market size, by technology, 2023-2032, (USD Million)
- TABLE 96. Germany augmented and virtual reality in healthcare market size, by component, 2018-2022, (USD Million)
- TABLE 97. Germany augmented and virtual reality in healthcare market size, by component, 2023-2032, (USD Million)
- TABLE 98. Germany augmented and virtual reality in healthcare market size, by application, 2018-2022, (USD Million)
- TABLE 99. Germany augmented and virtual reality in healthcare market size, by application, 2023-2032, (USD Million)
- TABLE 100. Germany augmented and virtual reality in healthcare market size, by end-use, 2018-2022, (USD Million)
- TABLE 101. Germany augmented and virtual reality in healthcare market size, by end-use, 2023-2032, (USD Million)
- TABLE 102. Italy augmented and virtual reality in healthcare market size, by technology, 2018-2022, (USD Million)
- TABLE 103. Italy augmented and virtual reality in healthcare market size, by technology, 2023-2032, (USD Million)
- TABLE 104. Italy augmented and virtual reality in healthcare market size, by component, 2018-2022, (USD Million)
- TABLE 105. Italy augmented and virtual reality in healthcare market size, by component, 2023-2032, (USD Million)
- TABLE 106. Italy augmented and virtual reality in healthcare market size, by application, 2018-2022, (USD Million)
- TABLE 107. Italy augmented and virtual reality in healthcare market size, by application, 2023-2032, (USD Million)
- TABLE 108. Italy augmented and virtual reality in healthcare market size, by end-use, 2018-2022, (USD Million)
- TABLE 109. Italy augmented and virtual reality in healthcare market size, by end-use, 2023-2032, (USD Million)
- TABLE 110. Spain augmented and virtual reality in healthcare market size, by technology, 2018-2022, (USD Million)
- TABLE 111. Spain augmented and virtual reality in healthcare market size, by technology, 2023-2032, (USD Million)
- TABLE 112. Spain augmented and virtual reality in healthcare market size, by component, 2018-2022, (USD Million)
- TABLE 113. Spain augmented and virtual reality in healthcare market size, by component, 2023-2032, (USD Million)
- TABLE 114. Spain augmented and virtual reality in healthcare market size, by application, 2018-2022, (USD Million)
- TABLE 115. Spain augmented and virtual reality in healthcare market size, by application, 2023-2032, (USD Million)
- TABLE 116. Spain augmented and virtual reality in healthcare market size, by end-use, 2018-2022, (USD Million)
- TABLE 117. Spain augmented and virtual reality in healthcare market size, by end-use, 2023-2032, (USD Million)
- TABLE 118. Asia Pacific augmented and virtual reality in healthcare market size, by country, 2018-2022, (USD Million)
- TABLE 119. Asia Pacific augmented and virtual reality in healthcare market size, by country, 2023-2032, (USD Million)
- TABLE 120. Asia Pacific augmented and virtual reality in healthcare market size, by technology, 2018-2022, (USD Million)
- TABLE 121. Asia Pacific augmented and virtual reality in healthcare market size, by technology, 2023-2032, (USD Million)
- TABLE 122. Asia Pacific augmented and virtual reality in healthcare market size, by component, 2018-2022, (USD Million)
- TABLE 123. Asia Pacific augmented and virtual reality in healthcare market size, by component, 2023-2032, (USD Million)
- TABLE 124. Asia Pacific augmented and virtual reality in healthcare market size, by application, 2018-2022, (USD Million)
- TABLE 125. Asia Pacific augmented and virtual reality in healthcare market size, by application, 2023-2032, (USD Million)
- TABLE 126. Asia Pacific augmented and virtual reality in healthcare market size, by end-use, 2018-2022, (USD Million)
- TABLE 127. Asia Pacific augmented and virtual reality in healthcare market size, by end-use, 2023-2032, (USD Million)
- TABLE 128. India augmented and virtual reality in healthcare market size, by technology, 2018-2022, (USD Million)
- TABLE 129. India augmented and virtual reality in healthcare market size, by technology, 2023-2032, (USD Million)
- TABLE 130. India augmented and virtual reality in healthcare market size, by component, 2018-2022, (USD Million)
- TABLE 131. India augmented and virtual reality in healthcare market size, by component, 2023-2032, (USD Million)
- TABLE 132. India augmented and virtual reality in healthcare market size, by application, 2018-2022, (USD Million)
- TABLE 133. India augmented and virtual reality in healthcare market size, by application, 2023-2032, (USD Million)
- TABLE 134. India augmented and virtual reality in healthcare market size, by end-use, 2018-2022, (USD Million)
- TABLE 135. India augmented and virtual reality in healthcare market size, by end-use, 2023-2032, (USD Million)
- TABLE 136. China augmented and virtual reality in healthcare market size, by technology, 2018-2022, (USD Million)
- TABLE 137. China augmented and virtual reality in healthcare market size, by technology, 2023-2032, (USD Million)
- TABLE 138. China augmented and virtual reality in healthcare market size, by component, 2018-2022, (USD Million)
- TABLE 139. China augmented and virtual reality in healthcare market size, by component, 2023-2032, (USD Million)
- TABLE 140. China augmented and virtual reality in healthcare market size, by application, 2018-2022, (USD Million)
- TABLE 141. China augmented and virtual reality in healthcare market size, by application, 2023-2032, (USD Million)
- TABLE 142. China augmented and virtual reality in healthcare market size, by end-use, 2018-2022, (USD Million)
- TABLE 143. China augmented and virtual reality in healthcare market size, by end-use, 2023-2032, (USD Million)
- TABLE 144. Japan augmented and virtual reality in healthcare market size, by technology, 2018-2022, (USD Million)
- TABLE 145. Japan augmented and virtual reality in healthcare market size, by technology, 2023-2032, (USD Million)
- TABLE 146. Japan augmented and virtual reality in healthcare market size, by component, 2018-2022, (USD Million)
- TABLE 147. Japan augmented and virtual reality in healthcare market size, by component, 2023-2032, (USD Million)
- TABLE 148. Japan augmented and virtual reality in healthcare market size, by application, 2018-2022, (USD Million)
- TABLE 149. Japan augmented and virtual reality in healthcare market size, by application, 2023-2032, (USD Million)
- TABLE 150. Japan augmented and virtual reality in healthcare market size, by end-use, 2018-2022, (USD Million)
- TABLE 151. Japan augmented and virtual reality in healthcare market size, by end-use, 2023-2032, (USD Million)
- TABLE 152. Australia augmented and virtual reality in healthcare market size, by technology, 2018-2022, (USD Million)
- TABLE 153. Australia augmented and virtual reality in healthcare market size, by technology, 2023-2032, (USD Million)
- TABLE 154. Australia augmented and virtual reality in healthcare market size, by component, 2018-2022, (USD Million)
- TABLE 155. Australia augmented and virtual reality in healthcare market size, by component, 2023-2032, (USD Million)
- TABLE 156. Australia augmented and virtual reality in healthcare market size, by application, 2018-2022, (USD Million)
- TABLE 157. Australia augmented and virtual reality in healthcare market size, by application, 2023-2032, (USD Million)
- TABLE 158. Australia augmented and virtual reality in healthcare market size, by end-use, 2018-2022, (USD Million)
- TABLE 159. Australia augmented and virtual reality in healthcare market size, by end-use, 2023-2032, (USD Million)
- TABLE 160. Latin America augmented and virtual reality in healthcare market size, by country, 2018-2022, (USD Million)
- TABLE 161. Latin America augmented and virtual reality in healthcare market size, by country, 2023-2032, (USD Million)
- TABLE 162. Latin America augmented and virtual reality in healthcare market size, by technology, 2018-2022, (USD Million)
- TABLE 163. Latin America augmented and virtual reality in healthcare market size, by technology, 2023-2032, (USD Million)
- TABLE 164. Latin America augmented and virtual reality in healthcare market size, by component, 2018-2022, (USD Million)
- TABLE 165. Latin America augmented and virtual reality in healthcare market size, by component, 2023-2032, (USD Million)
- TABLE 166. Latin America augmented and virtual reality in healthcare market size, by application, 2018-2022, (USD Million)
- TABLE 167. Latin America augmented and virtual reality in healthcare market size, by application, 2023-2032, (USD Million)
- TABLE 168. Latin America augmented and virtual reality in healthcare market size, by end-use, 2018-2022, (USD Million)
- TABLE 169. Latin America augmented and virtual reality in healthcare market size, by end-use, 2023-2032, (USD Million)
- TABLE 170. Brazil augmented and virtual reality in healthcare market size, by technology, 2018-2022, (USD Million)
- TABLE 171. Brazil augmented and virtual reality in healthcare market size, by technology, 2023-2032, (USD Million)
- TABLE 172. Brazil augmented and virtual reality in healthcare market size, by component, 2018-2022, (USD Million)
- TABLE 173. Brazil augmented and virtual reality in healthcare market size, by component, 2023-2032, (USD Million)
- TABLE 174. Brazil augmented and virtual reality in healthcare market size, by application, 2018-2022, (USD Million)
- TABLE 175. Brazil augmented and virtual reality in healthcare market size, by application, 2023-2032, (USD Million)
- TABLE 176. Brazil augmented and virtual reality in healthcare market size, by end-use, 2018-2022, (USD Million)
- TABLE 177. Brazil augmented and virtual reality in healthcare market size, by end-use, 2023-2032, (USD Million)
- TABLE 178. Mexico augmented and virtual reality in healthcare market size, by technology, 2018-2022, (USD Million)
- TABLE 179. Mexico augmented and virtual reality in healthcare market size, by technology, 2023-2032, (USD Million)
- TABLE 180. Mexico augmented and virtual reality in healthcare market size, by component, 2018-2022, (USD Million)
- TABLE 181. Mexico augmented and virtual reality in healthcare market size, by component, 2023-2032, (USD Million)
- TABLE 182. Mexico augmented and virtual reality in healthcare market size, by application, 2018-2022, (USD Million)
- TABLE 183. Mexico augmented and virtual reality in healthcare market size, by application, 2023-2032, (USD Million)
- TABLE 184. Mexico augmented and virtual reality in healthcare market size, by end-use, 2018-2022, (USD Million)
- TABLE 185. Mexico augmented and virtual reality in healthcare market size, by end-use, 2023-2032, (USD Million)
- TABLE 186. Middle East & Africa augmented and virtual reality in healthcare market size, by country, 2018-2022, (USD Million)
- TABLE 187. Middle East & Africa augmented and virtual reality in healthcare market size, by country, 2023-2032, (USD Million)
- TABLE 188. Middle East & Africa augmented and virtual reality in healthcare market size, by technology, 2018-2022, (USD Million)
- TABLE 189. Middle East & Africa augmented and virtual reality in healthcare market size, by technology, 2023-2032, (USD Million)
- TABLE 190. Middle East & Africa augmented and virtual reality in healthcare market size, by component, 2018-2022, (USD Million)
- TABLE 191. Middle East & Africa augmented and virtual reality in healthcare market size, by component, 2023-2032, (USD Million)
- TABLE 192. Middle East & Africa augmented and virtual reality in healthcare market size, by application, 2018-2022, (USD Million)
- TABLE 193. Middle East & Africa augmented and virtual reality in healthcare market size, by application, 2023-2032, (USD Million)
- TABLE 194. Middle East & Africa augmented and virtual reality in healthcare market size, by end-use, 2018-2022, (USD Million)
- TABLE 195. Middle East & Africa augmented and virtual reality in healthcare market size, by end-use, 2023-2032, (USD Million)
- TABLE 196. South Africa augmented and virtual reality in healthcare market size, by technology, 2018-2022, (USD Million)
- TABLE 197. South Africa augmented and virtual reality in healthcare market size, by technology, 2023-2032, (USD Million)
- TABLE 198. South Africa augmented and virtual reality in healthcare market size, by component, 2018-2022, (USD Million)
- TABLE 199. South Africa augmented and virtual reality in healthcare market size, by component, 2023-2032, (USD Million)
- TABLE 200. South Africa augmented and virtual reality in healthcare market size, by application, 2018-2022, (USD Million)
- TABLE 201. South Africa augmented and virtual reality in healthcare market size, by application, 2023-2032, (USD Million)
- TABLE 202. South Africa augmented and virtual reality in healthcare market size, by end-use, 2018-2022, (USD Million)
- TABLE 203. South Africa augmented and virtual reality in healthcare market size, by end-use, 2023-2032, (USD Million)
Charts & Figures
- Fig.1 Top-down approach
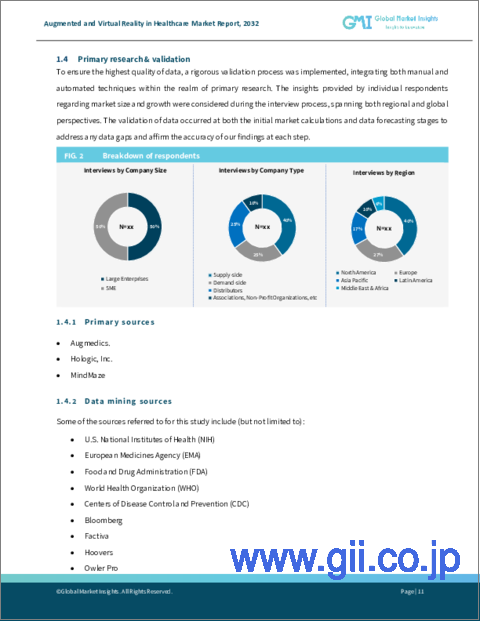
- Fig.2 Breakdown of primary participants
- Fig.3 Augmented and virtual reality in healthcare industry 360 degree synopsis, 2018 - 2032
- Fig.4 Industry segmentation
- Fig.5 Industry landscape, 2018-2032 (USD Million)
- Fig.6 Growth potential analysis, by technology
- Fig.7 Growth potential analysis, by component
- Fig.8 Growth potential analysis, by application
- Fig.9 Growth potential analysis, by end-use
- Fig.10 Value chain analysis
- Fig.11 Technology roadmap
- Fig.12 Product lifecycle analysis
- Fig.13 Company matrix analysis, 2022
- Fig.14 Strategy dashboard, 2022
- Fig.15 Key segment trends, by technology
- Fig.16 Key segment trends, by component
- Fig.17 Key segment trends, by application
- Fig.18 Key segment trends, by end-use
- Fig.19 Key regional trends
Augmented and Virtual Reality in Healthcare Market is slated to witness massive growth through 2032, owing to the increasing investments in R&D around augmented and virtual reality applications across the healthcare sector.
In addition, the rising adoption of telehealth platforms that are integrated with AR/VR technologies in healthcare is further anticipated to bolster the industry's expansion. COVID-19 has as well added to the prominence of telehealth as it allows video or telephonic appointments between healthcare professionals and patients from a remote location. It also minimizes the need for in-person visits, augmenting the market growth between 2023 and 2032.
Certain regulations, such as obtaining FDA 510(k) clearance for launch in U.S. market or receiving consent from patients while collecting clinical data for AR/VR devices, are projected to act as a barrier for this market. Nevertheless, investments made by the key players and government funding to explore more applications of AR/VR in healthcare are slated to drive the market through the stipulated timespan.
Overall, augmented and virtual reality in healthcare market is bifurcated in terms of technology, component, application, end-use, and region.
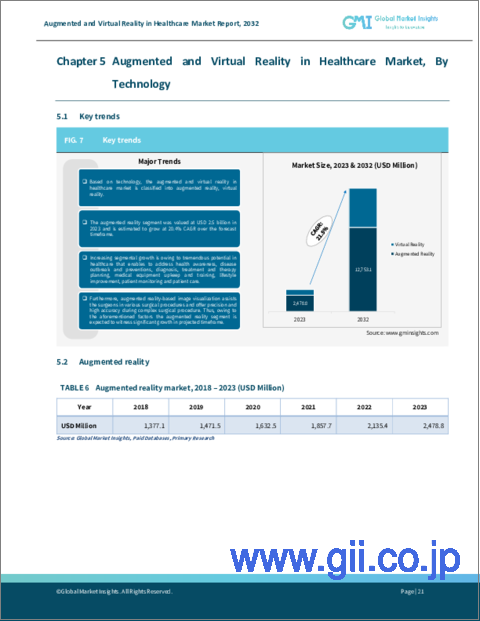
Based on technology, the virtual reality segment is slated to grow exponentially owing to its widespread applications in areas such as robotic surgery, surgery simulation, and skills training. In addition, the ease offered by VR to medical professionals and trainees during performing and learning surgical procedures will further enhance the segmental growth.
On the basis of component, the services segment is expected to depict 17% CAGR through 2032. The growth can be attributed to the rising adoption and awareness of digital health services provided by various vendors.
Considering the application, the medical imaging segment held over 19% market share in 2022 and is expected to offer high growth prospects to the market. The growth can be credited to several initiatives taken by key players to develop AR/VR-supported medical imaging devices and software.
In terms of end-user, the hospital segment is slated to grow through 2032, owing to the rising deployment of AR-based products in hospital settings, which offer more effective care and trim the cost. Additionally, the availability of well-trained staff and favorable reimbursement policies will also support the segmental expansion in the future.
Regionally, the Asia Pacific augmented and virtual reality in healthcare market is projected to exhibit more than 21.5% CAGR during the analysis timeframe. The regional expansion can be attributed to factors including rapidly growing economies, huge patient population, and growing healthcare spending especially in the highly populated countries of the continent.
Table of Contents
Chapter 1 Methodology & Scope
- 1.1 Market definitions
- 1.2 Base estimates & working
- 1.2.1 North America
- 1.2.2 Europe
- 1.2.3 Asoa Pacific
- 1.2.4 Latin America
- 1.2.5 Middle Easr & Africa
- 1.3 Forecast parameters
- 1.4 Data Validation
- 1.5 Data sources
- 1.5.1 Secondary
- 1.5.1.1 Paid sources
- 1.5.1.2 Public sources
- 1.5.2 Primary
- 1.5.1 Secondary
Chapter 2 Executive Summary
- 2.1 Augmented and virtual reality in healthcare industry 360 degree synopsis, 2018 - 2032
- 2.1.1 Business trends
- 2.1.2 Technology trends
- 2.1.3 Component trends
- 2.1.4 Application trends
- 2.1.5 End-use trends
- 2.1.6 Regional trends
Chapter 3 Augmented and Virtual Reality in Healthcare Industry Insights
- 3.1 Industry segmentation
- 3.2 Industry landscape, 2018 - 2032
- 3.3 Industry impact forces
- 3.3.1 Growth drivers
- 3.3.1.1 Technological advancements
- 3.3.1.2 Increasing investment in healthcare AR/VR
- 3.3.1.3 Increasing research & development activities targeting various applications
- 3.3.1.4 Rising implementation of telehealth platform integrated with AR/VR technologies
- 3.3.2 Industry pitfalls & challenges
- 3.3.2.1 Initial costs associated with the development of healthcare AR/VR technologies
- 3.3.2.2 Regulatory implications
- 3.3.1 Growth drivers
- 3.4 Growth potential analysis
- 3.4.1 By technology
- 3.4.2 By component
- 3.4.3 By application
- 3.4.4 By end-use
- 3.5 COVID-19 impact analysis
- 3.6 Value chain analysis
- 3.7 Technology roadmap
- 3.8 Product lifecycle analysis
- 3.9 Porter's analysis
- 3.9.1 Bargaining power of suppliers
- 3.9.2 Bargaining power of buyers
- 3.9.3 Threat of new entrants
- 3.9.4 Threat of substitutes
- 3.9.5 Industry rivalry
- 3.10 PESTEL analysis
- 3.10.1 Political
- 3.10.2 Economical
- 3.10.3 Social
- 3.10.4 Technological
- 3.10.5 Environmental
- 3.10.6 Legal
Chapter 4 Competitive Landscape, 2022
- 4.1 Introduction
- 4.2 Company matrix analysis, 2022
- 4.3 Strategy dashboard, 2022
Chapter 5 Augmented and Virtual Reality in Healthcare Market, By Technology
- 5.1 Key segment trends
- 5.2 Augmented reality
- 5.2.1 Market size, by region, 2018 - 2032 (USD Million)
- 5.3 Virtual reality
- 5.3.1 Market size ,by region, 2018 - 2032 (USD Million)
Chapter 6 Augmented and Virtual Reality in Healthcare Market, By Component
- 6.1 Key segment trends
- 6.2 Hardware
- 6.2.1 Market size, by region, 2018 - 2032 USD Milion)
- 6.3 Software
- 6.3.1 Market size, by region, 2018 - 2032 (USD Milion)
- 6.4 Services
- 6.4.1 Market size, by region, 2018 - 2032 (USD Milion)
Chapter 7 Augmented and Virtual Reality in Healthcare Market, By Application
- 7.1 Key segment trends
- 7.2 Surgery
- 7.2.1 Market size, by region, 2018 - 2032 (USD Milion)
- 7.3 Training & education
- 7.3.1 Market size, by region, 2018 - 2032 (USD Milion)
- 7.4 Behavioural therapy
- 7.4.1 Market size, by region, 2018 - 2032 (USD Milion)
- 7.5 Medical imaging
- 7.5.1 Market size, by region, 2018 - 2032 (USD Milion)
- 7.6 Others
- 7.6.1 Market size, by region, 2018 - 2032 (USD Milion)
Chapter 8 Augmented and Virtual Reality in Healthcare Market, By End-use
- 8.1 Key segment trends
- 8.2 Academic institutions
- 8.2.1 Market size, by region, 2018 - 2032 (USD Milion)
- 8.3 Hospitals
- 8.3.1 Market size, by region, 2018 - 2032 (USD Milion)
- 8.4 Clinics / Dentist
- 8.4.1 Market size, by region, 2018 - 2032 (USD Milion)
- 8.5 Others
- 8.5.1 Market size, by region, 2018 - 2032 (USD Milion)
Chapter 9 Augmented and Virtual Reality in Healthcare Market, By Region
- 9.1 Key regional trends
- 9.2 North America
- 9.2.1 Market size, by country, 2018 - 2032 (USD Milion)
- 9.2.2 Market size, by technology, 2018 - 2032 (USD Milion)
- 9.2.3 Market size, by component, 2018 - 2032 (USD Million)
- 9.2.4 Market size, by application, 2018 - 2032 (USD Milion)
- 9.2.5 Market size, by end-use, 2018 - 2032 (USD Milion)
- 9.2.6 U.S.
- 9.2.6.1 Market size, by technology, 2018 - 2032 (USD Milion)
- 9.2.6.2 Market size, by component, 2018 - 2032 (USD Million)
- 9.2.6.3 Market size, by application, 2018 - 2032 (USD Milion)
- 9.2.6.4 Market size, by end-use, 2018 - 2032 (USD Milion)
- 9.2.7 Canada
- 9.2.7.1 Market size, by technology, 2018 - 2032 (USD Milion)
- 9.2.7.2 Market size, by component, 2018 - 2032 (USD Million)
- 9.2.7.3 Market size, by application, 2018 - 2032 (USD Milion)
- 9.2.7.4 Market size, by end-use, 2018 - 2032 (USD Milion)
- 9.3 Europe
- 9.3.1 Market size, by country, 2018 - 2032 (USD Milion)
- 9.3.2 Market size, by technology, 2018 - 2032 (USD Milion)
- 9.3.3 Market size, by component, 2018 - 2032 (USD Million)
- 9.3.4 Market size, by application, 2018 - 2032 (USD Milion)
- 9.3.5 Market size, by end-use, 2018 - 2032 (USD Milion)
- 9.3.6 Germany
- 9.3.6.1 Market size, by technology, 2018 - 2032 (USD Milion)
- 9.3.6.2 Market size, by component, 2018 - 2032 (USD Million)
- 9.3.6.3 Market size, by application, 2018 - 2032 (USD Milion)
- 9.3.6.4 Market size, by end-use, 2018 - 2032 (USD Milion)
- 9.3.7 UK
- 9.3.7.1 Market size, by technology, 2018 - 2032 (USD Milion)
- 9.3.7.2 Market size, by component, 2018 - 2032 (USD Million)
- 9.3.7.3 Market size, by application, 2018 - 2032 (USD Milion)
- 9.3.7.4 Market size, by end-use, 2018 - 2032 (USD Milion)
- 9.3.8 France
- 9.3.8.1 Market size, by technology, 2018 - 2032 (USD Milion)
- 9.3.8.2 Market size, by component, 2018 - 2032 (USD Million)
- 9.3.8.3 Market size, by application, 2018 - 2032 (USD Milion)
- 9.3.8.4 Market size, by end-use, 2018 - 2032 (USD Milion)
- 9.3.9 Spain
- 9.3.9.1 Market size, by technology, 2018 - 2032 (USD Milion)
- 9.3.9.2 Market size, by component, 2018 - 2032 (USD Million)
- 9.3.9.3 Market size, by application, 2018 - 2032 (USD Milion)
- 9.3.9.4 Market size, by end-use, 2018 - 2032 (USD Milion)
- 9.3.10 Italy
- 9.3.10.1 Market size, by technology, 2018 - 2032 (USD Milion)
- 9.3.10.2 Market size, by component, 2018 - 2032 (USD Million)
- 9.3.10.3 Market size, by application, 2018 - 2032 (USD Milion)
- 9.3.10.4 Market size, by end-use, 2018 - 2032 (USD Milion)
- 9.4 Asia Pacific
- 9.4.1 Market size, by country, 2018 - 2032 (USD Milion)
- 9.4.2 Market size, by technology, 2018 - 2032 (USD Milion)
- 9.4.3 Market size, by component, 2018 - 2032 (USD Million)
- 9.4.4 Market size, by application, 2018 - 2032 (USD Milion)
- 9.4.5 Market size, by end-use, 2018 - 2032 (USD Milion)
- 9.4.6 China
- 9.4.6.1 Market size, by technology, 2018 - 2032 (USD Milion)
- 9.4.6.2 Market size, by component, 2018 - 2032 (USD Million)
- 9.4.6.3 Market size, by application, 2018 - 2032 (USD Milion)
- 9.4.6.4 Market size, by end-use, 2018 - 2032 (USD Milion)
- 9.4.7 Japan
- 9.4.7.1 Market size, by technology, 2018 - 2032 (USD Milion)
- 9.4.7.2 Market size, by component, 2018 - 2032 (USD Million)
- 9.4.7.3 Market size, by application, 2018 - 2032 (USD Milion)
- 9.4.7.4 Market size, by end-use, 2018 - 2032 (USD Milion)
- 9.4.8 India
- 9.4.8.1 Market size, by technology, 2018 - 2032 (USD Milion)
- 9.4.8.2 Market size, by component, 2018 - 2032 (USD Million)
- 9.4.8.3 Market size, by application, 2018 - 2032 (USD Milion)
- 9.4.8.4 Market size, by end-use, 2018 - 2032 (USD Milion)
- 9.4.9 Australia
- 9.4.9.1 Market size, by technology, 2018 - 2032 (USD Milion)
- 9.4.9.2 Market size, by component, 2018 - 2032 (USD Million)
- 9.4.9.3 Market size, by application, 2018 - 2032 (USD Milion)
- 9.4.9.4 Market size, by end-use, 2018 - 2032 (USD Milion)
- 9.5 Latin America
- 9.5.1 Market size, by country, 2018 - 2032 (USD Milion)
- 9.5.2 Market size, by technology, 2018 - 2032 (USD Milion)
- 9.5.3 Market size, by component, 2018 - 2032 (USD Million)
- 9.5.4 Market size, by application, 2018 - 2032 (USD Milion)
- 9.5.5 Market size, by end-use, 2018 - 2032 (USD Milion)
- 9.5.6 Brazil
- 9.5.6.1 Market size, by technology, 2018 - 2032 (USD Milion)
- 9.5.6.2 Market size, by component, 2018 - 2032 (USD Million)
- 9.5.6.3 Market size, by application, 2018 - 2032 (USD Milion)
- 9.5.6.4 Market size, by end-use, 2018 - 2032 (USD Milion)
- 9.5.7 Mexico
- 9.5.7.1 Market size, by technology, 2018 - 2032 (USD Milion)
- 9.5.7.2 Market size, by component, 2018 - 2032 (USD Million)
- 9.5.7.3 Market size, by application, 2018 - 2032 (USD Milion)
- 9.5.7.4 Market size, by end-use, 2018 - 2032 (USD Milion)
- 9.6 MEA
- 9.6.1 Market size, by country, 2018 - 2032 (USD Milion)
- 9.6.2 Market size, by technology, 2018 - 2032 (USD Milion)
- 9.6.3 Market size, by component, 2018 - 2032 (USD Million)
- 9.6.4 Market size, by application, 2018 - 2032 (USD Milion)
- 9.6.5 Market size, by end-use, 2018 - 2032 (USD Milion)
- 9.6.6 South Africa
- 9.6.6.1 Market size, by technology, 2018 - 2032 (USD Milion)
- 9.6.6.2 Market size, by component, 2018 - 2032 (USD Million)
- 9.6.6.3 Market size, by application, 2018 - 2032 (USD Milion)
- 9.6.6.4 Market size, by end-use, 2018 - 2032 (USD Milion)
Chapter 10 Company Profiles
- 10.1 Augmedics
- 10.1.1 Business overview
- 10.1.2 Financial data
- 10.1.3 Product landscape
- 10.1.4 Strategic outlook
- 10.1.5 SWOT analysis
- 10.2 Augmedix, Inc.
- 10.2.1 Business overview
- 10.2.2 Financial data
- 10.2.3 Product landscape
- 10.2.4 Strategic outlook
- 10.2.5 SWOT analysis
- 10.3 FundamentalVR
- 10.3.1 Business overview
- 10.3.2 Financial data
- 10.3.3 Product landscape
- 10.3.4 Strategic outlook
- 10.3.5 SWOT analysis
- 10.4 Hologic Inc.
- 10.4.1 Business overview
- 10.4.2 Financial data
- 10.4.3 Product landscape
- 10.4.4 Strategic outlook
- 10.4.5 SWOT analysis
- 10.5 Intuitive Surgical, Inc.
- 10.5.1 Business overview
- 10.5.2 Financial data
- 10.5.3 Product landscape
- 10.5.4 Strategic outlook
- 10.5.5 SWOT analysis
- 10.6 Karuna Labs Inc.
- 10.6.1 Business overview
- 10.6.2 Financial data
- 10.6.3 Product landscape
- 10.6.4 Strategic outlook
- 10.6.5 SWOT analysis
- 10.7 Medical Augmented Intelligence (MAI)
- 10.7.1 Business overview
- 10.7.2 Financial data
- 10.7.3 Product landscape
- 10.7.4 Strategic outlook
- 10.7.5 SWOT analysis
- 10.8 MindMaze
- 10.8.1 Business overview
- 10.8.2 Financial data
- 10.8.3 Product landscape
- 10.8.4 Strategic outlook
- 10.8.5 SWOT analysis
- 10.9 Amelia Virtual Care
- 10.9.1 Business overview
- 10.9.2 Financial data
- 10.9.3 Product landscape
- 10.9.4 Strategic outlook
- 10.9.5 SWOT analysis
- 10.10 Surgical Theater, Inc
- 10.10.1 Business overview
- 10.10.2 Financial data
- 10.10.3 Product landscape
- 10.10.4 Strategic outlook
- 10.10.5 SWOT analysis