|
|
市場調査レポート
商品コード
1175970
ワイヤレス充電の世界市場 (2023年~2032年):市場規模 (技術・用途別)・地域的展望・成長の潜在性・競合シェア・予測Wireless Charging Market Size By Technology, By Application, Regional Outlook, Growth Potential, Competitive Market Share & Forecast, 2023 - 2032 |
||||||
|
|
|||||||
|
● お客様のご希望に応じて、既存データの加工や未掲載情報(例:国別セグメント)の追加などの対応が可能です。 詳細はお問い合わせください。 |
|||||||


| ワイヤレス充電の世界市場 (2023年~2032年):市場規模 (技術・用途別)・地域的展望・成長の潜在性・競合シェア・予測 |
|
出版日: 2022年12月01日
発行: Global Market Insights Inc.
ページ情報: 英文 220 Pages
納期: 2~3営業日
|
- 全表示
- 概要
- 図表
- 目次
世界のワイヤレス充電の市場は、スマートウォッチやフィットネストラッカーなどのウェアラブルデバイスの人気上昇により、2032年にかけて着実に成長すると予想されています。
また、自動運転車や電気自動車の普及が世界的に進んでいることから、ワイヤレス充電ソリューションの需要が高まっており、このような動向も今後数年の産業の見通しを強化すると予想されています。
技術別で見ると、共振型の部門が2032年には30%を超えるシェアを得る見通しです。また、用途別では、CE製品部門が予測期間中に大幅に成長すると予想されています。スマートウェアラブル、スマートフォン、フィットネストラッカー、聴覚デバイスなどの世界的な普及が同部門でのワイヤレス充電技術ソリューションの需要を高める主な要因となっています。
当レポートでは、世界のワイヤレス充電の市場を調査し、市場概要、市場成長への各種影響因子の分析、法規制環境、技術・イノベーションの情勢、特許動向、市場規模の推移・予測、各種区分・地域/主要国別の内訳、競合環境、主要企業のプロファイルなどをまとめています。
目次
第1章 調査手法・調査範囲
第2章 エグゼクティブサマリー
第3章 ワイヤレス充電産業の考察
- 産業の分類
- COVID-19の影響
- ロシア・ウクライナ紛争の影響
- 産業エコシステム分析
- 技術・イノベーションの情勢
- 規制状況
- 産業への影響要因
- 促進要因
- 潜在的リスク&課題
- 主なイニシアチブとニュース
- 価格動向分析
- 特許分析
- 投資ポートフォリオ
- 成長性分析
- ポーターの分析
- PESTEL分析
第4章 競合情勢
- 企業の市場シェア
- 主要企業の競合分析
- 他の有力企業の競合分析
- ベンダー採用マトリックス
- 戦略的展望マトリックス
第5章 ワイヤレス充電市場:技術別
- 市場シェア:2022年・2032年
- コンダクティブ
- 共振
- RF
- その他
第6章 ワイヤレス充電市場:用途別
- 市場シェア:2022年・2032年
- 航空宇宙・防衛
- 自動車
- CE製品
- ヘルスケア
- 産業
第7章 ワイヤレス充電市場:地域別
- 市場シェア:2022年・2032年
- 北米
- 欧州
- アジア太平洋
- ラテンアメリカ
- 中東・アフリカ
第8章 企業プロファイル
- Convenient Power Ltd.
- Energizer Holdings Inc.
- Evatran LLC(Plugless Power)
- Infineon Technologies
- Leggett & Platt Inc.
- Mediatek Inc.
- Mojo Mobility Inc.
- Murata Manufacturing Co. Ltd.
- OSSIA
- Powercast Corporation
- Powermat Technologies
- Qualcomm Incorporated
- Renesas Electronics
- Samsung Electronics Co. Ltd.
- Semtech Corporation
- Texas Instruments Inc.
- Thales Group
- WiBotic
- Wiferion Gmbh
- Witricity Corporation
Data Tables
- TABLE 1 Wireless charging industry 360 degree synopsis, 2018 - 2032
- TABLE 2 Wireless charging market size, 2018 - 2022 (USD Million)
- TABLE 3 Wireless charging market size, 2023 - 2032 (USD Million)
- TABLE 4 Wireless charging market size, by region, 2018 - 2022 (USD Million)
- TABLE 5 Wireless charging market size, by region, 2023 - 2032 (USD Million)
- TABLE 6 Wireless charging market size, by technology, 2018 - 2022 (USD Million)
- TABLE 7 Wireless charging market size, by technology, 2023 - 2032 (USD Million)
- TABLE 8 Wireless charging market size, by application, 2018 - 2022 (USD Million)
- TABLE 9 Wireless charging market size, by application, 2023 - 2032 (USD Million)
- TABLE 10 Vendor matrix
- TABLE 11 Impact forces
- TABLE 12 Inductive wireless charging market size, 2018 - 2022 (USD Million)
- TABLE 13 Inductive wireless charging market size, 2023 - 2032 (USD Million)
- TABLE 14 RF wireless charging market size, 2018 - 2022 (USD Million)
- TABLE 15 RF wireless charging market size, 2023 - 2032 (USD Million)
- TABLE 16 Resonant wireless charging market size, 2018 - 2022 (USD Million)
- TABLE 17 Resonant wireless charging market size, 2023 - 2032 (USD Million)
- TABLE 18 Other wireless charging technologies market size, 2018 - 2022 (USD Million)
- TABLE 19 Other wireless charging technologies market size, 2023 - 2032 (USD Million)
- TABLE 20 Aerospace & defense wireless charging market, 2018 - 2022 (USD Million)
- TABLE 21 Aerospace & defense wireless charging market, 2023 - 2032 (USD Million)
- TABLE 22 Automotive wireless charging market, 2018 - 2022 (USD Million)
- TABLE 23 Automotive wireless charging market, 2023 - 2032 (USD Million)
- TABLE 24 Healthcare wireless charging market, 2018 - 2022 (USD Million)
- TABLE 25 Healthcare wireless charging market, 2023 - 2032 (USD Million)
- TABLE 26 Consumer electronics wireless charging market, 2018 - 2022 (USD Million)
- TABLE 27 Consumer electronics wireless charging market, 2023 - 2032 (USD Million)
- TABLE 28 Industrial wireless charging market, 2018 - 2022 (USD Million)
- TABLE 29 Industrial wireless charging market, 2023 - 2032 (USD Million)
- TABLE 30 North America wireless charging market size, 2018 - 2022 (USD Million)
- TABLE 31 North America wireless charging market size, 2023 - 2032 (USD Million)
- TABLE 32 North America wireless charging market size, by technology, 2018 - 2022 (USD Million)
- TABLE 33 North America wireless charging market size, by technology, 2023 - 2032 (USD Million)
- TABLE 34 North America wireless charging market size, by application, 2018 - 2022 (USD Million)
- TABLE 35 North America wireless charging market size, by application, 2023 - 2032 (USD Million)
- TABLE 36 U.S. wireless charging market size, 2018 - 2022 (USD Million)
- TABLE 37 U.S. wireless charging market size, 2023 - 2032 (USD Million)
- TABLE 38 U.S. wireless charging market size, by technology, 2018 - 2022 (USD Million)
- TABLE 39 U.S. wireless charging market size, by technology, 2023 - 2032 (USD Million)
- TABLE 40 U.S. wireless charging market size, by application, 2018 - 2022 (USD Million)
- TABLE 41 U.S. wireless charging market size, by application, 2023 - 2032 (USD Million)
- TABLE 42 Canada wireless charging market size, 2018 - 2022 (USD Million)
- TABLE 43 Canada wireless charging market size, 2023 - 2032 (USD Million)
- TABLE 44 Canada wireless charging market size, by technology, 2018 - 2022 (USD Million)
- TABLE 45 Canada wireless charging market size, by technology, 2023 - 2032 (USD Million)
- TABLE 46 Canada wireless charging market size, by application, 2018 - 2022 (USD Million)
- TABLE 47 Canada wireless charging market size, by application, 2023 - 2032 (USD Million)
- TABLE 48 Europe wireless charging market size, 2018 - 2022 (USD Million)
- TABLE 49 Europe wireless charging market size, 2023 - 2032 (USD Million)
- TABLE 50 Europe wireless charging market size, by technology, 2018 - 2022 (USD Million)
- TABLE 51 Europe wireless charging market size, by technology, 2023 - 2032 (USD Million)
- TABLE 52 Europe wireless charging market size, by application, 2018 - 2022 (USD Million)
- TABLE 53 Europe wireless charging market size, by application, 2023 - 2032 (USD Million)
- TABLE 54 UK wireless charging market size, 2018 - 2022 (USD Million)
- TABLE 55 UK wireless charging market size, 2023 - 2032 (USD Million)
- TABLE 56 UK wireless charging market size, by technology, 2018 - 2022 (USD Million)
- TABLE 57 UK wireless charging market size, by technology, 2023 - 2032 (USD Million)
- TABLE 58 UK wireless charging market size, by application, 2018 - 2022 (USD Million)
- TABLE 59 UK wireless charging market size, by application, 2023 - 2032 (USD Million)
- TABLE 60 Germany wireless charging market size, 2018 - 2022 (USD Million)
- TABLE 61 Germany wireless charging market size, 2023 - 2032 (USD Million)
- TABLE 62 Germany wireless charging market size, by technology, 2018 - 2022 (USD Million)
- TABLE 63 Germany wireless charging market size, by technology, 2023 - 2032 (USD Million)
- TABLE 64 Germany wireless charging market size, by application, 2018 - 2022 (USD Million)
- TABLE 65 Germany wireless charging market size, by application, 2023 - 2032 (USD Million)
- TABLE 66 France wireless charging market size, 2018 - 2022 (USD Million)
- TABLE 67 France wireless charging market size, 2023 - 2032 (USD Million)
- TABLE 68 France wireless charging market size, by technology, 2018 - 2022 (USD Million)
- TABLE 69 France wireless charging market size, by technology, 2023 - 2032 (USD Million)
- TABLE 70 France wireless charging market size, by application, 2018 - 2022 (USD Million)
- TABLE 71 France wireless charging market size, by application, 2023 - 2032 (USD Million)
- TABLE 72 Italy wireless charging market size, 2018 - 2022 (USD Million)
- TABLE 73 Italy wireless charging market size, 2023 - 2032 (USD Million)
- TABLE 74 Italy wireless charging market size, by technology, 2018 - 2022 (USD Million)
- TABLE 75 Italy wireless charging market size, by technology, 2023 - 2032 (USD Million)
- TABLE 76 Italy wireless charging market size, by application, 2018 - 2022 (USD Million)
- TABLE 77 Italy wireless charging market size, by application, 2023 - 2032 (USD Million)
- TABLE 78 Spain wireless charging market size, 2018 - 2022 (USD Million)
- TABLE 79 Spain wireless charging market size, 2023 - 2032 (USD Million)
- TABLE 80 Spain wireless charging market size, by technology, 2018 - 2022 (USD Million)
- TABLE 81 Spain wireless charging market size, by technology, 2023 - 2032 (USD Million)
- TABLE 82 Spain wireless charging market size, by application, 2018 - 2022 (USD Million)
- TABLE 83 Spain wireless charging market size, by application, 2023 - 2032 (USD Million)
- TABLE 84 Russia wireless charging market size, 2018 - 2022 (USD Million)
- TABLE 85 Russia wireless charging market size, 2023 - 2032 (USD Million)
- TABLE 86 Russia wireless charging market size, by technology, 2018 - 2022 (USD Million)
- TABLE 87 Russia wireless charging market size, by technology, 2023 - 2032 (USD Million)
- TABLE 88 Russia wireless charging market size, by application, 2018 - 2022 (USD Million)
- TABLE 89 Russia wireless charging market size, by application, 2023 - 2032 (USD Million)
- TABLE 90 Asia Pacific wireless charging market size, 2018 - 2022 (USD Million)
- TABLE 91 Asia Pacific wireless charging market size, 2023 - 2032 (USD Million)
- TABLE 92 Asia Pacific wireless charging market size, by technology, 2018 - 2022 (USD Million)
- TABLE 93 Asia Pacific wireless charging market size, by technology, 2023 - 2032 (USD Million)
- TABLE 94 Asia Pacific wireless charging market size, by application, 2018 - 2022 (USD Million)
- TABLE 95 Asia Pacific wireless charging market size, by application, 2023 - 2032 (USD Million)
- TABLE 96 China wireless charging market size, 2018 - 2022 (USD Million)
- TABLE 97 China wireless charging market size, 2023 - 2032 (USD Million)
- TABLE 98 China wireless charging market size, by technology, 2018 - 2022 (USD Million)
- TABLE 99 China wireless charging market size, by technology, 2023 - 2032 (USD Million)
- TABLE 100 China wireless charging market size, by application, 2018 - 2022 (USD Million)
- TABLE 101 China wireless charging market size, by application, 2023 - 2032 (USD Million)
- TABLE 102 India wireless charging market size, 2018 - 2022 (USD Million)
- TABLE 103 India wireless charging market size, 2023 - 2032 (USD Million)
- TABLE 104 India wireless charging market size, by technology, 2018 - 2022 (USD Million)
- TABLE 105 India wireless charging market size, by technology, 2023 - 2032 (USD Million)
- TABLE 106 India wireless charging market size, by application, 2018 - 2022 (USD Million)
- TABLE 107 India wireless charging market size, by application, 2023 - 2032 (USD Million)
- TABLE 108 Japan wireless charging market size, 2018 - 2022 (USD Million)
- TABLE 109 Japan wireless charging market size, 2023 - 2032 (USD Million)
- TABLE 110 Japan wireless charging market size, by technology, 2018 - 2022 (USD Million)
- TABLE 111 Japan wireless charging market size, by technology, 2023 - 2032 (USD Million)
- TABLE 112 Japan wireless charging market size, by application, 2018 - 2022 (USD Million)
- TABLE 113 Japan wireless charging market size, by application, 2023 - 2032 (USD Million)
- TABLE 114 South Korea wireless charging market size, 2018 - 2022 (USD Million)
- TABLE 115 South Korea wireless charging market size, 2023 - 2032 (USD Million)
- TABLE 116 South Korea wireless charging market size, by technology, 2018 - 2022 (USD Million)
- TABLE 117 South Korea wireless charging market size, by technology, 2023 - 2032 (USD Million)
- TABLE 118 South Korea wireless charging market size, by application, 2018 - 2022 (USD Million)
- TABLE 119 South Korea wireless charging market size, by application, 2023 - 2032 (USD Million)
- TABLE 120 Australia wireless charging market size, 2018 - 2022 (USD Million)
- TABLE 121 Australia wireless charging market size, 2023 - 2032 (USD Million)
- TABLE 122 Australia wireless charging market size, by technology, 2018 - 2022 (USD Million)
- TABLE 123 Australia wireless charging market size, by technology, 2023 - 2032 (USD Million)
- TABLE 124 Australia wireless charging market size, by application, 2018 - 2022 (USD Million)
- TABLE 125 Australia wireless charging market size, by application, 2023 - 2032 (USD Million)
- TABLE 126 Latin America wireless charging market size, 2018 - 2022 (USD Million)
- TABLE 127 Latin America wireless charging market size, 2023 - 2032 (USD Million)
- TABLE 128 Latin America wireless charging market size, by technology, 2018 - 2022 (USD Million)
- TABLE 129 Latin America wireless charging market size, by technology, 2023 - 2032 (USD Million)
- TABLE 130 Latin America wireless charging market size, by application, 2018 - 2022 (USD Million)
- TABLE 131 Latin America wireless charging market size, by application, 2023 - 2032 (USD Million)
- TABLE 132 Brazil wireless charging market size, 2018 - 2022 (USD Million)
- TABLE 133 Brazil wireless charging market size, 2023 - 2032 (USD Million)
- TABLE 134 Brazil wireless charging market size, by technology, 2018 - 2022 (USD Million)
- TABLE 135 Brazil wireless charging market size, by technology, 2023 - 2032 (USD Million)
- TABLE 136 Brazil wireless charging market size, by application, 2018 - 2022 (USD Million)
- TABLE 137 Brazil wireless charging market size, by application, 2023 - 2032 (USD Million)
- TABLE 138 Mexico wireless charging market size, 2018 - 2022 (USD Million)
- TABLE 139 Mexico wireless charging market size, 2023 - 2032 (USD Million)
- TABLE 140 Mexico wireless charging market size, by technology, 2018 - 2022 (USD Million)
- TABLE 141 Mexico wireless charging market size, by technology, 2023 - 2032 (USD Million)
- TABLE 142 Mexico wireless charging market size, by application, 2018 - 2022 (USD Million)
- TABLE 143 Mexico wireless charging market size, by application, 2023 - 2032 (USD Million)
- TABLE 144 MEA wireless charging market size, 2018 - 2022 (USD Million)
- TABLE 145 MEA wireless charging market size, 2023 - 2032 (USD Million)
- TABLE 146 MEA wireless charging market size, by technology, 2018 - 2022 (USD Million)
- TABLE 147 MEA wireless charging market size, by technology, 2023 - 2032 (USD Million)
- TABLE 148 MEA wireless charging market size, by application, 2018 - 2022 (USD Million)
- TABLE 149 MEA wireless charging market size, by application, 2023 - 2032 (USD Million)
- TABLE 150 UAE wireless charging market size, 2018 - 2022 (USD Million)
- TABLE 151 UAE wireless charging market size, 2023 - 2032 (USD Million)
- TABLE 152 UAE wireless charging market size, by technology, 2018 - 2022 (USD Million)
- TABLE 153 UAE wireless charging market size, by technology, 2023 - 2032 (USD Million)
- TABLE 154 UAE wireless charging market size, by application, 2018 - 2022 (USD Million)
- TABLE 155 UAE wireless charging market size, by application, 2023 - 2032 (USD Million)
- TABLE 156 Saudi Arabia wireless charging market size, 2018 - 2022 (USD Million)
- TABLE 157 Saudi Arabia wireless charging market size, 2023 - 2032 (USD Million)
- TABLE 158 Saudi Arabia wireless charging market size, by technology, 2018 - 2022 (USD Million)
- TABLE 159 Saudi Arabia wireless charging market size, by technology, 2023 - 2032 (USD Million)
- TABLE 160 Saudi Arabia wireless charging market size, by application, 2018 - 2022 (USD Million)
- TABLE 161 Saudi Arabia wireless charging market size, by application, 2023 - 2032 (USD Million)
- TABLE 162 South Africa wireless charging market size, 2018 - 2022 (USD Million)
- TABLE 163 South Africa wireless charging market size, 2023 - 2032 (USD Million)
- TABLE 164 South Africa wireless charging market size, by technology, 2018 - 2022 (USD Million)
- TABLE 165 South Africa wireless charging market size, by technology, 2023 - 2032 (USD Million)
- TABLE 166 South Africa wireless charging market size, by application, 2018 - 2022 (USD Million)
- TABLE 167 South Africa wireless charging market size, by application, 2023 - 2032 (USD Million)
Charts & Figures
- FIG 1 Wireless charging industry 36 degree synopsis, 2018- 2032
- FIG 2 Industry ecosystem analysis
- FIG 3 Growth potential analysis
- FIG 4 Porter's analysis
- FIG 5 PESTEL analysis
- FIG 6 Company market share, 2022
- FIG 7 Competitive analysis of major players, 2022
- FIG 8 Competitive analysis of other prominent players, 2022
- FIG 9 Vendor adoption matrix
- FIG 10 Strategic outlook matrix
- FIG 11 SWOT analysis, Convenient Power Ltd.
- FIG 12 SWOT Analysis, Energizer Holdings Inc.
- FIG 13 SWOT Analysis, Evatran LLC
- FIG 14 SWOT Analysis, Infineon Technologies AG
- FIG 15 SWOT Analysis, Leggett & Platt Inc.
- FIG 16 SWOT Analysis, Mediatek Inc.
- FIG 17 SWOT Analysis, Mojo Mobility Inc.
- FIG 18 SWOT Analysis, Murata Manufacturing Co. Ltd.
- FIG 19 SWOT Analysis, OSSIA
- FIG 20 SWOT Analysis, Powercast Corporation
- FIG 21 SWOT Analysis, Powermat Technologies
- FIG 22 SWOT Analysis, Qualcomm Incorporated
- FIG 23 SWOT Analysis, Renesas Electronics
- FIG 24 SWOT Analysis, Samsung Electronics Co. Ltd.
- FIG 25 SWOT Analysis, Semtech Corporation
- FIG 26 SWOT Analysis, Texas Instruments Inc.
- FIG 27 SWOT Analysis, Thales Group
- FIG 28 SWOT Analysis, WiBotic
- FIG 29 SWOT Analysis, Wiferion GmbH
- FIG 30 SWOT Analysis, WiTricity Corporation
Global Wireless Charging Market is speculated to grow steadily through 2032 owing to the surging popularity of wearable devices such as smartwatches and fitness trackers. Moreover, increasing proliferation of autonomous and electric vehicles worldwide is projected to support the demand for wireless charging solutions, thus seamlessly supporting the owners to charge their vehicles. Such trends are forecast to augment the industry outlook in the coming years.
Heightened adoption for wireless charging solutions amongst various business conglomerates would compel market participants to introduce unique solutions. Moreover, businesses are also investing in deploying charging solutions that allow drivers to charge their cars while on the highways. Industry leaders are also concentrating on ramping up their R&D operations and global footprint to expand their product portfolios and secure a competitive edge in the market.
For instance, in May 2022, Powermat Technologies launched the Powermat PMT 100 Wireless Power System, to fulfill the needs of small IoT (internet of things) devices for lifestyle, smart homes, and medical applications. The product offers a higher degree of performance and a seamless charging experience.
The wireless charging market has been divided in terms of technology, application, and region.
Based on technology, the resonant segment is slated to attain more than 30% market share by 2032. The resonant technology is expected to unfold as the most valuable innovation in the sector as it helps in charging devices throughout mid-range distances, thus maximizing the comfort for end users. The technology enables multiple devices to be charged simultaneously of differing power and sizes, which will help bolster market growth.
With respect to application, the consumer electronics segment is expected to expand considerably through the forecast period. The global adoption of smart wearables, smartphones, fitness trackers, as well as hearing devices is a major factor driving the demand for wireless charging technology solutions across the consumer electronics industry. Manufacturers in the sector are introducing highly technological wireless chargers that enable charging multiple devices from a single network while using 90% less power.
From the regional perspective, the Middle East & Africa wireless charging market was valued at more than USD 2.5 billion in 2022. The MEA region is likely to expand significantly as airports and airlines in the region have installed multiple charging stations in lounges as well as onboard seats. Furthermore, the GCC-based airlines have been using the charging facilities to improve the traveler experience on both long-haul and short-haul flights. Such advantages are anticipated to foster the regional growth in the ensuing years.
Table of Contents
Chapter 1 Methodology & Scope
- 1.1 Market definition
- 1.2 Base estimates & forecast
- 1.3 Forecast calculations
- 1.4 Data Sources
- 1.4.1 Secondary
- 1.4.2 Primary
- 1.5 Industry glossary
Chapter 2 Executive Summary
- 2.1 Wireless charging industry 360 degree synopsis, 2018 - 2032
- 2.1.1 Business trends
- 2.1.1.1 Total Adressable Market (TAM), 2023-2032
- 2.1.2 Regional trends
- 2.1.3 Technology trends
- 2.1.4 Application trends
- 2.1.1 Business trends
Chapter 3 Wireless Charging Industry Insights
- 3.1 Industry segmentation
- 3.2 Impact of COVID-19 outbreak
- 3.2.1 North America
- 3.2.2 Europe
- 3.2.3 Asia Pacific
- 3.2.4 Latin America
- 3.2.5 MEA
- 3.3 Impact of Russia-Ukraine conflict
- 3.4 Industry ecosystem analysis
- 3.4.1 Raw material providers
- 3.4.2 Component suppliers
- 3.4.3 Manufacturers
- 3.4.4 Technology providers
- 3.4.5 Service providers
- 3.4.6 Distributors
- 3.4.7 Profit margin analysis
- 3.4.8 Vendor matrix
- 3.5 Technology & innovation landscape
- 3.5.1 Autonomous vehicles and Electric Vehicles (EV)
- 3.5.2 Impact of IoT and Industry 4.0
- 3.5.3 Wireless charging architecture
- 3.6 Regulatory landscape
- 3.6.1 North America
- 3.6.2 Europe
- 3.6.3 Asia Pacific
- 3.6.4 Latin America
- 3.6.5 MEA
- 3.7 Industry impact forces
- 3.7.1 Growth drivers
- 3.7.1.1 Technological innovations and penetration of IoT globally
- 3.7.1.2 Growing adoption of smartphones globally
- 3.7.1.3 Increasing awareness about physical fitness and wearable devices among the population in developing countries
- 3.7.1.4 Rising investment in auto-tech in North America and Europe
- 3.7.1.5 Supportive government initiatives in Asia Pacific
- 3.7.2 Industry pitfalls & challenges
- 3.7.2.1 High cost restricting the use in underdeveloped countries
- 3.7.2.2 Mobility issues and longer charging times
- 3.7.1 Growth drivers
- 3.8 Key initiative & news
- 3.9 Price trend analysis
- 3.10 Patent analysis
- 3.11 Investment portfolio
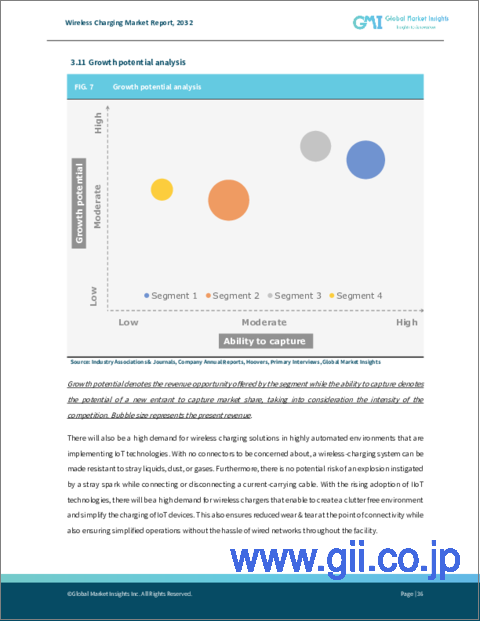
- 3.12 Growth potential analysis
- 3.13 Porter's analysis
- 3.13.1 Supplier power
- 3.13.2 Buyer power
- 3.13.3 Threat of new entrants
- 3.13.4 Threat of substitutes
- 3.13.5 Internal rivalry
- 3.14 PESTEL analysis
- 3.14.1 Political
- 3.14.2 Economic
- 3.14.3 Social
- 3.14.4 Technological
- 3.14.5 Environmental
- 3.14.6 Legal
Chapter 4 Competitive Landscape, 2022
- 4.1 Introduction
- 4.2 Company market share, 2022
- 4.3 Competitive analysis of major players
- 4.3.1 Energizer Holdings Inc.
- 4.3.2 Infineon Technologies
- 4.3.3 Mediatek Inc.
- 4.3.4 Qualcomm Technologies
- 4.3.5 Renesas Electronics
- 4.3.6 Samsung Electronics Co. Ltd.
- 4.3.7 Texas Instruments Inc.
- 4.4 Competitive analysis of other prominent players
- 4.4.1 Convenient Power Ltd.
- 4.4.2 Leggett & Platt Inc.
- 4.4.3 Murata Manufacturing Co.
- 4.4.4 Semtech Corporation
- 4.5 Vendor adoption matrix
- 4.6 Strategic outlook matrix
Chapter 5 Wireless Charging Market, By Technology
- 5.1 Wireless charging market share, 2022 & 2032, by technology
- 5.2 Inductive
- 5.2.1 Market estimates and forecast, 2018 - 2032
- 5.3 Resonant
- 5.3.1 Market estimates and forecast, 2018 - 2032
- 5.4 RF
- 5.4.1 Market estimates and forecast, 2018 - 2032
- 5.5 Others
- 5.5.1 Market estimates and forecast, 2018 - 2032
Chapter 6 Wireless Charging Market, By Application
- 6.1 Wireless charging market share, 2022 & 2032, by application
- 6.2 Aerospace & defense
- 6.2.1 Market estimates and forecast, 2018 - 2032
- 6.3 Automotive
- 6.3.1 Market estimates and forecast, 2018 - 2032
- 6.4 Consumer electronics
- 6.4.1 Market estimates and forecast, 2018 - 2032
- 6.5 Healthcare
- 6.5.1 Market estimates and forecast, 2018 - 2032
- 6.6 Industrial
- 6.6.1 Market estimates and forecast, 2018 - 2032
Chapter 7 Wireless Charging Market, By Region
- 7.1 Wireless charging market share, 2022 & 2032, by region
- 7.2 North America
- 7.2.1 Market estimates and forecast, 2018 - 2032
- 7.2.2 Market estimates and forecast, by technology, 2018 - 2032
- 7.2.3 Market estimates and forecast, by application, 2018 - 2032
- 7.2.4 U.S.
- 7.2.4.1 Market estimates and forecast, 2018 - 2032
- 7.2.4.2 Market estimates and forecast, by technology, 2018 - 2032
- 7.2.4.3 Market estimates and forecast, by application, 2018 - 2032
- 7.2.5 Canada
- 7.2.5.1 Market estimates and forecast, 2018 - 2032
- 7.2.5.2 Market estimates and forecast, by technology, 2018 - 2032
- 7.2.5.3 Market estimates and forecast, by application, 2018 - 2032
- 7.3 Europe
- 7.3.1 Market estimates and forecast, 2018 - 2032
- 7.3.2 Market estimates and forecast, by technology, 2018 - 2032
- 7.3.3 Market estimates and forecast, by application, 2018 - 2032
- 7.3.4 UK
- 7.3.4.1 Market estimates and forecast, 2018 - 2032
- 7.3.4.2 Market estimates and forecast, by technology, 2018 - 2032
- 7.3.4.3 Market estimates and forecast, by application, 2018 - 2032
- 7.3.5 Germany
- 7.3.5.1 Market estimates and forecast, 2018 - 2032
- 7.3.5.2 Market estimates and forecast, by technology, 2018 - 2032
- 7.3.5.3 Market estimates and forecast, by application, 2018 - 2032
- 7.3.6 France
- 7.3.6.1 Market estimates and forecast, 2018 - 2032
- 7.3.6.2 Market estimates and forecast, by technology, 2018 - 2032
- 7.3.6.3 Market estimates and forecast, by application, 2018 - 2032
- 7.3.7 Italy
- 7.3.7.1 Market estimates and forecast, 2018 - 2032
- 7.3.7.2 Market estimates and forecast, by technology, 2018 - 2032
- 7.3.7.3 Market estimates and forecast, by application, 2018 - 2032
- 7.3.8 Spain
- 7.3.8.1 Market estimates and forecast, 2018 - 2032
- 7.3.8.2 Market estimates and forecast, by technology, 2018 - 2032
- 7.3.8.3 Market estimates and forecast, by application, 2018 - 2032
- 7.3.9 Russia
- 7.3.9.1 Market estimates and forecast, 2018 - 2032
- 7.3.9.2 Market estimates and forecast, by technology, 2018 - 2032
- 7.3.9.3 Market estimates and forecast, by application, 2018 - 2032
- 7.4 Asia Pacific
- 7.4.1 Market estimates and forecast, 2018 - 2032
- 7.4.2 Market estimates and forecast, by technology, 2018 - 2032
- 7.4.3 Market estimates and forecast, by application, 2018 - 2032
- 7.4.4 China
- 7.4.4.1 Market estimates and forecast, 2018 - 2032
- 7.4.4.2 Market estimates and forecast, by technology, 2018 - 2032
- 7.4.4.3 Market estimates and forecast, by application, 2018 - 2032
- 7.4.5 India
- 7.4.5.1 Market estimates and forecast, 2018 - 2032
- 7.4.5.2 Market estimates and forecast, by technology, 2018 - 2032
- 7.4.5.3 Market estimates and forecast, by application, 2018 - 2032
- 7.4.6 Japan
- 7.4.6.1 Market estimates and forecast, 2018 - 2032
- 7.4.6.2 Market estimates and forecast, by technology, 2018 - 2032
- 7.4.6.3 Market estimates and forecast, by application, 2018 - 2032
- 7.4.7 South Korea
- 7.4.7.1 Market estimates and forecast, 2018 - 2032
- 7.4.7.2 Market estimates and forecast, by technology, 2018 - 2032
- 7.4.7.3 Market estimates and forecast, by application, 2018 - 2032
- 7.4.8 Australia
- 7.4.8.1 Market estimates and forecast, 2018 - 2032
- 7.4.8.2 Market estimates and forecast, by technology, 2018 - 2032
- 7.4.8.3 Market estimates and forecast, by application, 2018 - 2032
- 7.5 Latin America
- 7.5.1 Market estimates and forecast, 2018 - 2032
- 7.5.2 Market estimates and forecast, by technology, 2018 - 2032
- 7.5.3 Market estimates and forecast, by application, 2018 - 2032
- 7.5.4 Brazil
- 7.5.4.1 Market estimates and forecast, 2018 - 2032
- 7.5.4.2 Market estimates and forecast, by technology, 2018 - 2032
- 7.5.4.3 Market estimates and forecast, by application, 2018 - 2032
- 7.5.5 Mexico
- 7.5.5.1 Market estimates and forecast, 2018 - 2032
- 7.5.5.2 Market estimates and forecast, by technology, 2018 - 2032
- 7.5.5.3 Market estimates and forecast, by application, 2018 - 2032
- 7.6 MEA
- 7.6.1 Market estimates and forecast, 2018 - 2032
- 7.6.2 Market estimates and forecast, by technology, 2018 - 2032
- 7.6.3 Market estimates and forecast, by application, 2018 - 2032
- 7.6.4 UAE
- 7.6.4.1 Market estimates and forecast, 2018 - 2032
- 7.6.4.2 Market estimates and forecast, by technology, 2018 - 2032
- 7.6.4.3 Market estimates and forecast, by application, 2018 - 2032
- 7.6.5 Saudi Arabia
- 7.6.5.1 Market estimates and forecast, 2018 - 2032
- 7.6.5.2 Market estimates and forecast, by technology, 2018 - 2032
- 7.6.5.3 Market estimates and forecast, by application, 2018 - 2032
- 7.6.6 South Africa
- 7.6.6.1 Market estimates and forecast, 2018 - 2032
- 7.6.6.2 Market estimates and forecast, by technology, 2018 - 2032
- 7.6.6.3 Market estimates and forecast, by application, 2018 - 2032
Chapter 8 Company Profiles
- 8.1 Convenient Power Ltd.
- 8.1.1 Business Overview
- 8.1.2 Financial Data
- 8.1.3 Product Landscape
- 8.1.4 Strategic Outlook
- 8.1.5 SWOT Analysis
- 8.2 Energizer Holdings Inc.
- 8.2.1 Business Overview
- 8.2.2 Financial Data
- 8.2.3 Product Landscape
- 8.2.4 Strategic Outlook
- 8.2.5 SWOT Analysis
- 8.3 Evatran LLC (Plugless Power)
- 8.3.1 Business Overview
- 8.3.2 Financial Data
- 8.3.3 Product Landscape
- 8.3.4 Strategic Outlook
- 8.3.5 SWOT Analysis
- 8.4 Infineon Technologies
- 8.4.1 Business Overview
- 8.4.2 Financial Data
- 8.4.3 Product Landscape
- 8.4.4 Strategic Outlook
- 8.4.5 SWOT Analysis
- 8.5 Leggett & Platt Inc.
- 8.5.1 Business Overview
- 8.5.2 Financial Data
- 8.5.3 Product Landscape
- 8.5.4 Strategic Outlook
- 8.5.5 SWOT Analysis
- 8.6 Mediatek Inc.
- 8.6.1 Business Overview
- 8.6.2 Financial Data
- 8.6.3 Product Landscape
- 8.6.4 Strategic Outlook
- 8.6.5 SWOT Analysis
- 8.7 Mojo Mobility Inc.
- 8.7.1 Business Overview
- 8.7.2 Financial Data
- 8.7.3 Product Landscape
- 8.7.4 Strategic Outlook
- 8.7.5 SWOT Analysis
- 8.8 Murata Manufacturing Co. Ltd.
- 8.8.1 Business Overview
- 8.8.2 Financial Data
- 8.8.3 Product Landscape
- 8.8.4 Strategic Outlook
- 8.8.5 SWOT Analysis
- 8.9 OSSIA
- 8.9.1 Business Overview
- 8.9.2 Financial Data
- 8.9.3 Product Landscape
- 8.9.4 Strategic Outlook
- 8.9.5 SWOT Analysis
- 8.10 Powercast Corporation
- 8.10.1 Business Overview
- 8.10.2 Financial Data
- 8.10.3 Product Landscape
- 8.10.4 Strategic Outlook
- 8.10.5 SWOT Analysis
- 8.11 Powermat Technologies
- 8.11.1 Business Overview
- 8.11.2 Financial Data
- 8.11.3 Product Landscape
- 8.11.4 Strategic Outlook
- 8.11.5 SWOT Analysis
- 8.12 Qualcomm Incorporated
- 8.12.1 Business Overview
- 8.12.2 Financial Data
- 8.12.3 Product Landscape
- 8.12.4 Strategic Outlook
- 8.12.5 SWOT Analysis
- 8.13 Renesas Electronics
- 8.13.1 Business Overview
- 8.13.2 Financial Data
- 8.13.3 Product Landscape
- 8.13.4 Strategic Outlook
- 8.13.5 SWOT Analysis
- 8.14 Samsung Electronics Co. Ltd.
- 8.14.1 Business Overview
- 8.14.2 Financial Data
- 8.14.3 Product Landscape
- 8.14.4 Strategic Outlook
- 8.14.5 SWOT Analysis
- 8.15 Semtech Corporation
- 8.15.1 Business Overview
- 8.15.2 Financial Data
- 8.15.3 Product Landscape
- 8.15.4 Strategic Outlook
- 8.15.5 SWOT Analysis
- 8.16 Texas Instruments Inc.
- 8.16.1 Business Overview
- 8.16.2 Financial Data
- 8.16.3 Product Landscape
- 8.16.4 Strategic Outlook
- 8.16.5 SWOT Analysis
- 8.17 Thales Group
- 8.17.1 Business Overview
- 8.17.2 Financial Data
- 8.17.3 Product Landscape
- 8.17.4 Strategic Outlook
- 8.17.5 SWOT Analysis
- 8.18 WiBotic
- 8.18.1 Business Overview
- 8.18.2 Financial Data
- 8.18.3 Product Landscape
- 8.18.4 Strategic Outlook
- 8.18.5 SWOT Analysis
- 8.19 Wiferion Gmbh
- 8.19.1 Business Overview
- 8.19.2 Financial Data
- 8.19.3 Product Landscape
- 8.19.4 Strategic Outlook
- 8.19.5 SWOT Analysis
- 8.20 Witricity Corporation
- 8.20.1 Business Overview
- 8.20.2 Financial Data
- 8.20.3 Product Landscape
- 8.20.4 Strategic Outlook
- 8.20.5 SWOT Analysis