|
|
市場調査レポート
商品コード
1086909
スピリッツセクターの世界市場:市場機会Opportunities in the Global Spirits Sector |
||||||
|
|
|||||||
|
● お客様のご希望に応じて、既存データの加工や未掲載情報(例:国別セグメント)の追加などの対応が可能です。 詳細はお問い合わせください。 |
|||||||


| スピリッツセクターの世界市場:市場機会 |
|
出版日: 2022年04月13日
発行: GlobalData
ページ情報: 英文 211 Pages
納期: 即納可能
|
- 全表示
- 概要
- 図表
- 目次
世界のスピリッツの市場規模は、2021年に7,835億米ドルとなり、2021~2026年にかけて6.5%のCAGRで成長し、2026年には1兆730億米ドルに達すると予測されています。
2021年の世界のスピリッツ市場で、アジア太平洋が金額シェア57%で最大の地域を占め、次いで南北アメリカが19.8%、西欧が12.2%のシェアを占めています。スピリッツに含まれる人工成分や化学物質が及ぼす有害な影響に対する健康上の懸念が高まりにより、世界中の消費者は有機的な原料を使用したスピリッツを選ぶようになりました。有機製品への要望が高まる中、蒸留所は有機スピリッツの製造を増やし、「有機」認証を提供する機関と提携するようになっています。
当レポートでは、世界のスピリッツ市場について調査分析し、セクターの概要、国の深堀、競合情勢、自社ブランドの市場シェア、主要な流通チャネル等に関する情報を提供しています。
目次
目次
- エグゼクティブサマリー
第1章 セクターの概要
- 現在のシナリオと将来の見通し
- 世界のスピリッツセクターの概要
- 地域のスピリッツセクターの概要
- 世界のスピリッツセクターの主な課題
第2章 スピリッツの消費パターンの変化
- アルコール業界全体の消費レベルの変化:2016~2026年
- 消費パターンの変化の理由
第3章 潜在能力の高い国の特定:国別
- リスク-リワード分析に基づく10か国の分析(市場評価、経済発展)
- 社会人口統計学的要因(ガバナンス指標、技術インフラ)
第4章 国の深堀
- 潜在能力の高い国の分析
- 今後の展望
第5章 競合情勢-世界・地域分析
- 大手企業:数量別-世界
- 企業とブランドのシェア分析-世界
- 企業とブランドのシェア分析:地域別
第6章 競合情勢-市場分析
第7章 自社ブランドの市場シェア
- 自社ブランドシェア分析:地域別
- 自社ブランドシェア分析:カテゴリー別
第8章 主要な流通チャネル
- 主要な流通チャネルのシェア-世界・地域レベル
第9章 主要なパッケージ形式
- 成長分析:主要パックの材質とパックタイプ別
- 成長分析:クロージャータイプと一次外装タイプ別
付録
- 定義
- GlobalDataについて
List of Tables
List of Tables
- Key categories by value and volume (%), 2021 vs. 2026 - Global
- Key categories by value and volume (%), 2021 vs. 2026 - Asia-Pacific
- Key categories by value and volume (%), 2021 vs. 2026 - Middle East & Africa
- Key categories by value and volume (%), 2021 vs. 2026 - Americas
- Key categories by value and volume (%), 2021 vs. 2026 - Western Europe
- Key categories by value and volume (%), 2021 vs. 2026 - Eastern Europe
- New Zealand: category share
- New Zealand: demographic analysis
- New Zealand: market size analysis of top 10 cities
- New Zealand: top 10 cities' contribution to volume growth
- Australia: category share
- Australia: demographic analysis
- Australia: market size analysis of top 10 cities
- Australia: top 10 cities' contribution to volume growth
- Japan: category share
- Japan: demographic analysis
- Japan: market size analysis of top 10 cities
- Japan: top 10 cities' contribution to volume growth
- The UAE: category share
- The UAE: demographic analysis
- The UAE: Volume performance analysis of top four cities (million liters), 2016-2021
- The UAE: Volume growth contribution of top four cities (million liters), 2016-2021
- Canada: category share
- Canada: demographic analysis
- Canada: market size analysis of top 10 cities
- Canada: top 10 cities' contribution to volume growth
- Chile: category share
- Chile: demographic analysis
- Chile: market size analysis of top 10 cities
- Chile: top 10 cities' contribution to volume growth
- The UK: category share
- The UK: demographic analysis
- The UK: market size analysis of top 10 cities
- The UK: top 10 cities' contribution to volume growth
- Switzerland: category share
- Poland: category share
- Poland: demographic analysis
- Poland: market size analysis of top 10 cities
- Poland: top 10 cities' contribution to volume growth
- The Czech Republic: category share
- The Czech Republic: demographic analysis
- The Czech Republic: market size analysis of top 10 cities
- The Czech Republic: top 10 cities' contribution to volume growth
- Leading companies in the global spirits sector (% volume share), 2020
- Key pack material volume share (%), 2021
- Annual volume growth by pack material (%), 2016-2026
- Key Pack Type Volume Share (%), 2021
- Annual Volume Growth by Pack Type (%), 2016-2026
- Key Closure Type Volume Share (%), 2021
- Annual Volume Growth by Closure Type (%), 2016-2026
- Key Primary Outer Volume Share (%), 2021
- Annual Volume Growth by Primary Outer (%), 2016-2026
List of Figures
List of Figures
- Change in consumption levels in the overall alcohol industry, 2016-2026
- Change in consumption levels in the overall alcohol industry - Asia-Pacific, 2016-2026
- Change in consumption levels in the overall alcohol industry - Middle East & Africa, 2016-2026
- Change in consumption levels in the overall alcohol industry - Americas, 2016-2026
- Change in consumption levels in the overall alcohol industry - Western Europe, 2016-2026
- Change in consumption levels in the overall alcohol industry - Eastern Europe, 2016-2026
- Identifying high-potential countries, risk-reward analysis - Asia-Pacific
- Identifying high-potential countries, risk-reward analysis - Middle East & Africa
- Identifying high-potential countries, risk-reward analysis - Americas
- Identifying high-potential countries, risk-reward analysis - Western Europe
- Identifying high-potential countries, risk-reward analysis - Eastern Europe
- New Zealand: market size analysis of top 10 cities by category
- Australia: market size analysis of top 10 cities by category
- Japan: market size analysis of top 10 cities by category
- The UAE: Volume analysis of top four cities by category (million liters), 2021
- Canada: market size analysis of top 10 cities by category
- Chile: market size analysis of top 10 cities by category
- The UK: market size analysis of top 10 cities by category
- Poland: market size analysis of top 10 cities by category
- The Czech Republic: market size analysis of top 10 cities by category
- Company and brand share analysis - Global
- Company and brand share analysis - Asia-Pacific
- Company and brand share analysis - Middle East & Africa
- Company and brand share analysis - Americas
- Company and brand share analysis - Western Europe
- Company and brand share analysis - Eastern Europe
- Key brands - Brandy
- Key brands - Flavored alcoholic beverages
- Key brands - Gin & genever
- Key brands - Liqueurs
- Key brands - Rum
- Key brands - Specialty spirits
- Key brands - Tequila & mezcal
- Key brands - Vodka
- Key brands - Whiskey
- Private label volume and share by region, 2015-2020
- Private label volume sales (million liters) and share (%) by category, 2020
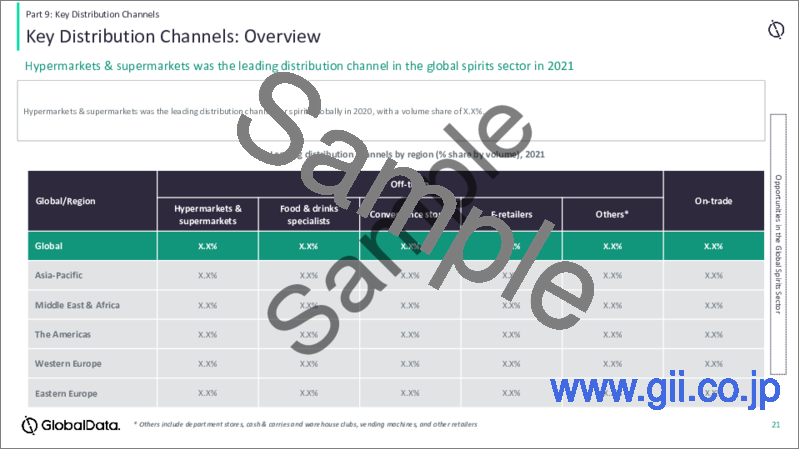
- Leading distribution channels by region (% share by volume), 2021
The global spirits sector was valued at $783.5 billion in 2021 and is forecast to post a CAGR of 6.5% during 2021-2026 to reach $1,073.0 billion in 2026. Asia-Pacific represented the largest region for the global spirits sector in 2021, with a value share of 57%, followed by the Americas and Western Europe, which accounted for 19.8% and 12.2% shares, respectively. Among all the regions, Middle East & Africa is forecast to record the highest value CAGR (9.4%) during 2021-2026. In volume terms, the sector is predicted to grow from 37.3 billion liters in 2021 to 46.2 billion liters in 2026, at a CAGR of 4.4%. In 2021, the specialty spirits category held the highest value and volume shares, with 44.3% and 42.8%, respectively. Meanwhile, flavored alcoholic beverages is expected to be the fastest-growing category, with a projected value CAGR of 11.4%, during 2021-2026. In the global spirits market, the top five companies accounted for a combined volume share of 17.8% in 2020. Diageo plc was the leading company with a volume share of 5.7% in 2020, followed by Suntory Holdings Ltd (3.4%), Pernod Ricard (3.1%), Mark Anthony Brands International Unlimited Company (3%), and Hite Jinro Co., Ltd (2.6%).
Rising health concerns over the harmful impact of artificial ingredients and chemicals in spirits are alarming consumers worldwide, influencing them to choose spirits made using organic ingredients. The growing desire for organic products is leading distilleries to manufacture more organic spirits and partner with institutions that provide "organic" certifications. In addition, the rising consumer-awareness of the impact of alcohol on health and weight is driving the demand for spirits products with "low-sugar" or "low-calorie" claims. Spirits brands are improving their labeling to match consumers' changing values and lifestyles. Spirits drinks manufacturers are increasingly adopting labels with claims such as "vegan-friendly" or "gluten-free".
Scope
- Provides an overview of current industry scenario regarding the future outlook in terms of ingredients, product claims, labeling, and packaging.
- The analysis also covers regional overview across five regions - Asia-Pacific, Middle East & Africa, Americas, Western Europe, and Eastern Europe - highlighting industry size, growth drivers, latest developments, and future inhibitors for the regions.
Reasons to Buy
- Manufacturing and retailers seek latest information on how the market is evolving to formulate their sales and marketing strategies. There is also demand for authentic market data with a high level of detail.
- This report has been created to provide its readers with up-to-date information and analysis to uncover emerging opportunities of growth within the sector in the region
- The report provides a detailed analysis of the countries in the region, covering the key challenges, competitive landscape and demographic analysis, that can help companies gain insight into the country specific nuances
- The analysts have also placed a significant emphasis on the key trends that drive consumer choice and the future opportunities that can be explored in the region, than can help companies in revenue expansion
- To gain competitive intelligence about leading brands in the sector in the region with information about their market share and growth rates
Table of Contents
Table of Contents
- Executive Summary
Part 1: Sector Overview
- Current Scenario and Future Outlook
- Global Spirits Sector Overview
- Regional Spirits Sector Overview
- Key Challenges in the Global Spirits Sector
Part 2: Shift in Spirits Consumption Patterns
- Change in Consumption Levels in the Overall Alcohol Industry, 2016-2026
- Reasons for Shift in Consumption Patterns
Part 3: Identifying High-Potential Countries by Countries
- Analysis of 10 Countries on the Basis of Risk-Reward Analysis (Market Assessment, Economic Development,
- Sociodemographic Factors, Governance Indicators, and Technological Infrastructure)
Part 4: Country Deep Dive
- High-Potential Country Analysis
- Future Outlook
Part 5: Competitive Landscape - Global and Regional Analysis
- Leading Companies by Volume - Global
- Company and Brand Share Analysis - Global
- Company and Brand Share Analysis by Region
Part 6: Competitive Landscape - Market Analysis
Part 7: Market Share of Private Label
- Private Label Share Analysis by Region
- Private Label Share Analysis by Category
Part 8: Key Distribution Channels
- Share of Key Distribution Channels - Global and Regional Level
Part 9: Key Packaging Formats
- Growth Analysis by Key Pack Material and Pack Type
- Growth Analysis by Closure Type and Primary Outer Type
Appendix
- Definitions
- About GlobalData