|
|
市場調査レポート
商品コード
1179854
グリーン水素の世界市場-2022-2029Global Green Hydrogen Market - 2022-2029 |
||||||
|
|
|||||||
|
● お客様のご希望に応じて、既存データの加工や未掲載情報(例:国別セグメント)の追加などの対応が可能です。 詳細はお問い合わせください。 |
|||||||


| グリーン水素の世界市場-2022-2029 |
|
出版日: 2023年01月05日
発行: DataM Intelligence
ページ情報: 英文 282 Pages
納期: 約2営業日
|
- 全表示
- 概要
- 目次
市場の概要
グリーン水素の世界市場は、予測期間(2022-2029年)にCAGR20.9%で成長することで大きな成長を記録すると予測されます。
電流を使って水中の酸素から水素を分離する電解は、グリーン水素を製造する数多くの技術の一つです。また、バイオガスは、水素分離、水-ガスシフト反応、バイオガス改質などの多段階プロセスにより、持続可能な資源としてグリーン水素に変換することが可能です。グリーン水素は、普遍的で軽く、反応性が高いため、温室効果ガスの排出を大幅に削減する可能性があります。また、鉄鋼や化学などの産業、海運や運輸などのビジネスにおいて、燃料や原料として使用されることで、脱炭素化にも貢献する可能性があります。グリーン水素は、化石燃料の代わりに発電し、再生可能エネルギーを貯蔵することも可能です。ガスタービンは、グリーン水素とアンモニアを使用して、電力需要と供給の変動を制御することも可能です。
市場力学
輸送産業におけるグリーン水素の使用量の増加は、世界のグリーン水素市場の主要な促進要因です。しかし、製造プロセス、輸送、貯蔵に関連する制約が、市場の主要な抑制要因となる可能性があります。
輸送産業におけるグリーン水素の使用量増加
都市部での大気汚染や大気中への二酸化炭素排出量の削減など、数多くの環境上の利点があるため、グリーン水素は輸送産業で広く使用されています。運輸業界は、温室効果ガス排出量と都市部の大気汚染のほぼ25%を担っています。モビリティ分野において化石燃料を代替できるグリーン水素は、エネルギー効率の高い脱炭素システムへのアプローチとして期待されています。
世界は、ネット・ゼロ・エミッションの目標に向けて、その方法を変える準備を進めています。運輸部門では、燃料電池や内燃機関で直接水素を利用する車両の開発が進んでいます。水素を動力源とするフォークリフトはすでに誕生し、欧州、アジア、北米の一部の産業で使用されています。
特にAPAC、北米、欧州では、燃料電池を搭載した電気自動車やバスが普及しているため、グリーン水素の需要が急増しています。水素燃料電池車を供給するために、欧州連合(EU)は、2030年までにおよそ2,615,000トンのグリーン水素の合計容量を持つ約5,000の水素燃料供給ステーションを持つことになります。
2017年以降、米国は水素燃料のインフラ整備と開発に毎年1億5,000万米ドルを投資しています。さらに、欧州とアジアの政府によって、水素燃料の生産に毎年20億米ドル以上が投資されています。
中国は、2023年までに水素を利用した輸送手段に2,170億米ドル以上を投資すると表明しています。インド科学技術省の上級顧問によると、インドが2070年までにカーボンニュートラルを達成するためには、環境に優しい水素と電気自動車への移行が不可欠であるとのことです。輸送は、それが実現される分野のひとつです。
製造プロセス、輸送、貯蔵にまつわる限界
製造プロセスを経済的・商業的に成立させることは、最も困難な課題です。インドをはじめ多くの国が国家的な水素プログラムを発表しているが、電解など多くの製造プロセスがまだ試験段階であるため、燃料をどのように大規模に商業化するかはまだ決まっていないです。
さらに、最初にグリーン水素を製造するのは、平均してグレー水素よりもコストが高いです。貯蔵や輸送のためのインフラが整っていないことが、この課題をより困難にしています。プラントを建設するための固定費は半分に過ぎず、グリーン水素の輸送には資金面や安全面の問題が残っています。経営陣は、戦略的輸送計画の地平で、2つの異なるタイプの不確実性に対処しなければならないです。まず第一に、過去のデータが乏しいため、モデルの多数のパラメータの値を自信を持って予測することが不可能でした。
さらに、経営者や意思決定者は、このようなネットワーク設計の課題が複雑であるため、モデルの具体的な制約を指定することができません。グリーン水素サプライチェーンにおける制約の柔軟性は関連性があるにもかかわらず、それらがモデル定式化にどのような影響を与えるかを調査した研究者はまだいないです。このような不確実性は、結果の信頼性に大きく影響し、輸送ネットワークの応答性に大きく影響する可能性があり、顧客の需要に対する憤りを増大させる可能性があります。
COVID-19影響度分析
グリーン水素ガスの需要は、世界的に水素を利用した燃料電池車の発売・販売が急増していることに起因しています。例えば、2020年6月12日の水素燃料電池車、H2Xオーストラリアは、ムーバーからトラクターや自動車などの大型車など、幅広い水素燃料電池車(FCEV)を発売し、生産する計画です。現在、グリーン水素ガスの需要は、金属、ガラス、医薬品などに関するいくつかの製造業が、燃料となる水素を十分に供給しているため安定している
燃料としての水素の需要は、水素を利用した新しい自動車の発売と水素燃料ステーションの需要の急増により増加しています。例えば、2020年11月27日、オーストラリアの電力会社であるオリジン・エナジー社は、オーストラリアに約300MWの水素電解槽とバイ電池を設置し、水素製造を加速させる計画です。このように、複数の有力プレイヤーが水素関連プロジェクトに投資することで、需要は増加すると考えられます。水素技術への投資を直接奨励する政策をとる国の数は、対象となる産業の数と同様、増加傾向にあります。現在、水素を直接支援する約50の目標、義務、政策インセンティブが実施されており、その大半は輸送に焦点を当てたものです。
例えば、2020年10月23日、キャンベラ・オーストラリア政府は、アジア再生可能エネルギーハブ(AREH)に対して、メガ水素と再生可能エネルギープロジェクトを迅速に推進するための360億米ドルプロジェクトを発注しました。このように現在、アジア太平洋地域の水素電解槽の需要は、大手企業や政府当局による水素技術へのメガ投資やプロジェクトが急増し、安定的に推移しています。COVID-19が流行する中、グリーン水素ガスの価格構造は、水素の需要不足により若干低下しました。オーストラリア政府は、水素関連技術のインフラ整備に巨額の投資を行うことで、水素製造の総コストを削減することを計画しています。Enapter社の水素電解装置による水素製造コストは、2019年時点で7.6米ドル以下であり、2020年から2030年にかけて1Kgあたり約1.60米ドルのコスト削減を目指すとしています。
また、水素技術に対する政府の支援や取り組みが、水素製造のコストを低下させる可能性もあります。
目次
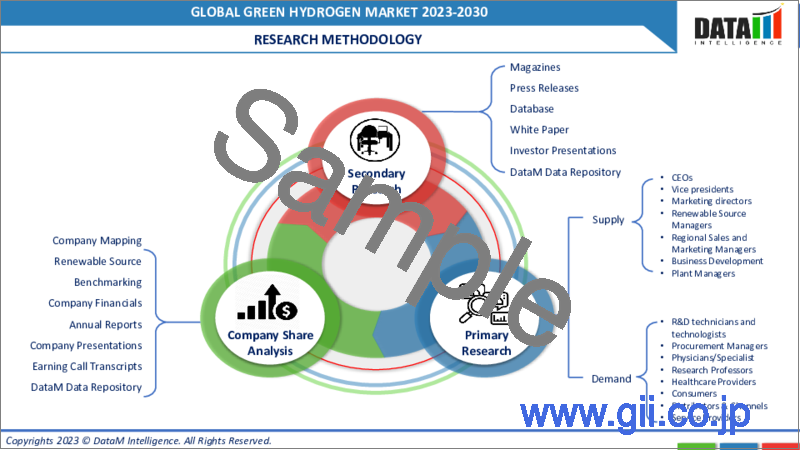
第1章 グリーン水素の世界市場- 調査手法とスコープ
- 調査手法
- 調査目的・調査範囲
第2章 グリーン水素の世界市場-市場の定義と概要
第3章 グリーン水素の世界市場- エグゼクティブサマリー
- 技術別市場内訳
- 再生可能資源別市場内訳
- アプリケーション別市場内訳
- エンドユーザー別市場内訳
- 地域別市場内訳
第4章 グリーン水素の世界市場-市場力学
- 市場影響要因
- 促進要因
- 輸送産業におけるグリーン水素の利用拡大
- 抑制要因
- 製造プロセス、輸送、貯蔵に関連する制約
- 市場機会
- 影響分析
- 促進要因
第5章 グリーン水素の世界市場-産業分析
- ポーターのファイブフォース分析
- サプライチェーン分析
- 価格設定分析
- 規制分析
第6章 グリーン水素の世界市場-COVID-19分析
- COVID-19の市場分析
- COVID-19市場参入前のシナリオ
- COVID-19の現在の市場シナリオ
- COVID-19の後、または将来のシナリオ
- COVID-19の中での価格ダイナミクス
- 需要-供給スペクトラム
- パンデミック時の市場に関連する政府の取り組み
- メーカーの戦略的な取り組み
- まとめ
第7章 グリーン水素の世界市場- 技術別
- アルカリ電解槽
- プロトン交換膜電解槽
- 固体酸化物型電解槽
- その他
第8章 グリーン水素の世界市場-再生可能エネルギー源別
- 風力エネルギー
- 太陽エネルギー
- 地熱
- 水力発電
- その他
第9章 グリーン水素の世界市場-用途別
- 発電
- 輸送
- その他
第10章 グリーン水素の世界市場-エンドユーザー別
- 産業用
- モビリティ
- 化学
- 電力
- グリッド・インジェクション
- その他
第11章 グリーン水素の世界市場-地域別
- 北米
- 米国
- カナダ
- メキシコ
- 欧州
- ドイツ
- 英国
- フランス
- イタリア
- ロシア
- その他欧州
- 南米
- ブラジル
- アルゼンチン
- その他の南米地域
- アジア太平洋地域
- 中国
- インド
- 日本
- オーストラリア
- その他アジア太平洋地域
- 中東・アフリカ地域
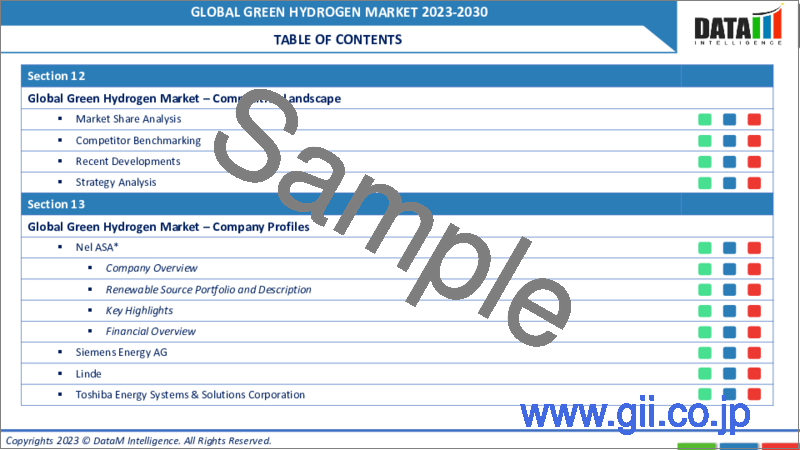
第12章 グリーン水素の世界市場- 競争情勢
- 競合シナリオ
- 市況分析/シェア分析
- M&A(合併・買収)分析
第13章 グリーン水素の世界市場-企業プロファイル
- Siemens Energy AG
- 企業概要
- 製品ポートフォリオと説明
- 主なハイライト
- 財務概要
- Linde AG
- Air Liquide
- Nel ASA
- Cummins Inc.
- Air Products Inc
- H&R GROUP
- Nation Synergy Hydrogen
- Hamburg
- Toshiba Energy Systems & Solutions Corporation
第14章 グリーン水素の世界市場-重要考察
第15章 グリーン水素の世界市場-DataM
Market Overview
The Global Green Hydrogen Market reached US$ XX million in 2021 and is expected to record significant growth by reaching up to US$ XX million by 2029, growing at a CAGR of 20.9% during the forecast period (2022-2029).
Electrolysis, which divides hydrogen from oxygen in water using an electrical current, is one of many technologies that create green hydrogen. In addition, biogas can be converted into green hydrogen as a sustainable resource by using a multistep process that includes hydrogen separation, water-gas-shift reaction and biogas reforming. Green hydrogen is universal, light, highly reactive and has the potential to significantly lower greenhouse gas emissions. Green hydrogen may also aid in decarbonizing industries like steel and chemicals and businesses like shipping and transportation, where it may be used as a fuel and raw material. Green hydrogen could also generate electricity instead of fossil fuels and store renewable energy. Gas turbines could also use green hydrogen and ammonia to control power demand and supply variations.
Market Dynamics
The Increasing usage of green hydrogen in the transportation industry is a major global green hydrogen market driver. However, The limitations associated with manufacturing processes, transportation and storage could be a major market restraint.
Increasing usage of green hydrogen in the transportation industry
Due to its numerous environmental advantages, such as reducing air pollution in urban areas and overall carbon dioxide emissions to the atmosphere, green hydrogen is widely used in transportation. The transportation industry is responsible for almost 25% of greenhouse gas emissions and urban air pollution. Green hydrogen, which can replace fossil fuels in the mobility sector, is a promising approach to an energy-efficient and decarbonized system.
The world is getting ready to change how it moves toward net zero-emission goals. The transportation sector is developing vehicles that use hydrogen directly in fuel cells or internal combustion engines. Forklifts powered by hydrogen have already been created and used in a few industries throughout Europe, Asia and North America.
The demand for green hydrogen is soaring due to the popularity of fuel cell-based electric cars and buses, particularly in APAC, North America and Europe. To supply hydrogen fuel cell vehicles, the European Union (EU) would have about 5,000 hydrogen fueling stations with a combined capacity of roughly 2,615,000 Tons of green hydrogen by 2030.
Since 2017, U.S. has invested US$ 150 Million annually in the infrastructure and development of hydrogen fuel. Additionally, more than US$ 2 Billion is annually invested in hydrogen fuel production by governments in Europe and Asia.
China has pledged to invest over US$ 217 Billion in hydrogen-powered transportation through 2023. The transition to green hydrogen and electric vehicles will be crucial for India to achieve carbon neutrality by 2070, according to a senior advisor with the Indian Department of Science and Technology. Transportation is one of the areas where this will be the case.
The limitations associated with manufacturing processes, transportation and storage
Making the manufacturing process economically and commercially viable is the most challenging aspect of the process. Although many countries, including India, have announced national hydrogen programs, they have not yet decided how the fuel will be commercialized on a large scale because many production processes, like electrolysis, are still in the pilot stage.
Additionally, it is more expensive to produce green hydrogen initially than grey hydrogen on average. The challenge is made more difficult by the lack of infrastructure for storage and transportation. The fixed cost of building the plant is only half the battle; there are still financial and security issues with transporting green hydrogen. Management must deal with two different types of uncertainties in the strategic transportation planning horizon. First and foremost, it was impossible to confidently predict the value of the model's numerous parameters due to the dearth of historical data.
Furthermore, management and decision-makers cannot specify the specific restrictions of the models due to the complexity of such network design challenges. Despite the flexibility of the restrictions in green hydrogen supply chains being relevant, no researchers have yet examined how they might affect model formulation. Such uncertainties could significantly affect the dependability of the results, have the potential to significantly affect the responsiveness of the transportation network and increase client demand resentment.
COVID-19 Impact Analysis
The demand for green hydrogen gas is driven by the surge in launching and selling hydrogen-based fuel cell vehicles globally. For instance, the hydrogen fuel cell vehicles on 12th June 2020, H2X Australia launched and planned to produce a wide range of hydrogen fuel cell vehicles (FCEVs), including movers to heavy-duty vehicles such as tractors and cars, among others. Currently, the green hydrogen gas demand is stable as several manufacturing industries related to metal, glass and pharmaceuticals, among others, have a sufficient supply of hydrogen as fuel
The demand for hydrogen as a fuel is increasing due to the launching of new hydrogen-based vehicles with a surge in demand for hydrogen fuel stations. For instance, on 27th Nov 2020, origin Energy, an Australian power provider, planned to accelerate hydrogen production by installing around 300 MW of hydrogen electrolyzers and bi batteries in Australia. Thus demand is set to increase as several leading players invest in the hydrogen-related project. The number of countries with policies that directly encourage investment in hydrogen technologies is growing, as is the number of industries targeted. Today, approximately 50 targets, mandates and policy incentives are in place that directly supports hydrogen, with the majority focusing on transportation.
For instance, on 23rd October 2020, Canberra Australian government awarded a US$ 36 billion project to Asian Renewable Energy Hub (AREH) to fast-track mega hydrogen and renewable energy projects. Thus currently, the demand for the hydrogen electrolyzer in Asia-Pacific remained stable with the surge in the mega investments and projects for hydrogen technologies by the leading players and government authorities. The pricing structure of green hydrogen gas amid the COVID-19 pandemic slightly declined due to a lack of demand for hydrogen. The government of Australia is planning to reduce the total cost of hydrogen production by allocating huge investments for infrastructure development of hydrogen-related technologies. The hydrogen production cost with the hydrogen electrolyzer is less than US$ 7.6 as per the Enapter company hydrogen electrolyzer as of 2019 and the company aims to reduce the cost between 2020 and 2030 by around US$ 1.60 per Kg.
Also, government support and initiatives for hydrogen technologies may decline the cost of hydrogen production. For instance, the government of Australia launched National Hydrogen Strategy in 2019, which aims to reduce the hydrogen production cost from under US$ 1.48 which is under A$ 2 per kg.
Segment Analysis
The global green hydrogen market is classified based on technology, renewable sources, application, end-user and region.
Increasing launching of advanced technology offering cost-effectiveness with compact-size alkaline platforms that provide customized indoor hydrogen solutions for any application, with the required configuration and size
The alkaline electrolyzer uses potassium hydroxide and sodium hydroxide solutions as an electrolyte for hydrogen production. The alkaline electrolyzer consists of the two electrodes inserted in the electrolyte solutions in which chemical reactions occur after a sufficient voltage is supplied. The response separates water molecules into OH- ions and an H2 molecule at the anode and cathode, respectively.
The demand for the alkaline electrolyzer is driven by the increasing launching of advanced technology offering cost-effectiveness with compact-size alkaline platforms that provide customized indoor hydrogen solutions for any application, with the required configuration and size. For instance, on July 11, 2019, Nel ASA launched an A1000 alkaline hydrogen electrolyzer. It is a medium-scale electrolyzer with a capacity of around 2 Tons/day of hydrogen production. The alkaline A1000 hydrogen electrolyzer is built for industry-leading A-Range atmospheric alkaline platforms. The size ranges from 600 to 970 Nm3/hr with the flexibility to scale per customer demand.
Further increasing government initiatives, support and funding for developing hydrogen production electrolyzers and a surge in development projects have propelled the alkaline electrolyzer market. For instance, on April 17, 2020, the Asahi Kasei electrolysis system started the world's largest 10 MW alkaline hydrogen electrolyzer to supply hydrogen in Japan's Ashima hydrogen energy research field. The system was installed at Namie, Futaba, Fukushima hydrogen energy research field as a technological development project of Nado Japan's new energy industrial technology development organization. The alkaline hydrogen electrolyzer can produce 1200 Nm3 per hour of hydrogen.
In addition, the alkaline hydrogen electrolyzer in developing countries is increasing due to the lack of fossil fuels and rising government investment in renewable energy projects to minimize the import of fossil fuels such as oil and coal, among others. For instance, in 2016, the Japanese imports of fossil fuels, such as oil, coal and liquefied natural gases, increased by around 89%, making Japan the world's third-largest importer of coal. It created a massive demand for this region's hydrogen alkaline electrolyzer market.
Further, leading manufacturers launching and developing hydrogen electrolyzers, coupled with government support and funding, have created a massive demand for the Alkaline electrolyzer market's growth globally.
For instance, in July 2021, Hyundai Motor Company and Kia Corporation strengthened their efforts to usher in a global hydrogen society through affordable clean hydrogen production by signing a memorandum of understanding with Next Hydrogen Corporation, a Canadian business specializing in water electrolysis technology subsidiary of Next Hydrogen Solutions Inc. According to the agreement, the businesses will work together to create an alkaline water electrolysis system1 and its associated stack to generate green hydrogen economically and investigate the new business and technological potential.
In December 2021, ABB signed an order with HydrogenPro, a Norway-based hydrogen plant company, to provide electrical equipment for the world's largest single-stack high-pressure alkaline electrolyzer. The system generates hydrogen by using electricity to split water into hydrogen and oxygen. When fully operational in 2022, the system will be able to produce 1,100 normal cubic meters of green hydrogen per hour (Nm3/h) at a specially constructed test site in Herya, Norway.
Geographical Analysis
Government and private investments, growing awareness and green hydrogen's eco-friendly nature
U.S. produces about 11.4 Million Tons of hydrogen annually, primarily for fertilizer and chemical products and the refining of fossil fuels. U.S. Gulf Coast region has the infrastructure needed to handle this production. However, most of it is "grey hydrogen," produced in plants using a method that releases carbon dioxide from natural gas. To dramatically reduce the CO2 emissions, which would then produce what is known as blue hydrogen, some fossil fuel and manufacturing gas companies have suggested installing carbon capture and storage systems in these plants. However, proponents of clean energy and climate change worry that the blue hydrogen route could extend the use of natural gas, which, when released into the atmosphere, is a powerful greenhouse gas.
A zero-carbon substitute would be green hydrogen, produced using renewable electricity to power electrolyzers that split water molecules into hydrogen and oxygen. In challenging-to-decarbonize industries like steel and cement, shipping and aviation, it might take the place of fossil fuels. The North America green hydrogen market has witnessed enormous growth since 2019 and is expected to propel exponentially due to government and private investments, growing awareness and green hydrogen's eco-friendly nature. Suppose the plans of a group of former natural-gas storage developers and a significant Canadian energy infrastructure developer go accordingly. In that case, U.S. could see its biggest green hydrogen hub far up and running by 2025. Thyssenkrupp, a German conglomerate, has signed EPC contracts to construct what it claims will be record-size industrial facilities in North America for producing green hydrogen.
Further, Hy Stor Energy announced in October 2021 that it plans to construct a green hydrogen generation and processing plant that could match the size of similar European projects. The initial stage of the project could produce 110,000 Tons of green hydrogen annually and store more than 70,000 Tons of it in salt caverns beneath the ground by 2025.
Competitive Landscape
The global green hydrogen market is growing swiftly and is becoming increasingly competitive due to the presence of major players such as Siemens Energy AG, Toshiba Energy Systems & Solutions Corporation, Linde AG, Air Liquide, Nel ASA, Cummins Inc., Air Products Inc, H&R GROUP, Nation Synergy Hydrogen and Hamburg. The market is fragmented and market players employ market tactics such as mergers, acquisitions, product launches, contributions and collaborations to gain a competitive advantage and recognition.
Siemens Energy AG
Overview: Siemens energy global is engaged in advanced technology providers which thrive on supporting a sustainable world. The company's portfolio of solutions, products and services includes power generation, energy technologies, decarbonization, industrial applications, power transmission, green hydrogen production, energy storage systems and renewable energy technologies.
The company exists in more than 90 countries located. The energy technology portfolio includes hybrid power plants operated with hydrogen, gas and steam turbines and power generators & transformers. On October 27, 2020, Siemens Gas and Power changed its name and business address to Siemens Energy Global.
Product Portfolio:
- Heavy-duty gas turbines: Heavy-duty gas turbine engines are tough and adaptable, making them ideal for large simple or combined-cycle power plants. They can be used for peak, intermediate, base load duty and cogeneration. Our extensive validation and testing capabilities benefit our customers. All engines have been commercially tested and provide exceptional efficiency.
Key Development:
- On August 19, 2020, Siemens Energy Global launched its first-megawatt green Hydrogen production project in China. Siemens Energy Global and Beijing Green Hydrogen Technology Development Co., Ltd., a subsidiary of China Power International Development Ltd. (China Power), collaborated and signed an agreement to provide a Hydrogen production system for a Hydrogen fueling station in Yanqing District, Beijing, China.
Why Purchase the Report?
- To visualize the global green hydrogen market segmentation based on technology, renewable sources, application, end-user and region, as well as understand key commercial assets and players.
- Identify commercial opportunities in the global green hydrogen market by analyzing trends and co-development.
- Excel data sheet with numerous data points of green hydrogen market-level with four segments.
- PDF report consisting of cogently put together market analysis after exhaustive qualitative interviews and in-depth market study.
- Product mapping available as excel consisting of key products of all the major market players
The global green hydrogen market report would provide approximately 69 tables, 72 figures and almost 282 pages.
Product Audience 2023:
- Manufacturers/ Buyers
- Industry Investors/Investment Bankers
- Research Professionals
- Emerging Companies
Table of Contents
1. Global Green Hydrogen Market - Methodology and Scope
- 1.1. Research Methodology
- 1.2. Research Objective and Scope of the Report
2. Global Green Hydrogen Market - Market Definition and Overview
3. Global Green Hydrogen Market - Executive Summary
- 3.1. Market Snippet by Technology
- 3.2. Market Snippet by Renewable Sources
- 3.3. Market Snippet by Application
- 3.4. Market Snippet by End-User
- 3.5. Market Snippet by Region
4. Global Green Hydrogen Market-Market Dynamics
- 4.1. Market Impacting Factors
- 4.1.1. Drivers
- 4.1.1.1. Increasing usage of green hydrogen in the transportation industry
- 4.1.1.2. XX
- 4.1.2. Restraints
- 4.1.2.1. The limitations associated with manufacturing processes, transportation and storage
- 4.1.2.2. XX
- 4.1.3. Opportunity
- 4.1.3.1. XX
- 4.1.4. Impact Analysis
- 4.1.1. Drivers
5. Global Green Hydrogen Market - Industry Analysis
- 5.1. Porter's Five Forces Analysis
- 5.2. Supply Chain Analysis
- 5.3. Pricing Analysis
- 5.4. Regulatory Analysis
6. Global Green Hydrogen Market - COVID-19 Analysis
- 6.1. Analysis of COVID-19 on the Market
- 6.1.1. Before COVID-19 Market Scenario
- 6.1.2. Present COVID-19 Market Scenario
- 6.1.3. After COVID-19 or Future Scenario
- 6.2. Pricing Dynamics Amid COVID-19
- 6.3. Demand-Supply Spectrum
- 6.4. Government Initiatives Related to the Market During Pandemic
- 6.5. Manufacturers Strategic Initiatives
- 6.6. Conclusion
7. Global Green Hydrogen Market - By Technology
- 7.1. Introduction
- 7.1.1. Market Size Analysis and Y-o-Y Growth Analysis (%), By Technology
- 7.1.2. Market Attractiveness Index, By Technology
- 7.2. Alkaline Electrolyzer*
- 7.2.1. Introduction
- 7.2.2. Market Size Analysis and Y-o-Y Growth Analysis (%)
- 7.3. Proton Exchange Membrane Electrolyzer
- 7.4. Solid Oxide Electrolyzer
- 7.5. Others
8. Global Green Hydrogen Market - By Renewable Sources
- 8.1. Introduction
- 8.1.1. Market Size Analysis and Y-o-Y Growth Analysis (%), By Renewable Sources
- 8.1.2. Market Attractiveness Index, By Renewable Sources
- 8.2. Wind Energy*
- 8.2.1. Introduction
- 8.2.2. Market Size Analysis and Y-o-Y Growth Analysis (%)
- 8.3. Solar Energy
- 8.4. Geothermal
- 8.5. Hydropower
- 8.6. Others
9. Global Green Hydrogen Market - By Application
- 9.1. Introduction
- 9.1.1. Market Size Analysis and Y-o-Y Growth Analysis (%), By Application
- 9.1.2. Market Attractiveness Index, By Application
- 9.2. Power Generation*
- 9.2.1. Introduction
- 9.2.2. Market Size Analysis and Y-o-Y Growth Analysis (%)
- 9.3. Transport
- 9.4. Others
10. Global Green Hydrogen Market - By End-User
- 10.1. Introduction
- 10.1.1. Market Size Analysis and Y-o-Y Growth Analysis (%), By End-User
- 10.1.2. Market Attractiveness Index, By End-User
- 10.2. Industrial*
- 10.2.1. Introduction
- 10.2.2. Market Size Analysis and Y-o-Y Growth Analysis (%)
- 10.3. Mobility
- 10.4. Chemical
- 10.5. Power
- 10.6. Grid Injection
- 10.7. Others
11. Global Green Hydrogen Market - By Region
- 11.1. Introduction
- 11.1.1. Market Size Analysis and Y-o-Y Growth Analysis (%), By Region
- 11.1.2. Market Attractiveness Index, By Region
- 11.2. North America
- 11.2.1. Introduction
- 11.2.2. Key Region-Specific Dynamics
- 11.2.3. Market Size Analysis and Y-o-Y Growth Analysis (%), By Technology
- 11.2.4. Market Size Analysis and Y-o-Y Growth Analysis (%), By Renewable Sources
- 11.2.5. Market Size Analysis and Y-o-Y Growth Analysis (%), By Application
- 11.2.6. Market Size Analysis and Y-o-Y Growth Analysis (%), By End-User
- 11.2.7. Market Size Analysis and Y-o-Y Growth Analysis (%), By Country
- 11.2.7.1. U.S.
- 11.2.7.2. Canada
- 11.2.7.3. Mexico
- 11.3. Europe
- 11.3.1. Introduction
- 11.3.2. Key Region-Specific Dynamics
- 11.3.3. Market Size Analysis and Y-o-Y Growth Analysis (%), By Technology
- 11.3.4. Market Size Analysis and Y-o-Y Growth Analysis (%), By Renewable Sources
- 11.3.5. Market Size Analysis and Y-o-Y Growth Analysis (%), By Application
- 11.3.6. Market Size Analysis and Y-o-Y Growth Analysis (%), By End-User
- 11.3.7. Market Size Analysis and Y-o-Y Growth Analysis (%), By Country
- 11.3.7.1. Germany
- 11.3.7.2. UK
- 11.3.7.3. France
- 11.3.7.4. Italy
- 11.3.7.5. Russia
- 11.3.7.6. Rest of Europe
- 11.4. South America
- 11.4.1. Introduction
- 11.4.2. Key Region-Specific Dynamics
- 11.4.3. Market Size Analysis and Y-o-Y Growth Analysis (%), By Technology
- 11.4.4. Market Size Analysis and Y-o-Y Growth Analysis (%), By Renewable Sources
- 11.4.5. Market Size Analysis and Y-o-Y Growth Analysis (%), By Application
- 11.4.6. Market Size Analysis and Y-o-Y Growth Analysis (%), By End-User
- 11.4.7. Market Size Analysis and Y-o-Y Growth Analysis (%), By Country
- 11.4.7.1. Brazil
- 11.4.7.2. Argentina
- 11.4.7.3. Rest of South America
- 11.5. Asia-Pacific
- 11.5.1. Introduction
- 11.5.2. Key Region-Specific Dynamics
- 11.5.3. Market Size Analysis and Y-o-Y Growth Analysis (%), By Technology
- 11.5.4. Market Size Analysis and Y-o-Y Growth Analysis (%), By Renewable Sources
- 11.5.5. Market Size Analysis and Y-o-Y Growth Analysis (%), By Application
- 11.5.6. Market Size Analysis and Y-o-Y Growth Analysis (%), By End-User
- 11.5.7. Market Size Analysis and Y-o-Y Growth Analysis (%), By Country
- 11.5.7.1. China
- 11.5.7.2. India
- 11.5.7.3. Japan
- 11.5.7.4. Australia
- 11.5.7.5. Rest of Asia-Pacific
- 11.6. Middle East and Africa
- 11.6.1. Introduction
- 11.6.2. Key Region-Specific Dynamics
- 11.6.3. Market Size Analysis and Y-o-Y Growth Analysis (%), By Technology
- 11.6.4. Market Size Analysis and Y-o-Y Growth Analysis (%), By Renewable Source
- 11.6.5. Market Size Analysis and Y-o-Y Growth Analysis (%), By Application
- 11.6.6. Market Size Analysis and Y-o-Y Growth Analysis (%), By End-User
12. Global Green Hydrogen Market - Competitive Landscape
- 12.1. Competitive Scenario
- 12.2. Market Positioning/Share Analysis
- 12.3. Mergers and Acquisitions Analysis
13. Global Green Hydrogen Market- Company Profiles
- 13.1. Siemens Energy AG*
- 13.1.1. Company Overview
- 13.1.2. Product Portfolio and Description
- 13.1.3. Key Highlights
- 13.1.4. Financial Overview
- 13.2. Linde AG
- 13.3. Air Liquide
- 13.4. Nel ASA
- 13.5. Cummins Inc.
- 13.6. Air Products Inc
- 13.7. H&R GROUP
- 13.8. Nation Synergy Hydrogen
- 13.9. Hamburg
- 13.10. Toshiba Energy Systems & Solutions Corporation
LIST NOT EXHAUSTIVE
14. Global Green Hydrogen Market - Premium Insights
15. Global Green Hydrogen Market - DataM
- 15.1. Appendix
- 15.2. About Us and Services
- 15.3. Contact Us