|
|
市場調査レポート
商品コード
1181081
グリーンアンモニアの世界市場 (2019-2029年):技術 (アルカリ水電解・プロトン交換膜・固体酸化物電解)・エンドユーザー・地域別の市場規模・シェア・動向分析・機会・予測Green Ammonia Market - Global Size, Share, Trend Analysis, Opportunity and Forecast Report, 2019-2029, Segmented By Technology (Alkaline Water Electrolysis, Proton Exchange Membrane, Solid Oxide Electrolysis ); By End User ; By Region |
||||||
|
|
|||||||


| グリーンアンモニアの世界市場 (2019-2029年):技術 (アルカリ水電解・プロトン交換膜・固体酸化物電解)・エンドユーザー・地域別の市場規模・シェア・動向分析・機会・予測 |
|
出版日: 2022年12月22日
発行: Blueweave Consulting
ページ情報: 英文 240 Pages
納期: 2~3営業日
|
- 全表示
- 概要
- 図表
- 目次
世界のグリーンアンモニアの市場規模は、2022年の5,438万米ドルから、予測期間中は85.3%のCAGRで推移し、2029年には39億6,280万米ドルの規模に成長すると予測されています。
同市場の規模は、持続可能な資源から生産されたグリーンアンモニアに対する発電および海上輸送産業からの需要の高まりにより、大きく成長しています。クリーンエネルギーの創出と二酸化炭素排出量の削減の重要性に対する人々の認識が高まるにつれ、グリーンアンモニアに対する需要は今後数年も増加する見通しです。
当レポートでは、世界のグリーンアンモニアの市場を調査し、市場概要、市場成長への各種影響因子の分析、技術動向、法規制環境、市場規模の推移・予測、各種区分・地域/主要国別の内訳、競合環境、主要企業のプロファイルなどをまとめています。
目次
第1章 調査の枠組み
第2章 エグゼクティブサマリー
第3章 世界のグリーンアンモニア市場の洞察
- 産業バリューチェーン分析
- DROC分析
- 促進要因
- 抑制要因
- 機会
- 課題
- 技術の進歩/最近の開発
- 規制の枠組み
- ポーターのファイブフォース分析
第4章 世界のグリーンアンモニア市場:概要
- 市場規模・予測
- 市場シェア・予測
- 技術別
- アルカリ水電解 (AWE)
- プロトン交換膜 (PEM)
- 固体酸化物電気分解 (SOE)
- エンドユーザー別
- 輸送
- 発電
- 工業原料
- その他
- 地域別
- 北米
- 欧州
- アジア太平洋
- ラテンアメリカ
- 中東・アフリカ
- 技術別
第5章 北米のグリーンアンモニア市場
- 市場規模・予測
- 市場シェア・予測
- 技術別
- エンドユーザー別
- 国別
第6章 欧州のグリーンアンモニア市場
- 市場規模・予測
- 市場シェア・予測
- 技術別
- エンドユーザー別
- 国別
第7章 アジア太平洋のグリーンアンモニア市場
- 市場規模・予測
- 市場シェア・予測
- 技術別
- エンドユーザー別
- 国別
第8章 ラテンアメリカのグリーンアンモニア市場
- 市場規模・予測
- 市場シェア・予測
- 技術別
- エンドユーザー別
- 国別
第9章 中東・アフリカのグリーンアンモニア市場
- 市場規模・予測
- 市場シェア・予測
- 技術別
- エンドユーザー別
- 国別
第10章 競合情勢
- 主要企業・製品リスト
- 市場シェア分析
- 競合ベンチマーキング:経営パラメーター別
- 主要な戦略的展開 (M&A・提携など)
第11章 COVID-19:世界のグリーンアンモニア市場への影響
第12章 企業プロファイル (企業概要・財務マトリックス・競合情勢・主要人材・主な競合相手・連絡先・戦略的展望)
- Siemens
- NEL Hydrogen
- ITM Power
- McPhy Energy
- ThyssenKrupp AG
- CF Industries Holdings, Inc
- BASF SE
- Yara International ASA
- Maire Tecnimont S.p.A.
- ACME Group
- Fertiglobe plc
- ITM Power
- Holder Topsoe
- Green Hydrogen Systems
- Greenfield Nitrogen LLC
- Air Products Inc.
- Aker Clean Hydrogen
- AquaHydrex
- Ballance Agri-Nutrients
- HY2GEN AG
- Other Prominent Players
第13章 主な戦略的提言
第14章 調査手法
List of Figures
- Figure 1 Global Green Ammonia Market Segmentation
- Figure 2 Global Green Ammonia Market Value Chain Analysis
- Figure 3 Company Market Share Analysis, 2021
- Figure 4 Global Green Ammonia Market Size, By Value (USD Million), 2019-2029
- Figure 5 Global Green Ammonia Market Share, By Technology, By Value, 2019-2029
- Figure 6 Global Green Ammonia Market Share, By End User, By Value, 2019-2029
- Figure 7 Global Green Ammonia Market Share, By Region, By Value, 2019-2029
- Figure 8 North America Green Ammonia Market Size, By Value (USD Million), 2019-2029
- Figure 9 North America Green Ammonia Market Share, By Technology, By Value, 2019-2029
- Figure 10 North America Green Ammonia Market Share, By End User, By Value, 2019-2029
- Figure 11 North America Green Ammonia Market Share, By Country, By Value, 2019-2029
- Figure 12 US Green Ammonia Market Size, By Value (USD Million), 2019-2029
- Figure 13 US Green Ammonia Market Share, By Technology, By Value, 2019-2029
- Figure 14 US Green Ammonia Market Share, By End User, By Value, 2019-2029
- Figure 15 Canada Green Ammonia Market Size, By Value (USD Million), 2019-2029
- Figure 16 Canada Green Ammonia Market Share, By Technology, By Value, 2019-2029
- Figure 17 Canada Green Ammonia Market Share, By End User, By Value, 2019-2029
- Figure 18 Europe Green Ammonia Market Size, By Value (USD Million), 2019-2029
- Figure 19 Europe Green Ammonia Market Share, By Technology, By Value, 2019-2029
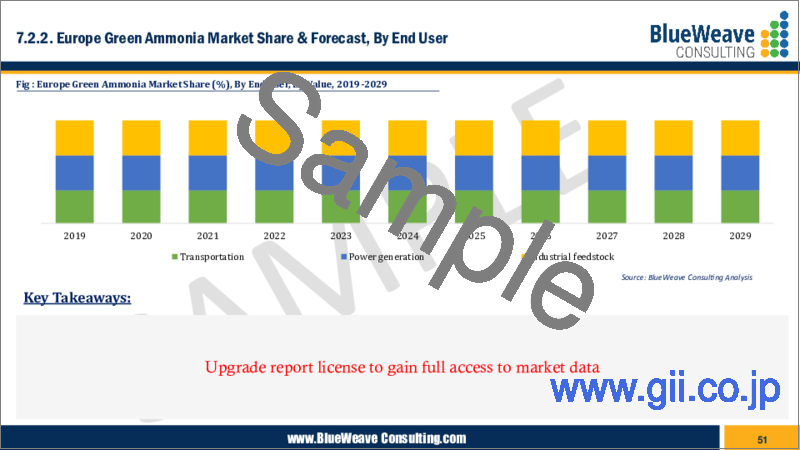
- Figure 20 Europe Green Ammonia Market Share, By End User, By Value, 2019-2029
- Figure 21 Europe Green Ammonia Market Share, By Country, By Value, 2019-2029
- Figure 22 Germany Green Ammonia Market Size, By Value (USD Million), 2019-2029
- Figure 23 Germany Green Ammonia Market Share, By Technology, By Value, 2019-2029
- Figure 24 Germany Green Ammonia Market Share, By End User, By Value, 2019-2029
- Figure 25 UK Green Ammonia Market Size, By Value (USD Million), 2019-2029
- Figure 26 UK Green Ammonia Market Share, By Technology, By Value, 2019-2029
- Figure 27 UK Green Ammonia Market Share, By End User, By Value, 2019-2029
- Figure 28 Italy Green Ammonia Market Size, By Value (USD Million), 2019-2029
- Figure 29 Italy Green Ammonia Market Share, By Technology, By Value, 2019-2029
- Figure 30 Italy Green Ammonia Market Share, By End User, By Value, 2019-2029
- Figure 31 France Green Ammonia Market Size, By Value (USD Million), 2019-2029
- Figure 32 France Green Ammonia Market Share, By Technology, By Value, 2019-2029
- Figure 33 France Green Ammonia Market Share, By End User, By Value, 2019-2029
- Figure 34 Spain Green Ammonia Market Size, By Value (USD Million), 2019-2029
- Figure 35 Spain Green Ammonia Market Share, By Technology, By Value, 2019-2029
- Figure 36 Spain Green Ammonia Market Share, By End User, By Value, 2019-2029
- Figure 37 The Netherlands Green Ammonia Market Size, By Value (USD Million), 2019-2029
- Figure 38 The Netherlands Green Ammonia Market Share, By Technology, By Value, 2019-2029
- Figure 39 The Netherlands Green Ammonia Market Share, By End User, By Value, 2019-2029
- Figure 40 Belgium Green Ammonia Market Size, By Value (USD Million), 2019-2029
- Figure 41 Belgium Green Ammonia Market Share, By Technology, By Value, 2019-2029
- Figure 42 Belgium Green Ammonia Market Share, By End User, By Value, 2019-2029
- Figure 43 NORDIC Countries Green Ammonia Market Size, By Value (USD Million), 2019-2029
- Figure 44 NORDIC Countries Green Ammonia Market Share, By Technology, By Value, 2019-2029
- Figure 45 NORDIC Countries Green Ammonia Market Share, By End User, By Value, 2019-2029
- Figure 46 Rest of Europe Green Ammonia Market Size, By Value (USD Million), 2019-2029
- Figure 47 Rest of Europe Green Ammonia Market Share, By Technology, By Value, 2019-2029
- Figure 48 Rest of Europe Green Ammonia Market Share, By End User, By Value, 2019-2029
- Figure 49 Asia-Pacific Green Ammonia Market Size, By Value (USD Million), 2019-2029
- Figure 50 Asia-Pacific Green Ammonia Market Share, By Technology, By Value, 2019-2029
- Figure 51 Asia-Pacific Green Ammonia Market Share, By End User, By Value, 2019-2029
- Figure 52 Asia-Pacific Green Ammonia Market Share, By Country, By Value, 2019-2029
- Figure 53 China Green Ammonia Market Size, By Value (USD Million), 2019-2029
- Figure 54 China Green Ammonia Market Share, By Technology, By Value, 2019-2029
- Figure 55 China Green Ammonia Market Share, By End User, By Value, 2019-2029
- Figure 56 India Green Ammonia Market Size, By Value (USD Million), 2019-2029
- Figure 57 India Green Ammonia Market Share, By Technology, By Value, 2019-2029
- Figure 58 India Green Ammonia Market Share, By End User, By Value, 2019-2029
- Figure 59 Japan Green Ammonia Market Size, By Value (USD Million), 2019-2029
- Figure 60 Japan Green Ammonia Market Share, By Technology, By Value, 2019-2029
- Figure 61 Japan Green Ammonia Market Share, By End User, By Value, 2019-2029
- Figure 62 South Korea Green Ammonia Market Size, By Value (USD Million), 2019-2029
- Figure 63 South Korea Green Ammonia Market Share, By Technology, By Value, 2019-2029
- Figure 64 South Korea Green Ammonia Market Share, By End User, By Value, 2019-2029
- Figure 65 Australia & New Zealand Green Ammonia Market Size, By Value (USD Million), 2019-2029
- Figure 66 Australia & New Zealand Green Ammonia Market Share, By Technology, By Value, 2019-2029
- Figure 67 Australia & New Zealand Green Ammonia Market Share, By End User, By Value, 2019-2029
- Figure 68 Indonesia Green Ammonia Market Size, By Value (USD Million), 2019-2029
- Figure 69 Indonesia Green Ammonia Market Share, By Technology, By Value, 2019-2029
- Figure 70 Indonesia Green Ammonia Market Share, By End User, By Value, 2019-2029
- Figure 71 Malaysia Green Ammonia Market Size, By Value (USD Million), 2019-2029
- Figure 72 Malaysia Green Ammonia Market Share, By Technology, By Value, 2019-2029
- Figure 73 Malaysia Green Ammonia Market Share, By End User, By Value, 2019-2029
- Figure 74 Singapore Green Ammonia Market Size, By Value (USD Million), 2019-2029
- Figure 75 Singapore Green Ammonia Market Share, By Technology, By Value, 2019-2029
- Figure 76 Singapore Green Ammonia Market Share, By End User, By Value, 2019-2029
- Figure 77 Philippines Green Ammonia Market Size, By Value (USD Million), 2019-2029
- Figure 78 Philippines Green Ammonia Market Share, By Technology, By Value, 2019-2029
- Figure 79 Philippines Green Ammonia Market Share, By End User, By Value, 2019-2029
- Figure 80 Vietnam Green Ammonia Market Size, By Value (USD Million), 2019-2029
- Figure 81 Vietnam Green Ammonia Market Share, By Technology, By Value, 2019-2029
- Figure 82 Vietnam Green Ammonia Market Share, By End User, By Value, 2019-2029
- Figure 83 Rest of APAC Green Ammonia Market Size, By Value (USD Million), 2019-2029
- Figure 84 Rest of APAC Green Ammonia Market Share, By Technology, By Value, 2019-2029
- Figure 85 Rest of APAC Green Ammonia Market Share, By End User, By Value, 2019-2029
- Figure 86 Latin America Green Ammonia Market Size, By Value (USD Million), 2019-2029
- Figure 87 Latin America Green Ammonia Market Share, By Technology, By Value, 2019-2029
- Figure 88 Latin America Green Ammonia Market Share, By End User, By Value, 2019-2029
- Figure 89 Latin America Green Ammonia Market Share, By Country, By Value, 2019-2029
- Figure 90 Brazil Green Ammonia Market Size, By Value (USD Million), 2019-2029
- Figure 91 Brazil Green Ammonia Market Share, By Technology, By Value, 2019-2029
- Figure 92 Brazil Green Ammonia Market Share, By End User, By Value, 2019-2029
- Figure 93 Mexico Green Ammonia Market Size, By Value (USD Million), 2019-2029
- Figure 94 Mexico Green Ammonia Market Share, By Technology, By Value, 2019-2029
- Figure 95 Mexico Green Ammonia Market Share, By End User, By Value, 2019-2029
- Figure 96 Argentina Green Ammonia Market Size, By Value (USD Million), 2019-2029
- Figure 97 Argentina Green Ammonia Market Share, By Technology, By Value, 2019-2029
- Figure 98 Argentina Green Ammonia Market Share, By End User, By Value, 2019-2029
- Figure 99 Peru Green Ammonia Market Size, By Value (USD Million), 2019-2029
- Figure 100 Peru Green Ammonia Market Share, By Technology, By Value, 2019-2029
- Figure 101 Peru Green Ammonia Market Share, By End User, By Value, 2019-2029
- Figure 102 Colombia Green Ammonia Market Size, By Value (USD Million), 2019-2029
- Figure 103 Colombia Green Ammonia Market Share, By Technology, By Value, 2019-2029
- Figure 104 Colombia Green Ammonia Market Share, By End User, By Value, 2019-2029
- Figure 105 Rest of LATAM Green Ammonia Market Size, By Value (USD Million), 2019-2029
- Figure 106 Rest of LATAM Green Ammonia Market Share, By Technology, By Value, 2019-2029
- Figure 107 Rest of LATAM Green Ammonia Market Share, By End User, By Value, 2019-2029
- Figure 108 Middle East & Africa Green Ammonia Market Size, By Value (USD Million), 2019-2029
- Figure 109 Middle East & Africa Green Ammonia Market Share, By Technology, By Value, 2019-2029
- Figure 110 Middle East & Africa Green Ammonia Market Share, By End User, By Value, 2019-2029
- Figure 111 Middle East & Africa Green Ammonia Market Share, By Country, By Value, 2019-2029
- Figure 112 Saudi Arabia Green Ammonia Market Size, By Value (USD Million), 2019-2029
- Figure 113 Saudi Arabia Green Ammonia Market Share, By Technology, By Value, 2019-2029
- Figure 114 Saudi Arabia Green Ammonia Market Share, By End User, By Value, 2019-2029
- Figure 115 UAE Green Ammonia Market Size, By Value (USD Million), 2019-2029
- Figure 116 UAE Green Ammonia Market Share, By Technology, By Value, 2019-2029
- Figure 117 UAE Green Ammonia Market Share, By End User, By Value, 2019-2029
- Figure 118 Qatar Green Ammonia Market Size, By Value (USD Million), 2019-2029
- Figure 119 Qatar Green Ammonia Market Share, By Technology, By Value, 2019-2029
- Figure 120 Qatar Green Ammonia Market Share, By End User, By Value, 2019-2029
- Figure 121 Kuwait Green Ammonia Market Size, By Value (USD Million), 2019-2029
- Figure 122 Kuwait Green Ammonia Market Share, By Technology, By Value, 2019-2029
- Figure 123 Kuwait Green Ammonia Market Share, By End User, By Value, 2019-2029
- Figure 124 Iran Green Ammonia Market Size, By Value (USD Million), 2019-2029
- Figure 125 Iran Green Ammonia Market Share, By Technology, By Value, 2019-2029
- Figure 126 Iran Green Ammonia Market Share, By End User, By Value, 2019-2029
- Figure 127 South Africa Green Ammonia Market Size, By Value (USD Million), 2019-2029
- Figure 128 South Africa Green Ammonia Market Share, By Technology, By Value, 2019-2029
- Figure 129 South Africa Green Ammonia Market Share, By End User, By Value, 2019-2029
- Figure 130 Nigeria Green Ammonia Market Size, By Value (USD Million), 2019-2029
- Figure 131 Nigeria Green Ammonia Market Share, By Technology, By Value, 2019-2029
- Figure 132 Nigeria Green Ammonia Market Share, By End User, By Value, 2019-2029
- Figure 133 Kenya Green Ammonia Market Size, By Value (USD Million), 2019-2029
- Figure 134 Kenya Green Ammonia Market Share, By Technology, By Value, 2019-2029
- Figure 135 Kenya Green Ammonia Market Share, By End User, By Value, 2019-2029
- Figure 136 Egypt Green Ammonia Market Size, By Value (USD Million), 2019-2029
- Figure 137 Egypt Green Ammonia Market Share, By Technology, By Value, 2019-2029
- Figure 138 Egypt Green Ammonia Market Share, By End User, By Value, 2019-2029
- Figure 139 Morocco Green Ammonia Market Size, By Value (USD Million), 2019-2029
- Figure 140 Morocco Green Ammonia Market Share, By Technology, By Value, 2019-2029
- Figure 141 Morocco Green Ammonia Market Share, By End User, By Value, 2019-2029
- Figure 142 Algeria Green Ammonia Market Size, By Value (USD Million), 2019-2029
- Figure 143 Algeria Green Ammonia Market Share, By Technology, By Value, 2019-2029
- Figure 144 Algeria Green Ammonia Market Share, By End User, By Value, 2019-2029
- Figure 145 Rest of Middle East & Africa Green Ammonia Market Size, By Value (USD Million), 2019-2029
- Figure 146 Rest of Middle East & Africa Green Ammonia Market Share, By Technology, By Value, 2019-2029
- Figure 147 Rest of Middle East & Africa Green Ammonia Market Share, By End User, By Value, 2019-2029
List of Tables
- Table 1 Global Green Ammonia Market Size, By Technology, By Value, 2019-2029
- Table 2 Global Green Ammonia Market Size, By End User, By Value, 2019-2029
- Table 3 Global Green Ammonia Market Size, By Region, By Value, 2019-2029
- Table 4 North America Green Ammonia Market Size, By Value (USD Million), 2019-2029
- Table 5 North America Green Ammonia Market Size, By Technology, By Value, 2019-2029
- Table 6 North America Green Ammonia Market Size, By End User, By Value, 2019-2029
- Table 7 North America Green Ammonia Market Size, By Country, By Value, 2019-2029
- Table 8 US Green Ammonia Market Size, By Value (USD Million), 2019-2029
- Table 9 US Green Ammonia Market Size, By Technology, By Value, 2019-2029
- Table 10 US Green Ammonia Market Size, By End User, By Value, 2019-2029
- Table 11 Canada Green Ammonia Market Size, By Value (USD Million), 2019-2029
- Table 12 Canada Green Ammonia Market Size, By Technology, By Value, 2019-2029
- Table 13 Canada Green Ammonia Market Size, By End User, By Value, 2019-2029
- Table 14 Europe Green Ammonia Market Size, By Value (USD Million), 2019-2029
- Table 15 Europe Green Ammonia Market Size, By Technology, By Value, 2019-2029
- Table 16 Europe Green Ammonia Market Size, By End User, By Value, 2019-2029
- Table 17 Europe Green Ammonia Market Size, By Country, By Value, 2019-2029
- Table 18 Germany Green Ammonia Market Size, By Value (USD Million), 2019-2029
- Table 19 Germany Green Ammonia Market Size, By Technology, By Value, 2019-2029
- Table 20 Germany Green Ammonia Market Size, By End User, By Value, 2019-2029
- Table 21 UK Green Ammonia Market Size, By Value (USD Million), 2019-2029
- Table 22 UK Green Ammonia Market Size, By Technology, By Value, 2019-2029
- Table 23 UK Green Ammonia Market Size, By End User, By Value, 2019-2029
- Table 24 Italy Green Ammonia Market Size, By Value (USD Million), 2019-2029
- Table 25 Italy Green Ammonia Market Size, By Technology, By Value, 2019-2029
- Table 26 Italy Green Ammonia Market Size, By End User, By Value, 2019-2029
- Table 27 France Green Ammonia Market Size, By Value (USD Million), 2019-2029
- Table 28 France Green Ammonia Market Size, By Technology, By Value, 2019-2029
- Table 29 France Green Ammonia Market Size, By End User, By Value, 2019-2029
- Table 30 Spain Green Ammonia Market Size, By Value (USD Million), 2019-2029
- Table 31 Spain Green Ammonia Market Size, By Technology, By Value, 2019-2029
- Table 32 Spain Green Ammonia Market Size, By End User, By Value, 2019-2029
- Table 33 The Netherlands Green Ammonia Market Size, By Value (USD Million), 2019-2029
- Table 34 The Netherlands Green Ammonia Market Size, By Technology, By Value, 2019-2029
- Table 35 The Netherlands Green Ammonia Market Size, By End User, By Value, 2019-2029
- Table 36 Belgium Green Ammonia Market Size, By Value (USD Million), 2019-2029
- Table 37 Belgium Green Ammonia Market Size, By Technology, By Value, 2019-2029
- Table 38 Belgium Green Ammonia Market Size, By End User, By Value, 2019-2029
- Table 39 NORDIC Countries Green Ammonia Market Size, By Value (USD Million), 2019-2029
- Table 40 NORDIC Countries Green Ammonia Market Size, By Technology, By Value, 2019-2029
- Table 41 NORDIC Countries Green Ammonia Market Size, By End User, By Value, 2019-2029
- Table 42 Rest of Europe Green Ammonia Market Size, By Value (USD Million), 2019-2029
- Table 43 Rest of Europe Green Ammonia Market Size, By Technology, By Value, 2019-2029
- Table 44 Rest of Europe Green Ammonia Market Size, By End User, By Value, 2019-2029
- Table 45 Asia-Pacific Green Ammonia Market Size, By Value (USD Million), 2019-2029
- Table 46 Asia-Pacific Green Ammonia Market Size, By Technology, By Value, 2019-2029
- Table 47 Asia-Pacific Green Ammonia Market Size, By End User, By Value, 2019-2029
- Table 48 Asia-Pacific Green Ammonia Market Size, By Country, By Value, 2019-2029
- Table 49 China Green Ammonia Market Size, By Value (USD Million), 2019-2029
- Table 50 China Green Ammonia Market Size, By Technology, By Value, 2019-2029
- Table 51 China Green Ammonia Market Size, By End User, By Value, 2019-2029
- Table 52 India Green Ammonia Market Size, By Value (USD Million), 2019-2029
- Table 53 India Green Ammonia Market Size, By Technology, By Value, 2019-2029
- Table 54 India Green Ammonia Market Size, By End User, By Value, 2019-2029
- Table 55 Japan Green Ammonia Market Size, By Value (USD Million), 2019-2029
- Table 56 Japan Green Ammonia Market Size, By Technology, By Value, 2019-2029
- Table 57 Japan Green Ammonia Market Size, By End User, By Value, 2019-2029
- Table 58 South Korea Green Ammonia Market Size, By Value (USD Million), 2019-2029
- Table 59 South Korea Green Ammonia Market Size, By Technology, By Value, 2019-2029
- Table 60 South Korea Green Ammonia Market Size, By End User, By Value, 2019-2029
- Table 61 Australia & New Zealand Green Ammonia Market Size, By Value (USD Million), 2019-2029
- Table 62 Australia & New Zealand Green Ammonia Market Size, By Technology, By Value, 2019-2029
- Table 63 Australia & New Zealand Green Ammonia Market Size, By End User, By Value, 2019-2029
- Table 64 Indonesia Green Ammonia Market Size, By Value (USD Million), 2019-2029
- Table 65 Indonesia Green Ammonia Market Size, By Technology, By Value, 2019-2029
- Table 66 Indonesia Green Ammonia Market Size, By End User, By Value, 2019-2029
- Table 67 Malaysia Green Ammonia Market Size, By Value (USD Million), 2019-2029
- Table 68 Malaysia Green Ammonia Market Size, By Technology, By Value, 2019-2029
- Table 69 Malaysia Green Ammonia Market Size, By End User, By Value, 2019-2029
- Table 70 Singapore Green Ammonia Market Size, By Value (USD Million), 2019-2029
- Table 71 Singapore Green Ammonia Market Size, By Technology, By Value, 2019-2029
- Table 72 Singapore Green Ammonia Market Size, By End User, By Value, 2019-2029
- Table 73 Philippines Green Ammonia Market Size, By Value (USD Million), 2019-2029
- Table 74 Philippines Green Ammonia Market Size, By Technology, By Value, 2019-2029
- Table 75 Philippines Green Ammonia Market Size, By End User, By Value, 2019-2029
- Table 76 Vietnam Green Ammonia Market Size, By Value (USD Million), 2019-2029
- Table 77 Vietnam Green Ammonia Market Size, By Technology, By Value, 2019-2029
- Table 78 Vietnam Green Ammonia Market Size, By End User, By Value, 2019-2029
- Table 79 Rest of APAC Green Ammonia Market Size, By Value (USD Million), 2019-2029
- Table 80 Rest of APAC Green Ammonia Market Size, By Technology, By Value, 2019-2029
- Table 81 Rest of APAC Green Ammonia Market Size, By End User, By Value, 2019-2029
- Table 82 Latin America Green Ammonia Market Size, By Value (USD Million), 2019-2029
- Table 83 Latin America Green Ammonia Market Size, By Technology, By Value, 2019-2029
- Table 84 Latin America Green Ammonia Market Size, By End User, By Value, 2019-2029
- Table 85 Latin America Green Ammonia Market Size, By Country, By Value, 2019-2029
- Table 86 Brazil Green Ammonia Market Size, By Value (USD Million), 2019-2029
- Table 87 Brazil Green Ammonia Market Size, By Technology, By Value, 2019-2029
- Table 88 Brazil Green Ammonia Market Size, By End User, By Value, 2019-2029
- Table 89 Mexico Green Ammonia Market Size, By Value (USD Million), 2019-2029
- Table 90 Mexico Green Ammonia Market Size, By Technology, By Value, 2019-2029
- Table 91 Mexico Green Ammonia Market Size, By End User, By Value, 2019-2029
- Table 92 Argentina Green Ammonia Market Size, By Value (USD Million), 2019-2029
- Table 93 Argentina Green Ammonia Market Size, By Technology, By Value, 2019-2029
- Table 94 Argentina Green Ammonia Market Size, By End User, By Value, 2019-2029
- Table 95 Peru Green Ammonia Market Size, By Value (USD Million), 2019-2029
- Table 96 Peru Green Ammonia Market Size, By Technology, By Value, 2019-2029
- Table 97 Peru Green Ammonia Market Size, By End User, By Value, 2019-2029
- Table 98 Colombia Green Ammonia Market Size, By Value (USD Million), 2019-2029
- Table 99 Colombia Green Ammonia Market Size, By Technology, By Value, 2019-2029
- Table 100 Colombia Green Ammonia Market Size, By End User, By Value, 2019-2029
- Table 101 Rest of LATAM Green Ammonia Market Size, By Value (USD Million), 2019-2029
- Table 102 Rest of LATAM Green Ammonia Market Size, By Technology, By Value, 2019-2029
- Table 103 Rest of LATAM Green Ammonia Market Size, By End User, By Value, 2019-2029
- Table 104 Middle East & Africa Green Ammonia Market Size, By Value (USD Million), 2019-2029
- Table 105 Middle East & Africa Green Ammonia Market Size, By Technology, By Value, 2019-2029
- Table 106 Middle East & Africa Green Ammonia Market Size, By End User, By Value, 2019-2029
- Table 107 Middle East & Africa Green Ammonia Market Size, By Country, By Value, 2019-2029
- Table 108 Saudi Arabia Green Ammonia Market Size, By Value (USD Million), 2019-2029
- Table 109 Saudi Arabia Green Ammonia Market Size, By Technology, By Value, 2019-2029
- Table 110 Saudi Arabia Green Ammonia Market Size, By End User, By Value, 2019-2029
- Table 111 UAE Green Ammonia Market Size, By Value (USD Million), 2019-2029
- Table 112 UAE Green Ammonia Market Size, By Technology, By Value, 2019-2029
- Table 113 UAE Green Ammonia Market Size, By End User, By Value, 2019-2029
- Table 114 Qatar Green Ammonia Market Size, By Value (USD Million), 2019-2029
- Table 115 Qatar Green Ammonia Market Size, By Technology, By Value, 2019-2029
- Table 116 Qatar Green Ammonia Market Size, By End User, By Value, 2019-2029
- Table 117 Kuwait Green Ammonia Market Size, By Value (USD Million), 2019-2029
- Table 118 Kuwait Green Ammonia Market Size, By Technology, By Value, 2019-2029
- Table 119 Kuwait Green Ammonia Market Size, By End User, By Value, 2019-2029
- Table 120 Iran Green Ammonia Market Size, By Value (USD Million), 2019-2029
- Table 121 Iran Green Ammonia Market Size, By Technology, By Value, 2019-2029
- Table 122 Iran Green Ammonia Market Size, By End User, By Value, 2019-2029
- Table 123 South Africa Green Ammonia Market Size, By Value (USD Million), 2019-2029
- Table 124 South Africa Green Ammonia Market Size, By Technology, By Value, 2019-2029
- Table 125 South Africa Green Ammonia Market Size, By End User, By Value, 2019-2029
- Table 126 Nigeria Green Ammonia Market Size, By Value (USD Million), 2019-2029
- Table 127 Nigeria Green Ammonia Market Size, By Technology, By Value, 2019-2029
- Table 128 Nigeria Green Ammonia Market Size, By End User, By Value, 2019-2029
- Table 129 Kenya Green Ammonia Market Size, By Value (USD Million), 2019-2029
- Table 130 Kenya Green Ammonia Market Size, By Technology, By Value, 2019-2029
- Table 131 Kenya Green Ammonia Market Size, By End User, By Value, 2019-2029
- Table 132 Egypt Green Ammonia Market Size, By Value (USD Million), 2019-2029
- Table 133 Egypt Green Ammonia Market Size, By Technology, By Value, 2019-2029
- Table 134 Egypt Green Ammonia Market Size, By End User, By Value, 2019-2029
- Table 135 Morocco Green Ammonia Market Size, By Value (USD Million), 2019-2029
- Table 136 Morocco Green Ammonia Market Size, By Technology, By Value, 2019-2029
- Table 137 Morocco Green Ammonia Market Size, By End User, By Value, 2019-2029
- Table 138 Algeria Green Ammonia Market Size, By Value (USD Million), 2019-2029
- Table 139 Algeria Green Ammonia Market Size, By Technology, By Value, 2019-2029
- Table 140 Algeria Green Ammonia Market Size, By End User, By Value, 2019-2029
- Table 141 Rest of Middle East & Africa Green Ammonia Market Size, By Value (USD Million), 2019-2029
- Table 142 Rest of Middle East & Africa Green Ammonia Market Size, By Technology, By Value, 2019-2029
- Table 143 Rest of Middle East & Africa Green Ammonia Market Size, By End User, By Value, 2019-2029
- Table 144 Siemens Company Overview
- Table 145 Siemens Financial Overview
- Table 146 NEL Hydrogen Company Overview
- Table 147 NEL Hydrogen Financial Overview
- Table 148 ITM Power Company Overview
- Table 149 ITM Power Financial Overview
- Table 150 McPhy Energy Company Overview
- Table 151 McPhy Energy Financial Overview
- Table 152 ThyssenKrupp AG Company Overview
- Table 153 ThyssenKrupp AG Financial Overview
- Table 154 CF Industries Holdings, Inc Company Overview
- Table 155 CF Industries Holdings, Inc Financial Overview
- Table 156 BASF SE Company Overview
- Table 157 BASF SE Financial Overview
- Table 158 Yara International ASA Company Overview
- Table 159 Yara International ASA Financial Overview
- Table 160 Maire Tecnimont S.p.A. Company Overview
- Table 161 Maire Tecnimont S.p.A. Financial Overview
- Table 162 ACME Group Company Overview
- Table 163 ACME Group Financial Overview
- Table 164 Fertiglobe plc Company Overview
- Table 165 Fertiglobe plc Financial Overview
- Table 166 ITM Power Company Overview
- Table 167 NITM Power Financial Overview
- Table 168 ITM Power Company Overview
- Table 169 ITM Power Financial Overview
- Table 170 Holder Topsoe Company Overview
- Table 171 Holder Topsoe Financial Overview
- Table 172 Green Hydrogen Systems Company Overview
- Table 173 Green Hydrogen Systems Financial Overview
- Table 174 Greenfield Nitrogen LLC Company Overview
- Table 175 Greenfield Nitrogen LLC Financial Overview
- Table 176 Air Products Inc. Company Overview
- Table 177 Air Products Inc. Financial Overview
- Table 178 Aker Clean Hydrogen Company Overview
- Table 179 Aker Clean Hydrogen Financial Overview
- Table 180 AquaHydrex Company Overview
- Table 181 AquaHydrex Financial Overview
- Table 182 Ballance Agri-Nutrients Company Overview
- Table 183 Ballance Agri-Nutrients Financial Overview
- Table 184 HY2GEN AG Company Overview
- Table 185 HY2GEN AG Financial Overview
Global Green Ammonia Market Size Zooming to Touch USD 4 Billion by 2029
Global green ammonia market size is flourishing owing to a spurring demand from power generation and marine transportation industries for green ammonia produced from sustainable sources.
BlueWeave Consulting, a leading strategic consulting and market research firm, in its recent study, estimates global green ammonia market size at USD 54.38 million in 2022. During the forecast period between 2023 and 2029, BlueWeave expects global green ammonia market size to grow at a robust CAGR of 85.3% reaching a value of USD 3,962.80 million by 2029. Demand for green ammonia is expected to rise in the coming years as people become more aware of the importance of creating clean energy and lowering carbon footprints. It is also expected that market growth will be fueled shortly by rising demand for the product as marine fuel and shipping in the transportation sector because it emits no carbon and leaves no sulfur traces, resulting in better air quality. Green ammonia is formed when nitrogen from the air and hydrogen from water combine. It is a heat and power fuel that can be used in gas turbines, internal combustion engines, generator sets, industrial furnaces, and fuel cells. It is particularly useful for maritime transportation.
Global Green Ammonia Market - Overview
Nitrogen is drawn from the air, and hydrogen is drawn from water electrolysis to produce green ammonia. Renewable energy sources like wind, solar, and hydroelectric generators are used during the production process. Green ammonia has uses in the marine industry, energy storage, and agriculture. It is also intended to be used in the manufacturing of fertilizer products that are carbon-neutral and in the decarbonization of the food value chain. Ammonia storage companies that are already in operation are working to find ways to produce ammonia from renewable sources while improving energy efficiency and reducing capital and operating costs. The number of green hydrogen projects and the expansion of the hydrogen-based economy are the main factors driving the market demand for green ammonia. Additionally, the market is growing because of rising demand for green ammonia in the agriculture and power sectors.
The second-most widely produced chemical in the world, ammonia is primarily used as a fertilizer in the agricultural industry. Additionally, it is discovered that green ammonia has the potential to be used in a variety of applications in addition to its current primary use in the fertilizer industry with growing technological advancements and developments. When used as a fuel, ammonia has the advantage of emitting no carbon dioxide, and its environmental credentials can be further enhanced if it is produced using renewable energy. It has become extremely popular in the transportation sector as a shipping and marine fuel because it emits no carbon and contains no traces of sulfur, which lowers particulate emissions and improves air quality while ensuring compliance with IMO 2020 and other environmental regulations.
Opportunity: Growing Interest in Eco-Friendly Fertilizers Drives Green Ammonia Market Sales
The widespread use of chemical fertilizers and pesticides has significantly reduced soil quality worldwide. Organic fertilizer demand is rapidly rising in response to the growing demand for sustainable agricultural practices that reduce risk and carbon emissions. This is compelling major agrochemical producers to switch to green and sustainable products such as green ammonia. As a result, increased demand for green fertilizers to reduce environmental risks and pollution is expected to drive up green ammonia sales over the forecast period.
Challenge: lack of knowledge of green ammonia
The development of green ammonia technology is still in its infancy. The synthesis method, photochemistry synthesizing, and biochemical cycling are techniques for producing ammonia with water and nitrogen quickly. These procedures, however, face significant technological obstacles that call for labor and R&D expenses. Today, many ammonia producers still produce ammonia using traditional techniques. The biggest issue with green ammonia is that chemical manufacturers don't fully comprehend it.
Impact of COVID-19 on Global Green Ammonia Market
The COVID-19 pandemic affected almost all industries, including green ammonia. Governments of various nations imposed nationwide lockdowns to halt the disease's spread. As a result, there were restrictions on both people and goods moving around. Many companies were forced to delay or abandon the construction of green ammonia manufacturing facilities due to a lack of labor and raw materials. Delays in the construction of manufacturing facilities harmed the market conditions for green ammonia.
Global Green Ammonia Market - By End User
Transportation, power generation, industrial feedstock, and other segments make up the global green ammonia market by end user. The transportation segment dominated the market. The global fuel and energy crisis has boosted the demand for green fuel. Conventional sources are being replaced by renewable ones, including green ammonia and others. These sources produce fuel that is efficient, clean, and safe for the environment. Globally, issues like carbon emissions and environmental pollution become increasingly popular concerns. These problems are causing the demand for green products, such as green ammonia, to gain popularity in the transportation sector. The product is liquid at room temperature and takes up little space in storage. Compared to other types of fuel, green ammonia is feasible.
Competitive Landscape
Global green ammonia market is fiercely competitive. Prominent players in global green ammonia market include Siemens, NEL Hydrogen, ITM Power, McPhy Energy, ThyssenKrupp AG, CF Industries Holdings, Inc, BASF SE, Yara International ASA, Maire Tecnimont S.p.A., ACME Group, Fertiglobe plc, ITM Power, Holder Topsoe, Green Hydrogen Systems, Greenfield Nitrogen LLC, Air Products Inc., Aker Clean Hydrogen, AquaHydrex, Ballance Agri-Nutrients, and HY2GEN AG. These companies use various strategies, including increasing investments in their R&D activities, mergers, and acquisitions, joint ventures, collaborations, licensing agreements, and new product and service releases to further strengthen their position in global green ammonia market.
The in-depth analysis of the report provides information about growth potential, upcoming trends, and statistics of Global Green Ammonia Market. It also highlights the factors driving forecasts of total market size. The report promises to provide recent technology trends in Global Green Ammonia Market and industry insights to help decision-makers make sound strategic decisions. Furthermore, the report also analyzes the growth drivers, challenges, and competitive dynamics of the market.
Table of Contents
1. Research Framework
- 1.1. Research Objective
- 1.2. Product Overview
- 1.3. Market Segmentation
2. Executive Summary
3. Global Green Ammonia Market Insights
- 3.1. Industry Value Chain Analysis
- 3.2. DROC Analysis
- 3.2.1. Growth Drivers
- 3.2.1.1. Responsibility to reduce greenhouse emissions
- 3.2.1.2. Increasing stringent emissions regulations
- 3.2.1.3. Rising focus on zero-carbon energy goals
- 3.2.2. Restraints
- 3.2.2.1. Requirements of high initial capital
- 3.2.3. Opportunities
- 3.2.3.1. Technology advancements
- 3.2.3.2. Increasing private & public investments
- 3.2.4. Challenges
- 3.2.4.1. Lack of awareness about green ammonia
- 3.2.4.2. Limited knowledge about green ammonia's production technology
- 3.2.1. Growth Drivers
- 3.3. Product Advancements/Recent Developments
- 3.4. Regulatory Framework
- 3.5. Porter's Five Forces Analysis
- 3.5.1. Bargaining Power of Suppliers
- 3.5.2. Bargaining Power of Buyers
- 3.5.3. Threat of New Entrants
- 3.5.4. Threat of Substitutes
- 3.5.5. Intensity of Rivalry
4. Global Green Ammonia Market Overview
- 4.1. Market Size & Forecast, 2019-2029
- 4.1.1. By Value (USD Million)
- 4.2. Market Share & Forecast
- 4.2.1. By Technology
- 4.2.1.1. Alkaline Water Electrolysis (AWE)
- 4.2.1.2. Proton Exchange Membrane (PEM)
- 4.2.1.3. Solid Oxide Electrolysis (SOE)
- 4.2.2. By End User
- 4.2.2.1. Transportation
- 4.2.2.2. Power Generation
- 4.2.2.3. Industrial Feedstock
- 4.2.2.4. Others
- 4.2.3. By Region
- 4.2.3.1. North America
- 4.2.3.2. Europe
- 4.2.3.3. Asia Pacific
- 4.2.3.4. Latin America
- 4.2.3.5. Middle East and Africa
- 4.2.1. By Technology
5. North America Green Ammonia Market
- 5.1.1. Market Size & Forecast, 2019-2029
- 5.1.2. By Value (USD Billion)
- 5.2. Market Share & Forecast
- 5.2.1. By Technology
- 5.2.2. By End User
- 5.2.3. By Country
- 5.2.3.1. US
- 5.2.3.1.1. By Technology
- 5.2.3.1.2. By End User
- 5.2.3.2. Canada
- 5.2.3.2.1. By Technology
- 5.2.3.2.2. By End User
6. Europe Green Ammonia Market
- 6.1. Market Size & Forecast, 2019-2029
- 6.1.1. By Value (USD Billion)
- 6.2. Market Share & Forecast
- 6.2.1. By Technology
- 6.2.2. By End User
- 6.2.3. By Country
- 6.2.3.1. Germany
- 6.2.3.1.1. By Technology
- 6.2.3.1.2. By End User
- 6.2.3.2. UK
- 6.2.3.2.1. By Technology
- 6.2.3.2.2. By End User
- 6.2.3.3. Italy
- 6.2.3.3.1. By Technology
- 6.2.3.3.2. By End User
- 6.2.3.4. France
- 6.2.3.4.1. By Technology
- 6.2.3.4.2. By End User
- 6.2.3.5. Spain
- 6.2.3.5.1. By Technology
- 6.2.3.5.2. By End User
- 6.2.3.6. The Netherlands
- 6.2.3.6.1. By Technology
- 6.2.3.6.2. By End User
- 6.2.3.6.3.
- 6.2.3.7. Belgium
- 6.2.3.7.1. By Technology
- 6.2.3.7.2. By End User
- 6.2.3.8. NORDIC Countries
- 6.2.3.8.1. By Technology
- 6.2.3.8.2. By End User
- 6.2.3.9. Rest of Europe
- 6.2.3.9.1. By Technology
- 6.2.3.9.2. By End User
7. Asia-Pacific Green Ammonia Market
- 7.1. Market Size & Forecast, 2019-2029
- 7.1.1. By Value (USD Billion)
- 7.2. Market Share & Forecast
- 7.2.1. By Technology
- 7.2.2. By End User
- 7.2.3. el
- 7.2.4. By Country
- 7.2.4.1. China
- 7.2.4.1.1. By Technology
- 7.2.4.1.2. By End User
- 7.2.4.2. India
- 7.2.4.2.1. By Technology
- 7.2.4.2.2. By End User
- 7.2.4.3. Japan
- 7.2.4.3.1. By Technology
- 7.2.4.3.2. By End User
- 7.2.4.4. South Korea
- 7.2.4.4.1. By Technology
- 7.2.4.4.2. By End User
- 7.2.4.5. Australia & New Zealand
- 7.2.4.5.1. By Technology
- 7.2.4.5.2. By End User
- 7.2.4.6. Indonesia
- 7.2.4.6.1. By Technology
- 7.2.4.6.2. By End User
- 7.2.4.7. Malaysia
- 7.2.4.7.1. By Technology
- 7.2.4.7.2. By End User
- 7.2.4.8. Singapore
- 7.2.4.8.1. By Technology
- 7.2.4.8.2. By End User
- 7.2.4.8.3.
- 7.2.4.9. Philippines
- 7.2.4.9.1. By Technology
- 7.2.4.9.2. By End User
- 7.2.4.10. Vietnam
- 7.2.4.10.1. By Technology
- 7.2.4.10.2. By End User
- 7.2.4.11. Rest of Asia Pacific
- 7.2.4.11.1. By Technology
- 7.2.4.11.2. By End User
8. Latin America Green Ammonia Market
- 8.1. Market Size & Forecast, 2019-2029
- 8.1.1. By Value (USD Billion)
- 8.2. Market Share & Forecast
- 8.2.1. By Technology
- 8.2.2. By End User
- 8.2.3. By Country
- 8.2.3.1. Brazil
- 8.2.3.1.1. By Technology
- 8.2.3.1.2. By End User
- 8.2.3.2. Mexico
- 8.2.3.2.1. By Technology
- 8.2.3.2.2. By End User
- 8.2.3.3. Argentina
- 8.2.3.3.1. By Technology
- 8.2.3.3.2. By End User
- 8.2.3.4. Peru
- 8.2.3.4.1. By Technology
- 8.2.3.4.2. By End User
- 8.2.3.5. Colombia
- 8.2.3.5.1. By Technology
- 8.2.3.5.2. By End User
- 8.2.3.6. Rest of Latin America
- 8.2.3.6.1. By Technology
- 8.2.3.6.2. By End User
- 8.2.3.6.3.
9. Middle East & Africa Green Ammonia Market
- 9.1. Market Size & Forecast, 2019-2029
- 9.1.1. By Value (USD Billion)
- 9.2. Market Share & Forecast
- 9.2.1. By Technology
- 9.2.2. By End User
- 9.2.3. By Country
- 9.2.3.1. Saudi Arabia
- 9.2.3.1.1. By Technology
- 9.2.3.1.2. By End User
- 9.2.3.2. UAE
- 9.2.3.2.1. By Technology
- 9.2.3.2.2. By End User
- 9.2.3.3. Qatar
- 9.2.3.3.1. By Technology
- 9.2.3.3.2. By End User
- 9.2.3.4. Kuwait
- 9.2.3.4.1. By Technology
- 9.2.3.4.2. By End User
- 9.2.3.5. Iran
- 9.2.3.5.1. By Technology
- 9.2.3.5.2. By End User
- 9.2.3.6. South Africa
- 9.2.3.6.1. By Technology
- 9.2.3.6.2. By End User
- 9.2.3.7. Nigeria
- 9.2.3.7.1. By Technology
- 9.2.3.7.2. By Distribution Channel
- 9.2.3.8. Kenya
- 9.2.3.8.1. By Technology
- 9.2.3.8.2. By End User
- 9.2.3.9. Egypt
- 9.2.3.9.1. By Technology
- 9.2.3.9.2. By End User
- 9.2.3.10. Morocco
- 9.2.3.10.1. By Technology
- 9.2.3.10.2. By End User
- 9.2.3.11. Algeria
- 9.2.3.11.1. By Technology
- 9.2.3.11.2. By End User
- 9.2.3.12. Rest of Middle East & Africa
- 9.2.3.12.1. By Technology
- 9.2.3.12.2. By End User
10. Competitive Landscape
- 10.1. List of Key Players and Their Offerings
- 10.2. Global Green Ammonia Company Market Share Analysis, 2021
- 10.3. Competitive Benchmarking, By Operating Parameters
- 10.4. Key Strategic Developments (Mergers, Acquisitions, Partnerships, and others)
11. Impact of Covid-19 on Global Green Ammonia Market
12. Company Profile (Company Overview, Financial Matrix, Competitive Landscape, Key Personnel, Key Competitors, Contact Address, Strategic Outlook, SWOT Analysis)
- 12.1. Siemens
- 12.2. NEL Hydrogen
- 12.3. ITM Power
- 12.4. McPhy Energy
- 12.5. ThyssenKrupp AG
- 12.6. CF Industries Holdings, Inc
- 12.7. BASF SE
- 12.8. Yara International ASA
- 12.9. Maire Tecnimont S.p.A.
- 12.10. ACME Group
- 12.11. Fertiglobe plc
- 12.12. ITM Power
- 12.13. Holder Topsoe
- 12.14. Green Hydrogen Systems
- 12.15. Greenfield Nitrogen LLC
- 12.16. Air Products Inc.
- 12.17. Aker Clean Hydrogen
- 12.18. AquaHydrex
- 12.19. Ballance Agri-Nutrients
- 12.20. HY2GEN AG
- 12.21. Other Prominent Players
13. Key Strategic Recommendations
14. Research Methodology
- 14.1. Qualitative Research
- 14.1.1. Primary & Secondary Research
- 14.2. Quantitative Research
- 14.3. Market Breakdown & Data Triangulation
- 14.3.1. Secondary Research
- 14.3.2. Primary Research
- 14.4. Breakdown of Primary Research Respondents, By Region
- 14.5. Assumptions & Limitations
*Financial information in case of non-listed companies can be provided as per availability.
**The segmentation and the companies are subject to modifications based on in-depth secondary research for the final deliverable.