|
|
市場調査レポート
商品コード
1072734
血液・血漿成分の世界市場 (2021-2031年):製品・用途・エンドユーザー・地域別Blood and Plasma Components Market - A Global and Regional Analysis: Focus on Product, Application, End User and Region - Analysis and Forecast, 2021-2031 |
||||||
|
|
|||||||
|
● お客様のご希望に応じて、既存データの加工や未掲載情報(例:国別セグメント)の追加などの対応が可能です。 詳細はお問い合わせください。 |
|||||||


| 血液・血漿成分の世界市場 (2021-2031年):製品・用途・エンドユーザー・地域別 |
|
出版日: 2022年05月04日
発行: BIS Research
ページ情報: 英文 228 Pages
納期: 1~5営業日
|
- 全表示
- 概要
- 図表
- 目次
世界の血液・血漿成分の市場規模は、2020年の395億8,000万米ドルから、予測期間中は4.90%のCAGRで推移し、2031年には664億7,000万米ドルの規模に成長すると予測されています。
血友病A、フォンウィルブランド病(vWD)、二次性免疫不全症などの原発性免疫不全症による負担の増加により、成長が見込まれています。また、癌、血液悪性腫瘍、臓器移植の負担増も市場の成長に寄与しています。さらに、慢性炎症性脱髄性多発ニューロパチー(CIDP)などの神経疾患の治療における血漿成分の使用に関するR&Dの増加も市場の成長を促進しています。
当レポートでは、世界の血液・血漿成分の市場を調査し、市場概要、市場への各種影響因子の分析、法規制環境、市場規模の推移・予測、各種区分・地域/主要国別の内訳、競合環境、市場シェア、主要企業のプロファイルなどをまとめています。
目次
第1章 市場
- 製品定義
- 市場範囲
- 調査手法
- 市場概要
- 血液成分の使用における過去の動向
- 血液成分の使用
- 市場のフットプリント・将来の可能性
第2章 産業分析
- 概要
- 規制の枠組み
- サプライチェーン分析
- 世界の血液・血漿成分市場に対するCOVID-19の影響
第3章 市場力学
- 概要
- 影響分析
- 市場促進要因
- 市場抑制要因
- 市場機会
第4章 競合情勢
- 概要
- 企業戦略
- 事業戦略
- 企業の市場シェア分析
- 成長シェア分析
第5章 製品
- 概要
- 輸血
- 濃厚赤血球
- 血小板製品
- 凍結血漿
- 血漿由来製品
- 免疫グロブリン
- 凝固因子濃縮物
- アルブミン
- プロテイナーゼ阻害剤
- その他の血液派生物
第6章 用途
- 概要
- 血液疾患
- 異常ヘモグロビン症
- 血液悪性腫瘍管理
- 凝固障害
- 固形腫瘍管理
- その他
- 新たな応用分野
第7章 エンドユーザー
- 概要
- 病院および専門クリニック
- 研究機関
- 診断ラボ
- その他
第8章 地域
- 概要
- 北米
- 欧州
- アジア太平洋
- その他の地域
第9章 市場:競合ベンチマーキング・企業プロファイル
- 概要
- CSL Limited
- Grifols, S.A.
- ADMA Biologics, Inc.
- Takeda Pharmaceutical Company Limited
- GC Pharma
- Octapharma AG
- Kedrion S.p.A
- Emergent BioSolutions Inc.
- Bio Products Laboratory Ltd.
- LFB S.A.
- American red Cross
- Versiti, Inc.
- Blood Centers of America
- Carter BloodCare
- Memorial Blood Centers
List of Figures
- Figure 1: Global Blood and Plasma Components Market, $Billion, 2020 and 2031
- Figure 2: Impact Analysis of Market Drivers and Market Restraints on the Global Blood and Plasma Components Market
- Figure 3: Global Blood and Plasma Components Market Segmentation
- Figure 4: Global Blood and Plasma Components Market (by Product), 2020 and 2031
- Figure 5: Global Blood and Plasma Components Market (by Application), 2020 and 2031
- Figure 6: Global Blood and Plasma Components Market (by End User), 2020 and 2031
- Figure 7: Global Blood and Plasma Components Services Market Snapshot (by Region)
- Figure 8: Global Blood and Plasma Components Market: Segmentation
- Figure 9: Global Blood and Plasma Components Market: Methodology
- Figure 10: Primary Research Methodology
- Figure 11: Bottom-Up Approach (Segment-Wise Analysis)
- Figure 12: Top-Down Approach (Segment-Wise Analysis)
- Figure 13: Global Blood and Plasma Components Market, $Billion, 2020-2031
- Figure 14: Workflow of Biologics License Application (BLA) Process
- Figure 15: China's Regulatory Institutions under NMPA
- Figure 16: Workflow of Drug Approval Process in Japan
- Figure 17: Schematic Representation of Blood Supply Chain
- Figure 18: Blood and Blood Components Storage Requirements
- Figure 19: Global Blood and Plasma Components Market: COVID-19 Impact Analysis
- Figure 20: Number of Patients with Bleeding Disorders, 2016-2020
- Figure 21: Comparison of Manufacturing Process of Plasma-Derived Medicinal Products and Traditional Pharmaceutical Products
- Figure 22: Share of Key Developments, January 2018-January 2022
- Figure 23: Share of Mergers and Acquisitions (by Company), January 2018-January 2022
- Figure 24: Share of Synergistic Activities (by Company), January 2018-January2022
- Figure 25: Share of Business Expansion, Funding, and Reimbursement Activities (by Company), January 2018-January 2022
- Figure 26: Share of Product Launches (by Company), January 2018-January 2022
- Figure 27: Share of Product Approvals (by Company), January 2018-January 2022
- Figure 28: Market Share Analysis of Global Blood and Plasma Components Market, by Company (2019 and 2020)
- Figure 29: Growth-Share Analysis for Global Blood and Plasma Components Market (by Company), 2020
- Figure 30: Global Blood and Plasma Components Market Segmentation (by Product)
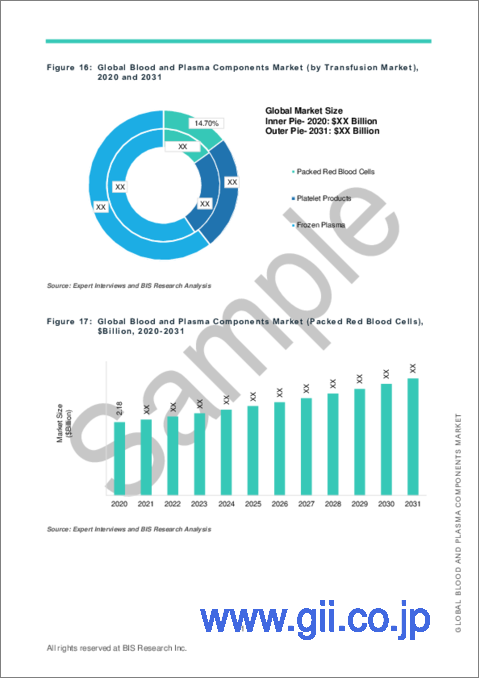
- Figure 31: Global Blood and Plasma Components Market (by Transfusion Market), $Billion, 2020-2031
- Figure 32: Global Blood and Plasma Components Market (by Transfusion Market), 2020 and 2031
- Figure 33: Global Blood and Plasma Components Market (Packed Red Blood Cells), $Billion, 2020-2031
- Figure 34: Global Blood and Plasma Components Market (Platelet Products), $Billion, 2020-2031
- Figure 35: Components of Plasma
- Figure 36: Global Blood and Plasma Components Market (Frozen Plasma), $Billion, 2020-2031
- Figure 37: Global Blood and Plasma Components Market (by Plasma-Derived Products, $Billion, 2020-2031
- Figure 38: Global Blood and Plasma Components Market (by Plasma-Derived Products), 2020 and 2031
- Figure 39: Global Blood and Plasma Components Market (Immunoglobulins), $Billion, 2020-2031
- Figure 40: Global Blood and Plasma Components Market (by Immunoglobulins), 2020 and 2031
- Figure 41: Global Blood and Plasma Components Market (Intravenous Immunoglobulins), $Billion, 2020-2031
- Figure 42: Global Blood and Plasma Components Market (Subcutaneous Immunoglobulins), $Billion, 2020-2031
- Figure 43: Global Blood and Plasma Components Market (Other Immunoglobulins), $Billion, 2020-2031
- Figure 44: Coagulation Factor Concentrates Market Segmentation
- Figure 45: Global Blood and Plasma Components Market (by Coagulation Factor Concentrates), $Billion, 2020-2031
- Figure 46: Global Blood and Plasma Components Market (by Coagulation Factor Concentrates), 2020 and 2031
- Figure 47: Global Blood and Plasma Components Market (Coagulation Factor VIII Concentrate), $Billion, 2020-2031
- Figure 48: Global Blood and Plasma Components Market (Coagulation Factor IX Concentrate), $Billion, 2020-2031
- Figure 49: Global Blood and Plasma Components Market (von Willebrand Factor), $Billion, 2020-2031
- Figure 50: Global Blood and Plasma Components Market (Prothrombin Complex Concentrates), $Billion, 2020-2031
- Figure 51: Global Blood and Plasma Components Market (Coagulation Factor XIII Concentrate), $Billion, 2020-2031
- Figure 52: Global Blood and Plasma Components Market (Albumins), $Billion, 2020-2031
- Figure 53: Global Blood and Plasma Components Market (Proteinase Inhibitors), $Billion, 2020-2031
- Figure 54: Global Blood and Plasma Components Market (Other Blood Derivatives), $Billion, 2020-2031
- Figure 55: Global Blood and Plasma Components Market Segmentation (by Application)
- Figure 56: Global Blood and Plasma Components Market (by Application), 2020 and 2031
- Figure 57: Global Blood and Plasma Components Market (by Hematology), $Billion, 2020-2031
- Figure 58: Global Blood and Plasma Components Market (by Hemoglobinopathy), $Billion, 2020-2031
- Figure 59: Types of Thalassemia
- Figure 60: Global Blood and Plasma Components Market (Thalassemia), $Billion, 2020-2031
- Figure 61: Common Types of Sickle Cell Disease (SCD)
- Figure 62: Global Blood and Plasma Components Market (Sickle Cell Disease), $Billion, 2020-2031
- Figure 63: Global Blood and Plasma Components Market (Platelet Refractoriness), $Billion, 2020-2031
- Figure 64: Global Blood and Plasma Components Market (Hematologic Malignancies Management), $Billion, 2020-2031
- Figure 65: Global Blood and Plasma Components Market (by Coagulopathy), $Billion, 2020-2031
- Figure 66: Types of Hemophilia
- Figure 67: Global Blood and Plasma Components Market (Hemophilia), $Billion, 2020-2031
- Figure 68: Types of Von Willebrand's Disease (vWD)
- Figure 69: Global Blood and Plasma Components Market (von Willebrand Disease), $Billion, 2020-2031
- Figure 70: Classification of Thrombosis
- Figure 71: Global Blood and Plasma Components Market (Thrombosis), $Billion, 2020-2031
- Figure 72: Different Causes of Thrombocytopenia
- Figure 73: Global Blood and Plasma Components Market (Thrombocytopenia), $Billion, 2020-2031
- Figure 74: Global Blood and Plasma Components Market (Solid Tumor Management), $Billion, 2020-2031
- Figure 75: Global Blood and Plasma Components Market (Others), $Billion, 2020-2031
- Figure 76: Global Blood and Plasma Components Market Segmentation (by End User)
- Figure 77: Global Blood and Plasma Components Market (by End User), 2020 and 2031
- Figure 78: Global Blood and Plasma Components Market (Hospitals and Specialty Clinics), $Billion, 2020-2031
- Figure 79: Global Blood and Plasma Components Market (Research Institutions), $Billion, 2020-2031
- Figure 80: Global Blood and Plasma Components Market (Diagnostics Laboratories), $Billion, 2020-2031
- Figure 81: Global Blood and Plasma Components Market (Other End Users), $Billion, 2021-2031
- Figure 82: Global Blood and Plasma Components Services Market Snapshot (by Region)
- Figure 83: Global Blood and Plasma Components Market (by Region), 2020 and 2031
- Figure 84: North America Blood and Plasma Components Market, $Billion, 2020-2031
- Figure 85: U.S. Blood and Plasma Components Market, $Billion, 2020-2031
- Figure 86: Canada Blood and Plasma Components Market, $Billion, 2020-2031
- Figure 87: Europe Blood and Plasma Components Market, $Billion, 2020-2031
- Figure 88: Germany Blood and Plasma Components Market, $Billion, 2020-2031
- Figure 89: U.K. Blood and Plasma Components Market, $Billion, 2020-2031
- Figure 90: France Blood and Plasma Components Market, $Billion, 2020-2031
- Figure 91: Italy Blood and Plasma Components Market, $Billion, 2020-2031
- Figure 92: Spain Blood and Plasma Components Market, $Billion, 2020-2031
- Figure 93: Rest-of-Europe Blood and Plasma Components Market, $Billion, 2020-2031
- Figure 94: Asia-Pacific Blood and Plasma Components Market, $Billion, 2020-2031
- Figure 95: China Blood and Plasma Components Market, $Billion, 2020-2031
- Figure 96: India Blood and Plasma Components Market, $Billion, 2020-2031
- Figure 97: Japan Blood and Plasma Components Market, $Billion, 2020-2031
- Figure 98: Australia Blood and Plasma Components Market, $Billion, 2020-2031
- Figure 99: South Korea Blood and Plasma Components Market, $Billion, 2020-2031
- Figure 100: Singapore Blood and Plasma Components Market, $Billion, 2020-2031
- Figure 101: Rest-of-Asia-Pacific Blood and Plasma Components Market, $Billion, 2020-2031
- Figure 102: Rest-of-the-World Blood and Plasma Components Market, $Billion, 2020-2031
- Figure 103: Total Number of Companies Profiled
- Figure 104: Global Blood and Plasma Components Market, Company Profile Overview
- Figure 105: CSL Limited: Product Portfolio
- Figure 106: CSL Limited: Overall Financials, $Million, 2018-2020
- Figure 107: CSL Limited: Revenue (by Segment), $Million, 2018-2020
- Figure 108: CSL Limited: Revenue (by Region), $Million, 2018-2020
- Figure 109: CSL Limited: R&D Expenditure, $Million, 2018-2020
- Figure 110: CSL Limited: SWOT Analysis
- Figure 111: Grifols, S.A.: Product Portfolio
- Figure 112: Grifols, S.A.: Overall Financials, $Million, 2018-2020
- Figure 113: Grifols, S.A.: Revenue (by Segment), $Million, 2018-2020
- Figure 114: Grifols, S.A.: Revenue (by Region), $Million, 2018-2020
- Figure 115: Grifols, S.A.: R&D Expenditure, $Million, 2018-2020
- Figure 116: Grifols, S.A.: SWOT Analysis
- Figure 117: ADMA Biologics, Inc.: Product Portfolio
- Figure 118: ADMA Biologics, Inc.: Overall Financials, $Million, 2018-2020
- Figure 119: ADMA Biologics, Inc.: Revenue (by Segment), $Million, 2018-2020
- Figure 120: ADMA Biologics, Inc.: R&D Expenditure, $Million, 2018-2020
- Figure 121: ADMA Biologics, Inc.: SWOT Analysis
- Figure 122: Takeda Pharmaceutical Company Limited: Product Portfolio
- Figure 123: Takeda Pharmaceutical Company Limited: Overall Financials, $Million, 2018-2020
- Figure 124: Takeda Pharmaceutical Company Limited: Revenue (by Region), $Million, 2018-2020
- Figure 125: Takeda Pharmaceutical Company Limited: R&D Expenditure, $Million, 2018-2020
- Figure 126: Takeda Pharmaceutical Company Limited: SWOT Analysis
- Figure 127: GC Pharma: Product Portfolio
- Figure 128: GC Pharma: SWOT Analysis
- Figure 129: Octapharma AG: Product Portfolio
- Figure 130: Octapharma AG: Overall Financials, $Million, 2018-2020
- Figure 131: Octapharma AG: R&D Expenditure, $Million, 2018-2020
- Figure 132: Octapharma AG: SWOT Analysis
- Figure 133: Product Portfolio
- Figure 134: Kedrion S.p.A: Overall Financials, $Million, 2018-2020
- Figure 135: Kedrion S.p.A: Revenue (by Region), $Million, 2018-2020
- Figure 136: Kedrion S.p.A: R&D Expenditure, $Million, 2018-2020
- Figure 137: Kedrion S.p.A.: SWOT Analysis
- Figure 138: Emergent BioSolutions Inc.: Product Portfolio
- Figure 139: Emergent BioSolutions Inc.: Overall Financials, $Million, 2018-2020
- Figure 140: Emergent BioSolutions Inc.: Revenue (by Segment), $Million, 2018-2020
- Figure 141: Emergent BioSolutions Inc.: Revenue (by Region), $Million, 2018-2020
- Figure 142: Emergent BioSolutions Inc.: R&D Expenditure, $Million, 2018-2020
- Figure 143: Emergent BioSolutions Inc.: SWOT Analysis
- Figure 144: Bio Products Laboratory Ltd.: Product Portfolio
- Figure 145: Bio Products Laboratory Ltd.: SWOT Analysis
- Figure 146: LFB S.A.: Product Portfolio
- Figure 147: LFB S.A.: SWOT Analysis
- Figure 148: American Red Cross: Product Portfolio
- Figure 149: American Red Cross: Overall Financials, $Million, 2018-2020
- Figure 150: American Red Cross: SWOT Analysis
- Figure 151: Versiti, Inc.: Product Portfolio
- Figure 152: Versiti, Inc.: SWOT Analysis
- Figure 153: Blood Centers of America: Product Portfolio
- Figure 154: Blood Centers of America: SWOT Analysis
- Figure 155: Carter BloodCare: Product Portfolio
- Figure 156: Carter BloodCare: SWOT Analysis
- Figure 157: Memorial Blood Centers: Product Portfolio
- Figure 158: Memorial Blood Centers: SWOT Analysis
List of Tables
- Table 1: Differences between Neutrophils, Eosinophils, and Basophils
- Table 2: Major Events in the Use of Blood and Plasma Components
- Table 3: Likert Scale
- Table 4: Impact Analysis of Market Drivers
- Table 5: Impact Analysis of Market Restraints
- Table 6: List of Acute Adverse Reactions and Delayed Adverse Reactions
- Table 7: List of Companies Offering Intravenous Immunoglobulins (IVIGs)
- Table 8: List of Companies Offering Subcutaneous Immunoglobulins (SCIGs)
- Table 9: List of Companies Offering Intramuscular Immunoglobulins (IMIG)
- Table 10: List of Companies Offering Coagulation Factor VIII Concentrate
- Table 11: List of Companies Offering Coagulation Factor IX Concentrate
- Table 12: List of Companies Offering von Willebrand Factor
- Table 13: List of Key Competitors of CSL Limited
- Table 14: List of Key Competitors of Grifols, S.A.
- Table 15: List of Key Competitors of ADMA Biologics, Inc.
- Table 16: List of Key Competitors of Takeda Pharmaceutical Company Limited
- Table 17: List of Key Competitors of GC Pharma
- Table 18: List of Key Competitors of Octapharma AG
- Table 19: List of Key Competitors of Kedrion S.p.A
- Table 20: List of Key Competitors of Emergent BioSolutions Inc.
- Table 21: List of Key Competitors of Bio Products Laboratory Ltd.
- Table 22: List of Key Competitors of LFB S.A.
- Table 23: List of Key Competitors of American Red Cross
- Table 24: List of Key Competitors of Versiti, Inc.
- Table 25: List of Key Customers of Blood Centers of America
- Table 26: List of Key Competitors of Blood Centers of America
- Table 27: List of Key Competitors of Carter BloodCare
- Table 28: List of Key Competitors of Memorial Blood Centers
“Global Blood and Plasma Components Market to Reach $66.47 Billion by 2031.”
Market Report Coverage - Blood and Plasma Components
Market Segmentation
- Product - Transfusion Products and Plasma-Derived Products
- Application - Hemtology, Solid Tumor Management, and Others
- End User - Hospitals and Specialty Clinics, Research Institutions, Diagnostics Laboratories, and Other End Users
Regional Segmentation
- North America - U.S. and Canada
- Europe - Germany, U.K., France, Italy, Spain, and Rest-of-Europe
- Asia-Pacific - China, Japan, India, Australia, South Korea, Singapore, and Rest-of-Asia-Pacific
- Rest-of-the-World
Market Growth Drivers
- Global Increase in Patients with Blood Disorders
- Increase in Trauma Patients and Chronic Illnesses
- Rise in Number of Product Launches and Approval
Market Challenges
- Risk of Transfusion Transmitted Infectious Diseases and Adverse Reaction Associated with Blood Transfusion
- Long Duration of Manufacturing Process and Strict Regulatory Guidelines
Market Opportunities
- Increase in Adoption of Business Expansion Strategies in the Market
Key Companies Profiled
CSL Limited, Grifols, S.A., ADMA Biologics, Inc., Takeda Pharmaceutical Company Limited, GC Pharma, Octapharma AG, Kedrion S.p.A, Emergent BioSolutions Inc., Bio Products Laboratory Ltd., LFB S.A., American Red Cross, Versiti, Inc., Blood Centers of America, Carter BloodCare, Memorial Blood Centers.
Key Questions Answered in this Report:
- How are blood and plasma components revolutionizing the hematology and solid tumor management landscape?
- What are the major market drivers, challenges, and opportunities in the global blood and plasma components market?
- What are the underlying structures resulting in the emerging trends within the global blood and plasma components market?
- How did the COVID-19 pandemic impact the global blood and plasma components ecosystem?
- What are the key development strategies that are being implemented by major players in order to sustain themselves in the competitive market?
- What are the key regulatory implications in developed and developing regions pertaining to the use of blood and plasma components?
- What are the potential entry barriers that are expected to be faced by the companies willing to enter a particular region in the market?
- What will be the growth rate of the global blood and plasma components market during the forecast period?
- How is each segment of the market expected to grow during the forecast period 2021-2031, and what revenue is anticipated to be generated by each of the segments? Following are the segments:
- Product (Transfusion Market and Plasma-Derived Products)
- Application (Hematology, Solid Tumor Management, and Others)
- End Users (Hospitals and Specialty Clinics, Research Institutions, Diagnostics Laboratories, and Other End Users)
- Region (North America, Europe, Asia-Pacific, and Rest-of-the-World)
- What are the growth opportunities for the blood and plasma components companies in the region of their operation?
- Who are the leading players with significant offerings in the global blood and plasma components market?
- Which companies are anticipated to be highly disruptive in the future, and why?
Market Overview
The global blood and plasma components market is expected to witness minimal growth, attributing to the rising burden of primary immunodeficiency diseases such as hemophilia A, von Willebrand disease (vWD), and secondary immunodeficiency diseases. Further, the increasing burden of cancer, hematologic malignancies, and organ transplantation is also contributing to the growth of the market. An increase in research and development into the use of plasma components for the treatment of neurological disorders such as chronic inflammatory demyelinating polyneuropathy (CIDP) is also promoting the growth of the market. Moreover, initiatives taken by the major players in the global blood and plasma components market to expand and launch more blood and plasma collection centers across the world in order to fulfill the supply of blood and plasma components are the major factors that are expected to fuel the growth of the market. The market size in 2020 was $39.58 billion and is expected to reach $66.47 billion in 2031, growing at a CAGR of 4.90% over the forecast period 2021-2031.
Competitive Landscape
The global blood and plasma components market comprises well-established companies as well as a few newly emerging companies. Several companies in the global blood and plasma components market are attempting to expand their presence in the market by undertaking business expansion activities such as launching new blood and plasma collection centers at new locations. Moreover, the companies are constantly working on research and development to expand the indications of already present plasma-derived products in the market. The key market players of the global blood and plasma components market witnessed majorly business expansion, product approvals, and synergistic activities in the market over the period January 2018-January 2022. The inclination of companies toward product approvals, synergistic activities, and business expansion activities suggests that companies are constantly working to explore the potential of blood and plasma components for new areas of applications and offer products to fulfill the increased demand for blood and plasma components.
Table of Contents
1 Markets
- 1.1 Product Definition
- 1.1.1 Inclusion and Exclusion Criteria
- 1.2 Market Scope
- 1.2.1 Scope of the Study
- 1.2.2 Key Questions Answered in the Report
- 1.3 Research Methodology
- 1.3.1 Global Blood and Plasma Components Market: Research Methodology
- 1.3.2 Data Sources
- 1.3.2.1 Primary Data Sources
- 1.3.2.2 Secondary Data Sources
- 1.3.3 Market Estimation Model
- 1.3.4 Criteria for Company Profiling
- 1.4 Market Overview
- 1.4.1 Red Blood Cells
- 1.4.2 Platelets
- 1.4.3 Plasma
- 1.4.4 Granulocytes
- 1.5 Historical Trends in the Use of Blood Components
- 1.6 Use of Blood Components
- 1.7 Market Footprint and Future Potential, $Million, 2020-2031
2 Industry Analysis
- 2.1 Overview
- 2.2 Regulatory Framework
- 2.2.1 Regulatory Framework in the U.S.
- 2.2.2 Regulatory Framework in the European Union
- 2.2.3 Regulatory Framework in Asia-Pacific
- 2.2.3.1 China
- 2.2.3.2 Japan
- 2.3 Supply Chain Analysis
- 2.4 Impact of COVID-19 on Global Blood and Plasma Components Market
3 Market Dynamics
- 3.1 Overview
- 3.2 Impact Analysis
- 3.3 Market Drivers
- 3.3.1 Global Increase in Patients with Blood Disorders
- 3.3.2 Increase in Trauma Patients and Chronic Illnesses
- 3.3.3 Rise in number of Product Launches and Approvals
- 3.4 Market Restraints
- 3.4.1 Risk of Transfusion Transmitted Infectious Diseases and Adverse Reaction Associated with Blood Transfusion
- 3.4.2 Long Duration of Manufacturing Process and Strict Regulatory Guidelines
- 3.5 Market Opportunities
- 3.5.1 Increase in Adoption of Business Expansion Strategies in the Market
4 Competitive Landscape
- 4.1 Overview
- 4.2 Corporate Strategies
- 4.2.1 Mergers and Acquisitions
- 4.2.2 Synergistic Activities
- 4.2.3 Business Expansion, Funding, and Reimbursement Activities
- 4.3 Business Strategies
- 4.3.1 Product Launches
- 4.3.2 Product Approvals
- 4.4 Market Share Analysis, by Company (2020)
- 4.5 Growth-Share Analysis
5 Products, $Million, 2020-2031
- 5.1 Overview
- 5.2 Transfusion Market
- 5.2.1 Packed Red Blood Cells
- 5.2.2 Platelet Products
- 5.2.3 Frozen Plasma
- 5.3 Plasma-Derived Products
- 5.3.1 Immunoglobulins
- 5.3.1.1 Intravenous Immunoglobulins
- 5.3.1.2 Subcutaneous Immunoglobulins
- 5.3.1.3 Other Immunoglobulins
- 5.3.2 Coagulation Factor Concentrates
- 5.3.2.1 Coagulation Factor VIII Concentrate
- 5.3.2.2 Coagulation Factor IX Concentrate
- 5.3.2.3 von Willebrand Factor (vWF)
- 5.3.2.4 Prothrombin Complex Concentrates
- 5.3.2.5 Coagulation Factor XIII Concentrate
- 5.3.3 Albumins
- 5.3.4 Proteinase Inhibitors
- 5.3.5 Other Blood Derivatives
- 5.3.1 Immunoglobulins
6 Application, $Million, 2020-2031
- 6.1 Overview
- 6.2 Hematology
- 6.2.1 Hemoglobinopathy
- 6.2.1.1 Thalassemia
- 6.2.1.2 Sickle Cell Disease
- 6.2.1.3 Platelet Refractoriness
- 6.2.2 Hematologic Malignancies Management
- 6.2.3 Coagulopathy
- 6.2.3.1 Hemophilia
- 6.2.3.2 von Willebrand Disease
- 6.2.3.3 Thrombosis
- 6.2.3.4 Thrombocytopenia
- 6.2.1 Hemoglobinopathy
- 6.3 Solid Tumor Management
- 6.4 Others
- 6.5 Emerging Areas of Application
7 End Users, $Billion, 202020-2031
- 7.1 Overview
- 7.2 Hospitals and Specialty Clinics
- 7.3 Research Institutions
- 7.4 Diagnostic Laboratories
- 7.5 Other End Users
8 Region, $Million, 2020-2031
- 8.1 Overview
- 8.2 North America
- 8.2.1 U.S.
- 8.2.2 Canada
- 8.3 Europe
- 8.3.1 Germany
- 8.3.2 U.K.
- 8.3.3 France
- 8.3.4 Italy
- 8.3.5 Spain
- 8.3.6 Rest-of-Europe
- 8.4 Asia-Pacific
- 8.4.1 China
- 8.4.2 India
- 8.4.3 Japan
- 8.4.4 Australia
- 8.4.5 South Korea
- 8.4.6 Singapore
- 8.4.7 Rest-of-Asia-Pacific
- 8.5 Rest-of-the-World
9 Market - Competitive Benchmarking & Company Profiles
- 9.1 Overview
- 9.2 CSL Limited
- 9.2.1 Company Overview
- 9.2.2 Role of CSL Limited in the Global Blood and Plasma Components Market
- 9.2.3 Key Competitors of the Company
- 9.2.4 Financials
- 9.2.5 Key Insights About the Financial Health of the Company
- 9.2.6 Corporate Strategies
- 9.2.6.1 Business Expansion
- 9.2.7 Business Strategies
- 9.2.7.1 Product Approval
- 9.2.8 SWOT Analysis
- 9.3 Grifols, S.A.
- 9.3.1 Company Overview
- 9.3.2 Role of Grifols, S.A. in the Global Blood and Plasma Components Market
- 9.3.3 Key Competitors of the Company
- 9.3.4 Financials
- 9.3.5 Key Insights About the Financial Health of the Company
- 9.3.6 Corporate Strategies
- 9.3.6.1 Mergers and Acquisitions
- 9.3.6.2 Synergistic Activities
- 9.3.6.3 Business Expansion and Funding
- 9.3.7 Business Strategies
- 9.3.7.1 Product Launch
- 9.3.8 SWOT Analysis
- 9.4 ADMA Biologics, Inc.
- 9.4.1 Company Overview
- 9.4.2 Role of ADMA Biologics, Inc. in the Global Blood and Plasma Components Market
- 9.4.3 Key Competitors of the Company
- 9.4.4 Financials
- 9.4.5 Key Insights About the Financial Health of the Company
- 9.4.6 Corporate Strategies
- 9.4.6.1 Synergistic Activities
- 9.4.7 Business Strategies
- 9.4.7.1 Product Launches
- 9.4.7.2 Product Approvals
- 9.4.8 SWOT Analysis
- 9.5 Takeda Pharmaceutical Company Limited
- 9.5.1 Company Overview
- 9.5.2 Role of Takeda Pharmaceutical Company Limited in the Global Blood and Plasma Components Market
- 9.5.3 Key Competitors of the Company
- 9.5.4 Financials
- 9.5.5 Key Insights About the Financial Health of the Company
- 9.5.6 SWOT Analysis
- 9.6 GC Pharma
- 9.6.1 Company Overview
- 9.6.2 Role of GC Pharma in the Global Blood and Plasma Components Market
- 9.6.3 Key Competitors of the Company
- 9.6.4 Corporate Strategies
- 9.6.4.1 Synergistic Activities
- 9.6.4.2 Business Expansion
- 9.6.5 SWOT Analysis
- 9.7 Octapharma AG
- 9.7.1 Company Overview
- 9.7.2 Role of Octapharma AG in the Global Blood and Plasma Components Market
- 9.7.3 Key Competitors of the Company
- 9.7.4 Financials
- 9.7.5 Key Insights About the Financial Health of the Company
- 9.7.6 Business Strategies
- 9.7.6.1 Product Approval
- 9.7.7 SWOT Analysis
- 9.8 Kedrion S.p.A
- 9.8.1 Company Overview
- 9.8.2 Role of Kedrion S.p.A in the Global Blood and Plasma Components Market
- 9.8.3 Key Competitors of the Company
- 9.8.4 Financials
- 9.8.5 Key Insights About the Financial Health of the Company
- 9.8.6 Corporate Strategies
- 9.8.6.1 Mergers and Acquisitions
- 9.8.6.2 Synergistic Activities
- 9.8.7 Business Strategies
- 9.8.7.1 Product Approval
- 9.8.8 SWOT Analysis
- 9.9 Emergent BioSolutions Inc.
- 9.9.1 Company Overview
- 9.9.2 Role of Emergent BioSolutions Inc. in the Global Blood and Plasma Components Market
- 9.9.3 Key Competitors of the Company
- 9.9.4 Financials
- 9.9.5 Key Insights About the Financial Health of the Company
- 9.9.6 SWOT Analysis
- 9.1 Bio Products Laboratory Ltd.
- 9.10.1 Company Overview
- 9.10.2 Role of Bio Products Laboratory Ltd. in the Global Blood and Plasma Components Market
- 9.10.3 Key Competitors of the Company
- 9.10.4 Corporate Strategies
- 9.10.4.1 Synergistic Activities
- 9.10.5 Business Strategies
- 9.10.5.1 Product Launch
- 9.10.6 SWOT Analysis
- 9.11 LFB S.A.
- 9.11.1 Company Overview
- 9.11.2 Role of LFB S.A. in Global Blood and Plasma Components Market
- 9.11.3 Key Competitors of the Company
- 9.11.4 Corporate Strategies
- 9.11.4.1 Synergistic Activities
- 9.11.5 SWOT Analysis
- 9.12 American red Cross
- 9.12.1 Company Overview
- 9.12.2 Role of American Red Cross in the Global Blood and Plasma Components Market
- 9.12.3 Key Competitors of the Company
- 9.12.4 Financials
- 9.12.5 SWOT Analysis
- 9.13 Versiti, Inc.
- 9.13.1 Company Overview
- 9.13.2 Role of Versiti, Inc. in the Global Blood and Plasma Components Market
- 9.13.3 Key Competitors of the Company
- 9.13.4 SWOT Analysis
- 9.14 Blood Centers of America
- 9.14.1 Company Overview
- 9.14.2 Role of Blood Centers of America in the Global Blood and Plasma Components Market
- 9.14.3 Key Customers of the Company
- 9.14.4 Key Competitors of the Company
- 9.14.5 SWOT Analysis
- 9.15 Carter BloodCare
- 9.15.1 Company Overview
- 9.15.2 Role of Carter BloodCare in the Global Blood and Plasma Components Market
- 9.15.3 Key Competitors of the Company
- 9.15.4 SWOT Analysis
- 9.16 Memorial Blood Centers
- 9.16.1 Company Overview
- 9.16.2 Role of Memorial Blood Centers in the Global Blood and Plasma Components Market
- 9.16.3 Key Competitors of the Company
- 9.16.4 SWOT Analysis