|
|
市場調査レポート
商品コード
1071617
シングルセルRNAシーケンシングの世界市場 (2021-2031年):製品・ワークフロー・エンドユーザー・用途・サプライチェーン・国別分析Global Single Cell RNA Sequencing Market - A Global and Regional Analysis: Focus on Product, Workflow, End User and Application, Supply Chain, and Country-Wise Analysis - Analysis and Forecast, 2021-2031 |
||||||
|
|
|||||||
|
● お客様のご希望に応じて、既存データの加工や未掲載情報(例:国別セグメント)の追加などの対応が可能です。 詳細はお問い合わせください。 |
|||||||


| シングルセルRNAシーケンシングの世界市場 (2021-2031年):製品・ワークフロー・エンドユーザー・用途・サプライチェーン・国別分析 |
|
出版日: 2022年04月21日
発行: BIS Research
ページ情報: 英文 178 Pages
納期: 1~5営業日
|
- 全表示
- 概要
- 図表
- 目次
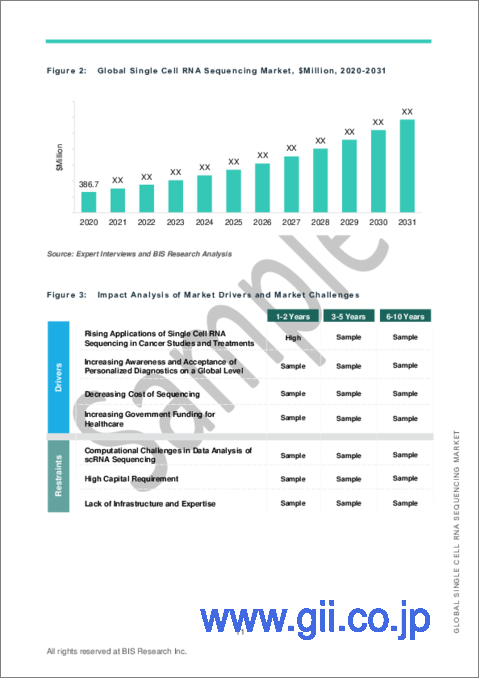
世界のシングルセルRNAシーケンシングの市場規模は、2020年の3億8,670万米ドルから、予測期間中は17.08%のCAGRで推移し、2031年には29億3,130万米ドルの規模に成長すると予測されています。
当レポートでは、世界のシングルセルRNAシーケンシングの市場を調査し、市場概要、新型コロナウイルス感染症 (COVID-19) およびその他の市場影響因子の分析、市場規模の推移・予測、各種区分・地域/主要国別の内訳、競合環境、主要企業のプロファイルなどをまとめています。
目次
第1章 製品の定義
第2章 調査範囲・調査手法
第3章 市場
- 市場概要
- COVID-19:世界のシングルセルRNAシーケンシング市場に与える影響
- シングルセルRNAシーケンシング市場のサプライチェーンに影響を与えるCOVID-19
- 研究・臨床開発・商業運転の中断
- 危機から回復のナビゲート・将来の展望
- 法的要件・規制
第4章 市場力学
- 市場促進要因
- 事業上の課題
- 事業機会
第5章 競合情勢
- 新製品
- M&A
- 相乗効果のある活動
- 事業拡大およびその他の戦略
- 企業別の市場シェア分析
第6章 世界のシングルセルRNAシーケンシング市場:提供区分別
- 消耗品
- 機器
第7章 世界のシングルセルRNAシーケンシング市場:ワークフロー別
- シングルセル分離
- レーザーキャプチャー顕微鏡 (LCM)
- フロー活性化セルソーティング (FACS)
- 磁気活性化セルソーティング (MACS)
- マイクロフルイディクス
- シングルセル増幅
- ライブラリ調整
第8章 世界のシングルセルRNAシーケンシング市場:用途別
- 腫瘍
- 免疫
- 神経
- 発生学
- その他
第9章 世界のシングルセルRNAシーケンシング市場:エンドユーザー別
- 研究機関
- バイオ製薬企業
- その他
第10章 世界のシングルセルRNAシーケンシング市場:地域別
- 北米
- 欧州
- アジア太平洋
- その他の地域
第11章 企業プロファイル
- 企業プロファイル
- 10x Genomics, Inc.
- BGI Group
- Bio-Rad Laboratories, Inc.
- Becton, Dickinson and Company(BD)
- Fluidigm Corporation
- MedGenome
- NanoString Technologies, Inc.
- Pacific Biosciences of California, Inc.
- QIAGEN N.V.
- PerkinElmer Inc.
- Takara Bio, Inc.
- Thermo Fisher Scientific Inc.
新興企業
- Biomage Ltd.
- Nucleome Informatics Pvt Ltd.
- Scailyte
- Analytical Biosciences Limited.
List of Figures
- Figure 1: Trends in Single Cell Studies, November 2019-May 2020
- Figure 2: Global Single Cell RNA Sequencing Market, $Million, 2020-2031
- Figure 3: Impact Analysis of Market Drivers and Market Challenges
- Figure 4: Share of Key Market Strategies and Developments, January 2017- January 2022
- Figure 5: Global Single Cell RNA Sequencing Market (by Region), 2020 and 2031
- Figure 6: Global Single Cell RNA Sequencing Market Segmentation
- Figure 7: Global Single Cell RNA Sequencing Market Research Methodology
- Figure 8: Primary Research
- Figure 9: Bottom-Up Approach (Segment-Wise Analysis)
- Figure 10: Development History of Single Cell Sequencing
- Figure 11: Global Single Cell RNA Sequencing Market, $Million, 2020-2031
- Figure 12: Positive and Negative Impact of COVID-19 on Single Cell RNA Sequencing Market
- Figure 13: Measure to Navigate Crisis Recovery
- Figure 14: Global Single Cell RNA Sequencing Market Dynamics
- Figure 15: Rising Number of New Cancer Cases (Comparative Analysis of the Cases in 2018 and 2020)
- Figure 16: Applications of Single Cell RNA Sequencing in Analysis of Tumour Heterogeneity
- Figure 17: Issues Addressed by Single Cell RNA Sequencing in Oncogenomics
- Figure 18: Increasing Government Spending for Healthcare, 2017
- Figure 19: Share of Key Market Strategies and Developments, January 2017- January 2022
- Figure 20: Share of New Offerings (by Company), January 2017-January 2022
- Figure 21: Share of Mergers and Acquisitions (by Company), January 2017-January 2022
- Figure 22: Share of Synergistic Activities (by Company), January 2017-January 2022
- Figure 23: Share of Business Expansion and Other Strategies (by Company), January 2017-January 2022
- Figure 24: Market Share Analysis of Global Single Cell RNA Sequencing Market (by Company), 2020 and 2021
- Figure 25: Global Single Cell RNA Sequencing (by Offerings), $Million, 2020 and 2031
- Figure 26: Global Single Cell RNA Sequencing Consumables Market, $Million, 2020-2031
- Figure 27: Global Single Cell RNA Sequencing Instruments Market, $Million, 2020-2031
- Figure 28: Global Single Cell RNA Sequencing (by Workflow), $Million, 2020 and 2031
- Figure 29: Global Single Cell RNA Sequencing Market (Single Cell Isolation), $ Million, 2020-2031
- Figure 30: Global Single Cell RNA Sequencing Laser Capture Microscopy Market, $Million, 2020-2031
- Figure 31: Global Single Cell RNA Sequencing Flow-Activated Cell Sorting Market, $ Million, 2020-2031
- Figure 32: Global Single Cell RNA Sequencing Magnetic-Activated Cell Sorting Market, $Million, 2020-2031
- Figure 33: Global Single Cell RNA Sequencing Microfluidics Market, $Million, 2020-2031
- Figure 34: Global Single Cell RNA Sequencing Market (Single Cell Amplification), $Million, 2020-2031
- Figure 35: Global Single Cell RNA Sequencing Market (Library Preparation), $Million, 2020-2031
- Figure 36: Global Single Cell RNA Sequencing (by Application), $Million, 2020 and 2031
- Figure 37: Global Single Cell RNA Sequencing Market (Oncology), $Million, 2020-2031
- Figure 38: Global Single Cell RNA Sequencing Market (Immunology), $Million, 2020-2031
- Figure 39: Global Single Cell RNA Sequencing Market (Neurology), $Million, 2020-2031
- Figure 40: Global Single Cell RNA Sequencing Market (Embryology), $Million, 2020-2031
- Figure 41: Global Single Cell RNA Sequencing Market (Others), $Million, 2020-2031
- Figure 42: Global Single Cell RNA Sequencing (by End-User Type), $Million, 2020 and 2031
- Figure 43: Global Single Cell RNA Sequencing Market (Research Organizations), $Million, 2020-2031
- Figure 44: Global Single Cell RNA Sequencing Market (Biopharmaceutical Companies), $Million, 2020-2031
- Figure 45: Global Single Cell RNA Sequencing Market (Others), $Million, 2020-2031
- Figure 46: Global Single Cell RNA Sequencing Market (by Region), $Million, 2020 and 2031
- Figure 47: North America Global Single Cell RNA Sequencing Market, $Million, 2020-2031
- Figure 48: North America: Market Dynamics
- Figure 49: U.S. Single Cell RNA Sequencing Market, $Million, 2020-2031
- Figure 50: Canada Single Cell RNA Sequencing Market, $Million, 2020-2031
- Figure 51: Europe Single Cell RNA Sequencing Market, $Million, 2020-2031
- Figure 52: Europe: Market Dynamics
- Figure 53: U.K. Single Cell RNA Sequencing Market, $Million, 2020-2031
- Figure 54: Germany Single Cell RNA Sequencing Market, $Million, 2020-2031
- Figure 55: Italy Single Cell RNA Sequencing Market, $Million, 2020-2031
- Figure 56: Spain Single Cell RNA Sequencing Market, $Million, 2020-2031
- Figure 57: France Single Cell RNA Sequencing Market, $Million, 2020-2031
- Figure 58: Rest-of-Europe Single Cell RNA Sequencing Market, $Million, 2020-2031
- Figure 59: Asia-Pacific Single Cell RNA Sequencing Market, $Million, 2020-2031
- Figure 60: Asia-Pacific: Market Dynamics
- Figure 61: Japan Single Cell RNA Sequencing Market, $Million, 2020-2031
- Figure 62: China Single Cell RNA Sequencing Market, $Million, 2020-2031
- Figure 63: India Single Cell RNA Sequencing Market, $Million, 2020-2031
- Figure 64: South Korea Single Cell RNA Sequencing Market, $Million, 2020-2031
- Figure 65: Australia Single Cell RNA Sequencing Market, $Million, 2020-2031
- Figure 66: Rest-of-Asia-Pacific Single Cell RNA Sequencing Market, $Million, 2020-2031
- Figure 67: Rest-of-the-World Single Cell RNA Sequencing Market, $Million, 2020-2031
- Figure 68: Share of Key Companies Profiled
- Figure 69: 10x Genomics, Inc.: Product Portfolio
- Figure 70: 10x Genomics, Inc.: Overall Financials, $Million, 2017-2019
- Figure 71: 10x Genomics, Inc.: Revenue (by Business Segment), $Million, 2017-2019
- Figure 72: 10x Genomics, Inc.: Revenue (by Region), $Million, 2017-2019
- Figure 73: : 10x Genomics, Inc.: R&D Expenditure, $Million, 2017-2019
- Figure 74: 10x Genomics, Inc.: SWOT Analysis
- Figure 75: BGI Group: Product Portfolio
- Figure 76: BGI Group: SWOT Analysis
- Figure 77: Bio-Rad Laboratories, Inc.: Product Portfolio
- Figure 78: Bio-Rad Laboratories, Inc.: Overall Financials, $Million, 2018-2020
- Figure 79: Bio-Rad Laboratories, Inc.: Revenue (by Business Segment), $Million, 2018-2020
- Figure 80: Bio-Rad Laboratories, Inc.: Revenue (by Region), $Million, 2018-2020
- Figure 81: Bio-Rad Laboratories, Inc.: R&D Expenditure, $Million, 2018-2020
- Figure 82: Bio-Rad Laboratories, Inc.: SWOT Analysis
- Figure 83: Becton, Dickinson and Company (BD): Product Portfolio
- Figure 84: Becton, Dickinson and Company (BD): Overall Financials, $Million, 2018-2020
- Figure 85: Becton, Dickinson and Company (BD): Revenue (by Segment), $Million, 2018-2020
- Figure 86: Becton, Dickinson and Company (BD): Revenue (by Region), $Million, 2018-2020
- Figure 87: Becton, Dickinson and Company (BD): R&D Expenditure, $Million, 2018-2020
- Figure 88: Becton, Dickinson and Company: SWOT Analysis
- Figure 89: Fluidigm Corporation: Overall Financials, $Million, 2016-2018
- Figure 90: Fluidigm Corporation: Revenue (by Business Segment), $Million, 2016-2018
- Figure 91: Fluidigm Corporation: Revenue (by Region), $Million, 2016-2018
- Figure 92: Fluidigm Corporation: R&D Expenditure, $Million, 2016-2018
- Figure 93: Fluidigm Corporation: SWOT Analysis
- Figure 94: MedGenome: Product Portfolio
- Figure 95: MedGenome: SWOT Analysis
- Figure 96: NanoString Technologies, Inc.: Overall Financials, $Million, 2016-2018
- Figure 97: NanoString Technologies, Inc.: Revenue (by Business Segment), $Million, 2016-2018
- Figure 98: NanoString Technologies, Inc.: Revenue (by Region), $Million, 2016-2018
- Figure 99: NanoString Technologies, Inc.: R&D Expenditure, $Million, 2016-2018
- Figure 100: NanoString Technologies, Inc.: R&D Expenditure (by Functional Area), $Million, 2016-2018
- Figure 101: NanoString Technologies, Inc.: SWOT Analysis
- Figure 102: Pacific Biosciences of California, Inc.: Product Portfolio
- Figure 103: Pacific Biosciences of California, Inc.: Overall Financials, $Million, 2018-2020
- Figure 104: Pacific Biosciences of California, Inc.: Revenue (by Segment), $Million, 2018-2020
- Figure 105: Pacific Biosciences of California, Inc.: Revenue (by Region), $Million, 2018-2020
- Figure 106: Pacific Biosciences of California, Inc.: R&D Expenditure, $Million, 2018-2020
- Figure 107: Pacific Biosciences of California, Inc.: SWOT Analysis
- Figure 108: QIAGEN N.V.: Product Portfolio
- Figure 109: QIAGEN N.V.: Overall Financials, $Million, 2018-2020
- Figure 110: QIAGEN N.V.: Revenue (by Segment), $Million, 2018-2020
- Figure 111: QIAGEN N.V.: Revenue (by Region), $Million, 2018-2020
- Figure 112: QIAGEN N.V.: R&D Expenditure, $Million, 2018-2020
- Figure 113: QIAGEN N.V.: SWOT Analysis
- Figure 114: PerkinElmer Inc.: Product Portfolio
- Figure 115: PerkinElmer Inc.: Overall Financials, $Million, 2018-2020
- Figure 116: PerkinElmer Inc.: Revenue (by Segment), $Million, 2018-2020
- Figure 117: PerkinElmer Inc.: Revenue (by Region), $Million, 2018-2020
- Figure 118: PerkinElmer Inc.: R&D Expenditure, $Million, 2018-2020
- Figure 119: PerkinElmer Inc.: SWOT Analysis
- Figure 120: Takara Bio Inc.: Overall Financials, $Million, 2015-2017
- Figure 121: Takara Bio, Inc.: Revenue (by Business Segment), $Million, 2015-2017
- Figure 122: Takara Bio, Inc.: Revenue (by Region), $Million, 2017
- Figure 123: Takara Bio, Inc.: R&D Expenditure, $Million, 2015-2017
- Figure 124: Takara Bio Inc.: SWOT Analysis
- Figure 125: Thermo Fisher Scientific Inc.: Product Portfolio
- Figure 126: Thermo Fisher Scientific Inc.: Overall Financials, $Million, 2018-2020
- Figure 127: Thermo Fisher Scientific Inc.: Revenue (by Business Segment), $Million, 2018-2020
- Figure 128: Thermo Fisher Scientific Inc.: Revenue (by Region), $Million, 2018-2020
- Figure 129: Thermo Fisher Scientific Inc.: R&D Expenditure, $Million, 2018-2020
- Figure 130: Thermo Fisher Scientific Inc.: SWOT Analysis
List of Tables
- Table 1: Difference between Single Cell RNA Sequencing and RNA Sequencing
- Table 2: Classification of Directive Groups IVDs
- Table 3: Declining Cost of Genome
“Global Single Cell RNA Sequencing Market to Reach $2,931.3 Million by 2031.”
Market Report Coverage - Single Cell RNA Sequencing
Market Segmentation
- Workflow Type - Single Cell Isolation, Single Cell Amplification and Library Preparation
- Offering Type - Consumables and Instruments
- Application Type - Oncology, Neurology, Immunology, Embryology and Others
- End-User Type - Research Organizations, Biopharmaceutical Companies and Others
Regional Segmentation
- North America - U.S., Canada
- Europe - Germany, France, Italy, U.K., Spain, and Rest-of-Europe
- Asia-Pacific - China, Japan, Australia, India, South-Korea and Rest-of-Asia-Pacific (RoAPAC)
- Rest-of-the-World
Market Growth Drivers
- Rising Applications of Single Cell RNA Sequencing in Cancer Studies and Treatment
- Increasing Awareness and Acceptance of Personalized Diagnostics on a Global Level
- Decreasing Cost of Sequencing
- Increasing Government Funding for Healthcare
Market Challenges
- Computational Challenges in Data Analysis of ScRNA Sequencing
- High Capital Requirement
- Lack of Infrastructure and Expertise
Market Opportunities
- Expansion into Emerging Markets
- Expansion into New Research Application
- Expansion of the Product Portfolio
Key Companies Profiled:
10x Genomics, Inc., BGI Group, Bio-Rad Laboratories, Inc., Becton, Dickinson and Company (BD), Fluidigm Corporation, MedGenome, NanoString Technologies, Inc., Pacific Biosciences of California, Inc., QIAGEN N.V., PerkinElmer Inc., Takara Bio, Inc., Thermo Fisher Scientific Inc.
Key Questions Answered in this Report:
- What are the key applications of single cell RNA sequencing technology?
- What are the competitor technologies of single cell RNA sequencing technology?
- What are the major drivers, challenges, and opportunities of the global single cell RNA sequencing market?
- What are the key developmental strategies implemented by the key players to stand out in this market?
- Who are the leading companies dominating the global single cell RNA sequencing market? What is the share of these companies in the global single cell RNA sequencing market?
- What are the regulations pertaining to the global single cell RNA sequencing market? What initiatives are implemented by different government bodies regulating the development and commercialization of single cell RNA sequencing?
- How is each segment of the global single cell RNA sequencing market expected to grow during the forecast period, and what will be the revenue generated by each of the segments by the end of 2031?
- How will the industry of global single cell RNA sequencing evolve during the forecast period 2021-2031?
- What is the market scenario for the global single cell RNA sequencing market in different regions?
- What are the key trends of different regions in the single cell RNA sequencing market? Which country would contribute to the highest sales of the single cell RNA sequencing market during the forecast period 2021-2031?
- What has been the impact of COVID-19 on the single cell RNA sequencing market?
Market Overview
The single cell RNA sequencing technology is developed to detect genome, transcriptome and other multi-omics of single cells. It has an advantage of analyzing single cells comprehensively that has created unprecedented opportunities for resolving the cell heterogeneity by expanding gene expression. Further, the commercial availability of next generation sequencing and increased focus on single cell analysis along with the maturing bioinformatics approaches has allowed researchers to incorporate the technology in making discoveries. The dramatic improvement within the technology has allowed it for a better usage in embryonic development, cancer biology, and immunology research.
North America represented one of the most attractive markets amongst all the markets in the world for single cell RNA sequencing in 2020. However, Europe is anticipated to gain more market shares in the coming years, which can be attributed to a large number of biotechnology based firms present in the region. Also, the demand for single cell RNA sequencing is higher in European countries. However, India is expected to be the fastest-growing nation globally, with growing affordability and awareness in the region.
The single cell RNA sequencing market is anticipated to reach a value of $2,931.3 million in 2031 from $386.7 million in 2020, witnessing a compound annual growth rate (CAGR) of 17.08% during the forecast period 2021-2031.
Within the research report, the market is segmented based on product, workflow, application, end-user and region. Each of these segments covers the snapshot of the market over the projected years, the inclination of the market revenue, underlying patterns, and trends by using analytics on the primary and secondary data obtained.
Competitive Landscape
By tracking and analyzing the major developments witnessed in the past five years (January 2017- December 2021), the global single cell RNA sequencing market witnessed approximately 23 notable key developments. These included seven product launches, three mergers and acquisitions, nine synergistic developments (partnerships, collaborations, agreements, and business expansion activities), and four business expansion and others. Most of the companies are significantly undertaking product launches and synergistic activities activities to expand their product portfolios and trying to enter untapped markets to increase their global footprint. Therefore, product launches, enhancements, and synergistic activities constitute the dominant contributor's strategies. The following figure depicts the share of key strategies undertaken by the leading companies in the global single cell RNA sequencing market.
Based on region, North America holds the largest share of the single cell RNA sequencing market due to standardised regulatory scenario and a large number of companies offering such single cell RNA sequencing services and products. Further, substantial investments made by biotechnology companies to improve the manufacturing facilities and advancing sequencing technologies along with the rise in per capita income in the region are also fuelling the growth of the respective market. Apart from this, the Asia-Pacific region is anticipated to grow at the fastest CAGR during the forecast period.
Table of Contents
1 Product Definition
- 1.1 Inclusions and Exclusions
2 Research Scope and Methodology
- 2.1 Research Scope
- 2.2 Global Single Cell RNA Sequencing Market: Research Methodology
- 2.3 Primary Data Sources
- 2.4 Secondary Data Sources
- 2.5 Market Estimation Model
- 2.6 Key Questions Answered in This Report
3 Markets
- 3.1 Market Overview
- 3.1.1 Introduction of Single Cell RNA Sequencing
- 3.1.2 Current Applications of Single Cell RNA Sequencing
- 3.1.3 Comparative Analysis of Single Cell RNA Sequencing Technology and Conventional RNA Sequencing Technology
- 3.1.4 Single Cell RNA Sequencing Market
- 3.2 Impact of COVID-19 on Global Single Cell RNA Sequencing Market
- 3.3 COVID-19 Affecting Supply Chain of Single Cell RNA Sequencing Market
- 3.4 Interruption in Research and Clinical Development and Commercial Operation
- 3.4.1 Research and Clinical Development
- 3.4.2 Commercial Operation and Access
- 3.5 Navigating Crisis Recovery and Looking to the Future
- 3.6 Legal Requirements and Regulations
- 3.6.1 Legal Requirements and Framework in the U.S.
- 3.6.2 Legal Requirements and Regulations in Europe
- 3.6.3 Legal Requirements and Framework in the Asia-Pacific
- 3.6.3.1 China
- 3.6.3.2 Japan
4 Market Dynamics
- 4.1 Market Drivers
- 4.1.1 Rising Applications of Single Cell RNA Sequencing in Cancer Studies and Treatment
- 4.1.2 Increasing Awareness and Acceptance of Personalized Diagnostics on a Global Level
- 4.1.3 Decreasing Cost of Sequencing
- 4.1.4 Increasing Government Funding for Healthcare
- 4.2 Business Challenges
- 4.2.1 Computational Challenges in Data Analysis of ScRNA Sequencing
- 4.2.2 High Capital Requirement
- 4.2.3 Lack of Infrastructure and Expertise
- 4.3 Business Opportunities
- 4.3.1 Expansion into Emerging Markets
- 4.3.2 Expansion into New Research Application
- 4.3.3 Expansion of the Product Portfolio
5 Competitive Landscape
- 5.1 New Offerings
- 5.2 Mergers and Acquisitions
- 5.3 Synergistic Activities
- 5.4 Business Expansion and Other Strategies
- 5.5 Market Share Analysis, By Company
6 Global Single Cell RNA Sequencing Market (by Offering)
- 6.1 Global Single Cell RNA Sequencing Market (by Offerings) ), $ Million, 2020-2031
- 6.1.1 Consumables
- 6.1.2 Instruments
7 Global Single Cell RNA Sequencing Market (by Workflow), $ Million, 2020-2031
- 7.1 Single Cell Isolation
- 7.1.1 Laser Capture Microscopy (LCM)
- 7.1.2 Flow-Activated Cell Sorting (FACS)
- 7.1.3 Magnetic-Activated Cell Sorting (MACS)
- 7.1.4 Microfluidics
- 7.2 Single Cell Amplification
- 7.3 Library Preparation
8 Global Single Cell RNA Sequencing Market (by Application), $ Million, 2020-2031
- 8.1.1 Oncology
- 8.1.2 Immunology
- 8.1.3 Neurology
- 8.1.4 Embryology
- 8.1.5 Others
9 Global Single Cell RNA Sequencing (by End User), $Million, 2020 and 2031
- 9.1 Research Organizations
- 9.2 Biopharmaceutical Companies
- 9.3 Others
10 Global Single Cell RNA Sequencing Market (by Region) , $ Million, 2020-2031
- 10.1 North America
- 10.1.1 U.S.
- 10.1.2 Canada
- 10.2 Europe
- 10.2.1 U.K.
- 10.2.2 Germany
- 10.2.3 Italy
- 10.2.4 Spain
- 10.2.5 France
- 10.2.6 Rest-of-Europe
- 10.3 Asia-Pacific
- 10.3.1 Japan
- 10.3.2 China
- 10.3.3 India
- 10.3.4 South Korea
- 10.3.5 Australia
- 10.3.6 Rest-of-Asia-Pacific
- 10.4 Rest-of-the-World
11 Company Profiles
- 11.1 Company Profiles
- 11.2 10x Genomics, Inc.
- 11.2.1 Company Overview
- 11.2.2 Role of 10x Genomics, Inc. in Global Single Cell RNA Sequencing Market
- 11.2.3 Key Competitors of the Company
- 11.2.4 Financials
- 11.2.5 Key Insights About Financial Health of the Company
- 11.2.6 SWOT Analysis
- 11.3 BGI Group
- 11.3.1 Company Overview
- 11.3.2 Role of BGI Group in the Global Single Cell RNA Sequencing Market
- 11.3.3 Key Competitors of the Company
- 11.3.4 SWOT Analysis
- 11.4 Bio-Rad Laboratories, Inc.
- 11.4.2 Company Overview
- 11.4.3 Role of Bio-Rad Laboratories, Inc. in the Global Single Cell RNA Sequencing Market
- 11.4.4 Key Competitors of the Company
- 11.4.5 Financials
- 11.4.6 Key Insights About Financial Health of the Company
- 11.4.7 SWOT Analysis
- 11.5 Becton, Dickinson and Company (BD)
- 11.5.1 Company Overview
- 11.5.2 Role of Becton, Dickinson and Company (BD) in the Global Single Cell RNA Sequencing Market
- 11.5.3 Key Competitors of the Company
- 11.5.4 Financials
- 11.5.5 Key Insights About Financial Health of the Company
- 11.5.6 SWOT Analysis
- 11.6 Fluidigm Corporation
- 11.6.1 Company Overview
- 11.6.2 Role of Fluidigm Corporation in the Global Single Cell RNA Sequencing Market
- 11.6.3 Key Competitors of the Company
- 11.6.4 Key Insights About Financial Health of the Company
- 11.6.5 SWOT Analysis
- 11.7 MedGenome
- 11.7.1 Company Overview
- 11.7.2 Role of MedGenome in the Global Single Cell RNA Sequencing Market
- 11.7.3 Key Competitors of the Company
- 11.7.4 SWOT Analysis
- 11.8 NanoString Technologies, Inc.
- 11.8.1 Company Overview
- 11.8.2 Role of NanoString Technologies, Inc. in the Global Single Cell RNA Sequencing Market
- 11.8.3 Key Competitors of the Company
- 11.8.4 Key Insights About Financial Health of the Company
- 11.8.5 SWOT Analysis
- 11.9 Pacific Biosciences of California, Inc.
- 11.9.1 Company Overview
- 11.9.2 Role of Pacific Biosciences of California, Inc. in the Global Single Cell RNA Sequencing Market
- 11.9.3 Key Competitors of the Company
- 11.9.4 Financials
- 11.9.5 Key Insights About Financial Health of the Company
- 11.9.6 SWOT Analysis
- 11.1 QIAGEN N.V.
- 11.10.1 Company Overview
- 11.10.2 Role of QIAGEN N.V. in the Global Single Cell RNA Sequencing Market
- 11.10.3 Key Competitors of the Company
- 11.10.4 Financials
- 11.10.5 Key Insights About Financial Health of the Company
- 11.10.6 SWOT Analysis
- 11.11 PerkinElmer Inc.
- 11.11.1 Company Overview
- 11.11.2 Role of PerkinElmer Inc. in the Global Single Cell RNA Sequencing Market
- 11.11.3 Key Competitors of the Company
- 11.11.4 Financials
- 11.11.5 Key Insights About Financial Health of the Company
- 11.11.6 SWOT Analysis
- 11.12 Takara Bio, Inc.
- 11.12.1 Company Overview
- 11.12.2 Role of Takara Bio, Inc. in the Global Single Cell RNA Sequencing Market
- 11.12.3 Key Competitors of the Company
- 11.12.4 Key Insights about Financial Health of Company
- 11.12.5 SWOT Analysis
- 11.13 Thermo Fisher Scientific Inc.
- 11.13.1 Company Overview
- 11.13.2 Role of Thermo Fisher Scientific Inc. in the Global Single Cell RNA Sequencing Market
- 11.13.3 Key Competitors of the Company
- 11.13.4 Financials
- 11.13.5 Key Insights About Financial Health of the Company
- 11.13.6 SWOT Analysis
Emerging Companies
- 11.14 Biomage Ltd.
- 11.15 Nucleome Informatics Pvt Ltd.
- 11.16 Scailyte
- 11.17 Analytical Biosciences Limited.