|
|
市場調査レポート
商品コード
1149185
IoTソリューション&サービスの世界市場 (2022年~2027年):動向・予測Global IoT Solutions and Services Market: Trends and Forecast (2022-2027) |
||||||
|
|
|||||||


| IoTソリューション&サービスの世界市場 (2022年~2027年):動向・予測 |
|
出版日: 2022年11月04日
発行: BCC Research
ページ情報: 英文 174 Pages
納期: 即納可能
|
- 全表示
- 概要
- 図表
- 目次
世界のIoTソリューション&サービスの市場規模は、2022年の2,251億米ドルから、2027年には4,806億米ドルに達し、2022年から2027年の予測期間中のCAGRは16.4%となる見通しです。
製造業の部門は、2022年の753億米ドルから、2027年には1,455億米ドルに達し、予測期間中のCAGRは14.1%となる見込みです。また、エネルギー・ユーティリティの部門は、2022年の324億米ドルから、2027年には847億米ドルに達し、予測期間中のCAGRは21.2%となると予測されています。
当レポートでは、世界のIoTソリューション&サービスの市場を調査し、市場の定義と概要、市場成長への各種影響因子の分析、市場規模の推移・予測、各種区分・地域/主要国別の内訳、競合環境、主要企業のプロファイルなどをまとめています。
目次
第1章 イントロダクション
第2章 サマリー・ハイライト
第3章 市場概要・技術背景
- 概要
- IoTソリューション&サービスの進化
- バリューチェーン分析
- ポーターのファイブフォース分析
- COVID-19の市場への影響
- ロシア・ウクライナ戦争の市場への影響
第4章 市場力学
- 市場力学
- 促進要因
- 抑制要因
- 機会
- 課題
第5章 市場内訳:提供区分別
- 概要
- IoTソリューション
- 端末管理
- データ管理
- アプリケーション管理
- ネットワーク管理
- スマート監視
- IoTサービス
- プロフェッショナルサービス
- マネージドサービス
第6章 市場内訳:展開別
- 概要
- クラウド
- オンプレミス
第7章 市場内訳:組織規模別
- 概要
- 大企業
- 中小企業
- プロセスの最適化
- 予知保全
- 顧客管理
- リアルタイム監視
第8章 市場内訳:産業別
- 概要
- 製造業
- コネクテッド製品
- コネクテッド製造
- サプライチェーン
- 予知保全
- 自動車・輸送
- フリート管理・テレマティクス
- コネクテッドカー
- 自動車整備システム
- エネルギー・ユーティリティ
- ヘルスケア
- リモートヘルスモニタリング
- スマートホスピタル
- 医療資産追跡
- ヘルスケアスタッフ管理
- 小売
- 施設管理・消費者行動分析
- サプライチェーン
- スマートシェルフ
- スマートデジタルサイネージ
- スマート自動販売機
- 石油・ガス
- リアルタイム設備モニタリング
- 労働者の安全
- 予知保全
- 農業
- 精密農業
- 家畜モニタリング
- ガイダンス&ナビゲーション
- 建物インフラ
- セキュリティ・監視
- 設備管理
- ホームオートメーション
- その他
第9章 市場内訳:地域別
- 概要
- 北米
- 欧州
- アジア太平洋
- その他の地域
第10章 競合情勢
- 主要企業
- 戦略分析
第11章 企業プロファイル
- AERIS
- AMAZON WEB SERVICES INC.(AMAZON.COM INC.)
- ANDERSEN INC.
- ARM LTD.
- BOSCH.IO GMBH(BOSCH GMBH)
- CISCO SYSTEMS INC.
- CLEARBLADE
- GE DIGITAL(GENERAL ELECTRIC)
- HUAWEI TECHNOLOGIES CO. LTD.
- IBM
- INTEL CORP.
- MICROSOFT CORP.
- ORACLE CORP.
- OXAGILE
- PTC INC.
- SOFTWARE AG
- SUMATOSOFT
第12章 付録:頭字語のリスト
List of Tables
- Summary Table : Global Market for IoT Solutions and Services, by Industry, Through 2027
- Table 1 : IoT Solutions and Services Evolution Timeline: Overview
- Table 2 : Porter's Five Forces Analysis: Overview
- Table 3 : Global Market for IoT Solutions and Services, by Offering, Through 2027
- Table 4 : Global Market for Solutions in IoT Solutions and IoT Services, by Region, Through 2027
- Table 5 : List of Professional IoT Services
- Table 6 : Global Market for Services in IoT Solutions and Services, by Region, Through 2027
- Table 7 : Global Market for IoT Solutions and Services, by Deployment, Through 2027
- Table 8 : Global Market for Cloud Deployment of IoT Solutions and Services, by Region, Through 2027
- Table 9 : Global Market for On-premise Deployment of IoT Solutions and Services, by Region, Through 2027
- Table 10 : Global Market for IoT Solutions and Services, by Organization Size, Through 2027
- Table 11 : Global Market for IoT Solutions and Services in Large Enterprises, by Region, Through 2027
- Table 12 : Global Market for IoT Solutions and Services in Small and Medium Size Enterprises, by Region, Through 2027
- Table 13 : Global Market for IoT Solutions and Services, by Industry, Through 2027
- Table 14 : Global Market for IoT Solutions and Services in the Manufacturing Industry, by Region, Through 2027
- Table 15 : Global Market for IoT Solutions and Services in the Automotive and Transportation Industry, by Region, Through 2027
- Table 16 : Global Market for IoT Solutions and Services in the Energy and Utilities Industry, by Region, Through 2027
- Table 17 : Global Market for IoT Solutions and Services in the Healthcare Industry, by Region, Through 2027
- Table 18 : Global Market for IoT Solutions and Services in the Retail Industry, by Region, Through 2027
- Table 19 : Global Market for IoT Solutions and Services in the Oil and Gas Industry, by Region, Through 2027
- Table 20 : Global Market for IoT Solutions and Services in the Agriculture Industry, by Region, Through 2027
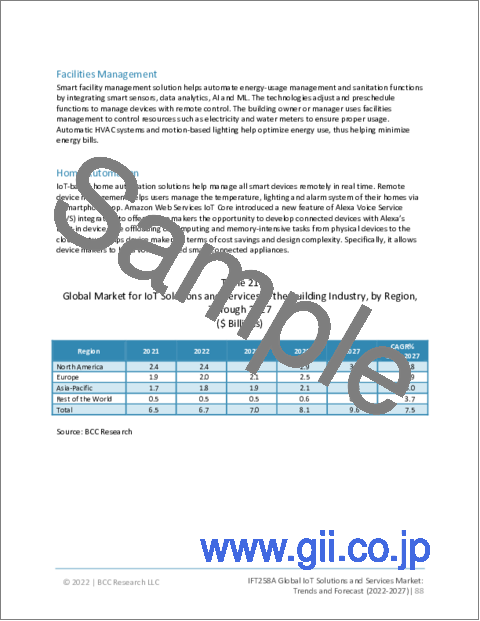
- Table 21 : Global Market for IoT Solutions and Services in the Building Industry, by Region, Through 2027
- Table 22 : Global Market for IoT Solutions and Services in the Other Industries, by Region, Through 2027
- Table 23 : Global Market for IoT Solutions and Services, by Region, Through 2027
- Table 24 : North American Market for IoT Solutions and Services, by Country, Through 2027
- Table 25 : North American Market for IoT Solutions and Services, by Offering, Through 2027
- Table 26 : North American Market for IoT Solutions and Services, by Deployment, Through 2027
- Table 27 : North American Market for IoT Solutions and Services, by Organization Size, Through 2027
- Table 28 : North American Market for IoT Solutions and Services, by Industry, Through 2027
- Table 29 : European Market for IoT Solutions and Services, by Country, Through 2027
- Table 30 : European Market for IoT Solutions and Services, by Offering, Through 2027
- Table 31 : European Market for IoT Solutions and Services, by Deployment, Through 2027
- Table 32 : European Market for IoT Solutions and Services, by Organization Size, Through 2027
- Table 33 : European Market for IoT Solutions and Services, by Industry, Through 2027
- Table 34 : APAC Market for IoT Solutions and Services, by Country, Through 2027
- Table 35 : APAC Market for IoT Solutions and Services, by Offering, Through 2027
- Table 36 : APAC Market for IoT Solutions and Services, by Deployment, Through 2027
- Table 37 : APAC Market for IoT Solutions and Services, by Organization Size, Through 2027
- Table 38 : APAC Market for IoT Solutions and Services, by Industry, Through 2027
- Table 39 : Rest of the World Market for IoT Solutions and Services, by Region, Through 2027
- Table 40 : Rest of the World Market for IoT Solutions and Services, by Offering, Through 2027
- Table 41 : Rest of the World Market for IoT Solutions and Services, by Deployment, Through 2027
- Table 42 : Rest of the World Market for IoT Solutions and Services, by Organization Size, Through 2027
- Table 43 : Rest of the World Market for IoT Solutions and Services, by Industry, Through 2027
- Table 44 : Product Innovations in the Global Market for IoT Solutions and Services, March 2021 to September 2022
- Table 45 : Partnerships and Acquisitions in the Global Market for IoT Solutions and Services, January 2021 to August 2022
- Table 46 : Collaborations, Agreements, Alliances and Expansions in the Global Market for IoT Solutions and Services, February 2021 to September 2022
- Table 47 : Aeris: IoT Solutions and Services Offerings
- Table 48 : Aeris: Recent Developments, 2022
- Table 49 : Amazon.com Inc.: Recent Financial Performance, 2019-2021
- Table 50 : Amazon Web Services Inc.: IoT Solutions and Services Offerings
- Table 51 : Amazon Web Services Inc.: Recent Developments, 2021 and 2022
- Table 52 : Andersen Inc.: IoT Solutions and Services Offerings
- Table 53 : Arm Ltd.: IoT Solutions and Services Offerings
- Table 54 : Arm Ltd.: Recent Developments, 2021 and 2022
- Table 55 : Bosch GmbH: Recent Financial Performance, FY 2019-FY 2021
- Table 56 : Bosch.IO GmbH: IoT Solutions and Services Offerings
- Table 57 : Bosch.IO GmbH: Recent Developments, 2021 and 2022
- Table 58 : Cisco Systems Inc.: Recent Financial Performance, FY 2019-FY 2021
- Table 59 : Cisco Systems Inc.: IoT Solutions and Services Offerings
- Table 60 : Cisco Systems Inc.: Recent Developments, 2021 and 2022
- Table 61 : ClearBlade: IoT Solutions and Services Offerings
- Table 62 : ClearBlade: Recent Developments, 2021 and 2022
- Table 63 : General Electric: Recent Financial Performance, FY 2019-FY 2021
- Table 64 : GE Digital: IoT Solutions and Services Offerings
- Table 65 : GE Digital: Recent Developments, 2021 and 2022
- Table 66 : Huawei Technologies Co. Ltd.: Recent Financial Performance, FY 2019-FY 2021
- Table 67 : Huawei Technologies Co. Ltd.: IoT Solutions and Services Offerings
- Table 68 : Huawei Technologies Co. Ltd.: Recent Developments, 2021 and 2022
- Table 69 : IBM: Recent Financial Performance, FY 2019-FY 2021
- Table 70 : IBM: IoT Solutions and Services Offerings
- Table 71 : IBM: Recent Developments, 2021 and 2022
- Table 72 : Intel Corp.: Recent Financial Performance, FY 2019-FY 2021
- Table 73 : Intel Corp.: IoT Solutions and Services Offerings
- Table 74 : Intel Corp.: Recent Developments, 2021
- Table 75 : Microsoft Corp.: Recent Financial Performance, FY 2020-FY 2022
- Table 76 : Microsoft Corp.: IoT Solutions and Services Offerings
- Table 77 : Microsoft Corp.: Recent Developments, 2021 and 2022
- Table 78 : Oracle Corp.: Recent Financial Performance, 2020-2022
- Table 79 : Oracle Corp.: IoT Solutions and Services Offerings
- Table 80 : Oracle Corp.: Recent Developments, 2021 and 2022
- Table 81 : PTC Inc.: Recent Financial Performance, 2019-2021
- Table 82 : PTC Inc.: IoT Solutions and Services Offerings
- Table 83 : PTC Inc.: Recent Developments, 2021
- Table 84 : Software AG: Recent Financial Performance, FY 2019-FY 2021
- Table 85 : Software AG: IoT Solutions and Service Offerings
- Table 86 : Software AG: Recent Developments, 2021 and 2022
- Table 87 : List of Acronyms
List of Figures
- Summary Figure : Global Market for IoT Solutions and Services, 2021-2027
- Figure 1 : IoT Process
- Figure 2 : IoT Solutions and Services: Value Chain
- Figure 3 : Porter's Five Forces Analysis
- Figure 4 : Market for IoT Solutions and Services: Supplier Bargaining Power
- Figure 5 : Market for IoT Solutions and Services: Buyer Bargaining Power
- Figure 6 : Market for IoT Solutions and Services: Threat of New Entrants
- Figure 7 : Market for IoT Solutions and Services: Competitive Rivalry
- Figure 8 : Average Cost of IoT Sensors, 2004-2020
- Figure 9 : Wireless Connectivity Adoption in IoT Applications
- Figure 10 : Number of Identified Customers in Major Industries Deploying Private Mobile Networks in Trials and Commercially, Global, as of 2021
- Figure 11 : Global Market Shares of IoT Solutions and Services, by Offering, 2021
- Figure 12 : IoT Solutions Benefit
- Figure 13 : Device Management Process
- Figure 14 : IoT Data Management and Lifecycle
- Figure 15 : Global Market Shares of Solutions in IoT Solutions and IoT Services, by Region, 2021
- Figure 16 : AWS Professional Services
- Figure 17 : Global Market Shares of Services in IoT Solutions and Services, by Region, 2021
- Figure 18 : Global Market Shares of IoT Solutions and Services, by Deployment, 2021
- Figure 19 : Global Market Shares of Cloud Deployment of IoT Solutions and Services, by Region, 2021
- Figure 20 : Global Market Shares of On-premise Deployment of IoT Solutions and Services, by Region, 2021
- Figure 21 : Global Market Shares of IoT Solutions and Services, by Organization Size, 2021
- Figure 22 : Global Market Shares of IoT Solutions and Services in Large Enterprises, by Region, 2021
- Figure 23 : Global Market Shares of IoT Solutions and Services in Small and Medium Size Enterprises, by Region, 2021
- Figure 24 : Global Market Shares of IoT Solutions and Services, by Industry, 2021
- Figure 25 : Global Market Shares of IoT Solutions and Services in the Manufacturing Industry, by Region, 2021
- Figure 26 : Global Market Shares of IoT Solutions and Services in the Automotive and Transportation Industry, by Region, 2021
- Figure 27 : Global Market Shares of IoT Solutions and Services in the Energy and Utilities Industry, by Region, 2021
- Figure 28 : IoT Applications in Healthcare
- Figure 29 : IoT Architecture in Medical Asset Monitoring
- Figure 30 : Global Market Shares of IoT Solutions and Services in the Healthcare Industry, by Region, 2021
- Figure 31 : Global Market Shares of IoT Solutions and Services in the Retail Industry, by Region, 2021
- Figure 32 : Global Market Shares of IoT Solutions and Services in the Oil and Gas Industry, by Region, 2021
- Figure 33 : Global Market Shares of IoT Solutions and Services in the Agriculture Industry, by Region, 2021
- Figure 34 : Global Market Shares of IoT Solutions and Services in the Building Industry, by Region, 2021
- Figure 35 : Global Market Shares of IoT Solutions and Services in the Other Industries, by Region, 2021
- Figure 36 : Global Market Shares of IoT Solutions and Services, by Region, 2021
- Figure 37 : North American Market Shares of IoT Solutions and Services, by Country, 2021
- Figure 38 : North American Market Shares of IoT Solutions and Services, by Offering, 2021
- Figure 39 : North American Market Shares of IoT Solutions and Services, by Deployment, 2021
- Figure 40 : North American Market Shares of IoT Solutions and Services, by Organization Size, 2021
- Figure 41 : North American Market Shares of IoT Solutions and Services, by Industry, 2021
- Figure 42 : U.S. Market for IoT Solutions and Services, 2021-2027
- Figure 43 : Canadian Market for IoT Solutions and Services, 2021-2027
- Figure 44 : European Market Shares of IoT Solutions and Services, by Country, 2021
- Figure 45 : European Market Shares of IoT Solutions and Services, by Offering, 2021
- Figure 46 : European Market Shares of IoT Solutions and Services, by Deployment, 2021
- Figure 47 : European Market Shares of IoT Solutions and Services, by Organization Size, 2021
- Figure 48 : European Market Shares of IoT Solutions and Services, by Industry, 2021
- Figure 49 : U.K. Market for IoT Solutions and Services, 2021-2027
- Figure 50 : German Market for IoT Solutions and Services, 2021-2027
- Figure 51 : French Market for IoT Solutions and Services, 2021-2027
- Figure 52 : Italian Market for IoT Solutions and Services, 2021-2027
- Figure 53 : Rest of Europe Market for IoT Solutions and Services, 2021-2027
- Figure 54 : APAC Market Shares of IoT Solutions and Services, by Country, 2021
- Figure 55 : APAC Market Shares of IoT Solutions and Services, by Offering, 2021
- Figure 56 : APAC Market Shares of IoT Solutions and Services, by Deployment, 2021
- Figure 57 : APAC Market Shares of IoT Solutions and Services, by Organization Size, 2021
- Figure 58 : APAC Market Shares of IoT Solutions and Services, by Industry, 2021
- Figure 59 : Chinese Market for IoT Solutions and Services, 2021-2027
- Figure 60 : Japanese Market for IoT Solutions and Services, 2021-2027
- Figure 61 : Indian Market for IoT Solutions and Services, 2021-2027
- Figure 62 : South Korean Market for IoT Solutions and Services, 2021-2027
- Figure 63 : Rest of APAC Market for IoT Solutions and Services, 2021-2027
- Figure 64 : Rest of the World Market Shares of IoT Solutions and Services, by Region, 2021
- Figure 65 : Rest of the World Market Shares of IoT Solutions and Services, by Offering, 2021
- Figure 66 : Rest of the World Market Shares of IoT Solutions and Services, by Deployment, 2021
- Figure 67 : Rest of the World Market Shares of IoT Solutions and Services, by Organization Size, 2021
- Figure 68 : Rest of the World Market Shares of IoT Solutions and Services, by Industry, 2021
- Figure 69 : Amazon.com Inc.: Revenue Share, by Segment, 2021
- Figure 70 : Amazon.com Inc.: Revenue Share, by Region, 2021
- Figure 71 : Bosch GmbH: Revenue Share, by Segment, FY 2021
- Figure 72 : Bosch GmbH: Revenue Share, by Region, FY 2021
- Figure 73 : Cisco Systems Inc.: Revenue Share, by Segment, FY 2021
- Figure 74 : Cisco Systems Inc.: Revenue Share, by Region, FY 2021
- Figure 75 : General Electric: Revenue Share, by Product Segment, 2021
- Figure 76 : General Electric: Revenue Share, by Region, 2021
- Figure 77 : Huawei Technologies Co. Ltd.: Revenue Share, by Segment, FY 2021
- Figure 78 : Huawei Technologies Co. Ltd.: Revenue Share, by Region, FY 2021
- Figure 79 : IBM: Revenue Share, by Segment, FY 2021
- Figure 80 : IBM: Revenue Share, by Region, FY 2021
- Figure 81 : Intel Corp.: Revenue Share, by Segment, 2021
- Figure 82 : Intel Corp.: Revenue Share, by Region, 2021
- Figure 83 : Microsoft Corp.: Revenue Share, by Segment, FY 2022
- Figure 84 : Microsoft Corp.: Revenue Share, by Region, FY 2022
- Figure 85 : Oracle Corp.: Revenue Share, by Business Segment, 2022
- Figure 86 : Oracle Corp.: Revenue Share, by Region, 2022
- Figure 87 : PTC Inc.: Revenue Share, by Segment, 2021
- Figure 88 : PTC Inc.: Revenue Share, by Region, 2021
- Figure 89 : Software AG: Revenue Share, by Segment, FY 2021
- Figure 90 : Software AG: Revenue Share, by Region, FY 2021
Highlights:
The global IoT solutions and services market should reach $225.1 billion by 2022 and $480.6 billion by 2027, with a compound annual growth rate (CAGR) of 16.4% during the forecast period of 2022-2027.
The manufacturing segment of the global IoT solutions and services market should reach $75.3 billion by 2022 and $145.5 billion by 2027, with a CAGR of 14.1% during the forecast period of 2022-2027.
The energy and utilities segment of the global IoT solutions and services market should reach $32.4 billion by 2022 and $84.7 billion by 2027, with a CAGR of 21.2% during the forecast period of 2022-2027.
Report Scope:
The report provides an overview of the global IoT solutions and services market and analyzes market trends. Using 2021 as the base year, the report provides estimated market data for 2022 through 2027. Revenue forecasts for this period are segmented based on offering, deployment, organization size, industries and regions. The report also focuses on the major driving trends and challenges that affect the market. The report concludes with detailed profiles of the major global IoT solutions and services market players. The study of IoT solutions and services includes the industrial aspect of the market and does not include consumer IoT.
Report Includes:
- 52 data tables and 36 additional tables
- A brief general outlook of the global market for Internet of Things (IoT) based solutions and services
- Analyses of the global market trends, with historic market revenue data for 2021, estimates for 2022, and projections of compound annual growth rates (CAGRs) through 2027
- Highlights of the growth potential for global IoT solutions and services market, and areas of focus to forecast this market into various segments and sub-segments
- Estimation of the actual market size for IoT solutions and services, revenue forecast, and corresponding market share analysis by component, deployment, organization size, application, and geographic region
- In-depth information (facts and figures) concerning market opportunities, drivers and challenges, technology advancements, industry value chain, and COVID-19 impact on the marketplace
- Insight into recent industry structure, competitive aspects of each product segment, major growth strategies, and company value share analysis based on their segmental revenues
- Updated information on key mergers and acquisition deals, agreements, collaborations and product launches within the global IoT solutions and services market
- Review of key patent grants and intellectual property aspects of the IoT solutions and services market
- Company profiles of major players within the industry, including Amazon.com Inc., Bosch GmbH, General Electric, Huawei Technologies Co. Ltd., Intel Corp. and Microsoft Corp.
Table of Contents
Chapter 1 Introduction
- 1.1 Overview
- 1.2 Study Goals and Objectives
- 1.3 Reasons for Doing This Study
- 1.4 Scope of Report
- 1.5 Information Sources
- 1.6 Methodology
- 1.7 Intended Audience
- 1.8 Geographic Breakdown
- 1.9 Analyst's Credentials
- 1.10 BCC Custom Research
- 1.11 Related BCC Research Reports
Chapter 2 Summary and Highlights
Chapter 3 Market Overview and Technology Background
- 3.1 Overview
- 3.2 Evolution of IoT Solutions and Services
- 3.3 Value Chain Analysis
- 3.4 Porter's Five Forces Analysis
- 3.4.1 Supplier Bargaining Power
- 3.4.2 Buyer Bargaining Power
- 3.4.3 Threat of New Entrants
- 3.4.4 Competitive Rivalry
- 3.4.5 Threat of Substitutes
- 3.5 Impact of COVID-19 on the Market
- 3.5.1 Positive Impact
- 3.6 Impact of Russia-Ukraine War on the Market
- 3.6.1 Negative Impact
- 3.6.2 Positive Impact
Chapter 4 Market Dynamics
- 4.1 Market Dynamics
- 4.1.1 Drivers
- 4.1.2 Restraints
- 4.1.3 Opportunities
- 4.1.4 Challenges
Chapter 5 Market Breakdown by Offering
- 5.1 Overview
- 5.2 IoT Solutions
- 5.2.1 Device Management
- 5.2.2 Data Management
- 5.2.3 Application Management
- 5.2.4 Network Management
- 5.2.5 Smart Surveillance
- 5.3 IoT Services
- 5.3.1 Professional Services
- 5.3.2 Managed Services
Chapter 6 Market Breakdown by Deployment
- 6.1 Overview
- 6.2 Cloud
- 6.3 On-premise
Chapter 7 Market Breakdown by Organization Size
- 7.1 Overview
- 7.2 Large Enterprises
- 7.3 Small and Medium Size Enterprises
- 7.3.1 Process Optimization
- 7.3.2 Predictive Maintenance
- 7.3.3 Customer Management
- 7.3.4 Real-Time Monitoring
Chapter 8 Market Breakdown by Industry
- 8.1 Overview
- 8.2 Manufacturing
- 8.2.1 Connected Products
- 8.2.2 Connected Production
- 8.2.3 Supply Chain
- 8.2.4 Predictive Maintenance
- 8.3 Automotive and Transportation
- 8.3.1 Fleet Management and Telematics
- 8.3.2 Connected Cars
- 8.3.3 Automotive Maintenance System
- 8.4 Energy and Utilities
- 8.5 Healthcare
- 8.5.1 Remote Health Monitoring
- 8.5.2 Smart Hospital
- 8.5.3 Medical Asset Tracking
- 8.5.4 Healthcare Staff Management
- 8.6 Retail
- 8.6.1 Facility Management and Consumer Behavior Analysis
- 8.6.2 Supply Chain
- 8.6.3 Smart Shelves
- 8.6.4 Smart Digital Signage
- 8.6.5 Smart Vending Machines
- 8.7 Oil and Gas
- 8.7.1 Real-Time Equipment Monitoring
- 8.7.2 Worker Safety
- 8.7.3 Predictive Maintenance
- 8.8 Agriculture
- 8.8.1 Precision Farming
- 8.8.2 Livestock Monitoring
- 8.8.3 Guidance and Navigation
- 8.9 Building Infrastructure
- 8.9.1 Security and Surveillance
- 8.9.2 Facilities Management
- 8.9.3 Home Automation
- 8.10 Others
Chapter 9 Market Breakdown by Region
- 9.1 Overview
- 9.2 North America
- 9.2.1 U.S.
- 9.2.2 Canada
- 9.3 Europe
- 9.3.1 U.K.
- 9.3.2 Germany
- 9.3.3 France
- 9.3.4 Italy
- 9.3.5 Rest of Europe
- 9.4 Asia-Pacific
- 9.4.1 China
- 9.4.2 Japan
- 9.4.3 India
- 9.4.4 South Korea
- 9.4.5 Rest of Asia-Pacific
- 9.5 Rest of the World
- 9.5.1 South America
- 9.5.2 Middle East and Africa
Chapter 10 Competitive Landscape
- 10.1 Top Companies
- 10.2 Strategic Analysis
- 10.2.1 Product Innovations
- 10.2.2 Partnerships and Acquisitions
Chapter 11 Company Profiles
- AERIS
- AMAZON WEB SERVICES INC. (AMAZON.COM INC.)
- ANDERSEN INC.
- ARM LTD.
- BOSCH.IO GMBH (BOSCH GMBH)
- CISCO SYSTEMS INC.
- CLEARBLADE
- GE DIGITAL (GENERAL ELECTRIC)
- HUAWEI TECHNOLOGIES CO. LTD.
- IBM
- INTEL CORP.
- MICROSOFT CORP.
- ORACLE CORP.
- OXAGILE
- PTC INC.
- SOFTWARE AG
- SUMATOSOFT